
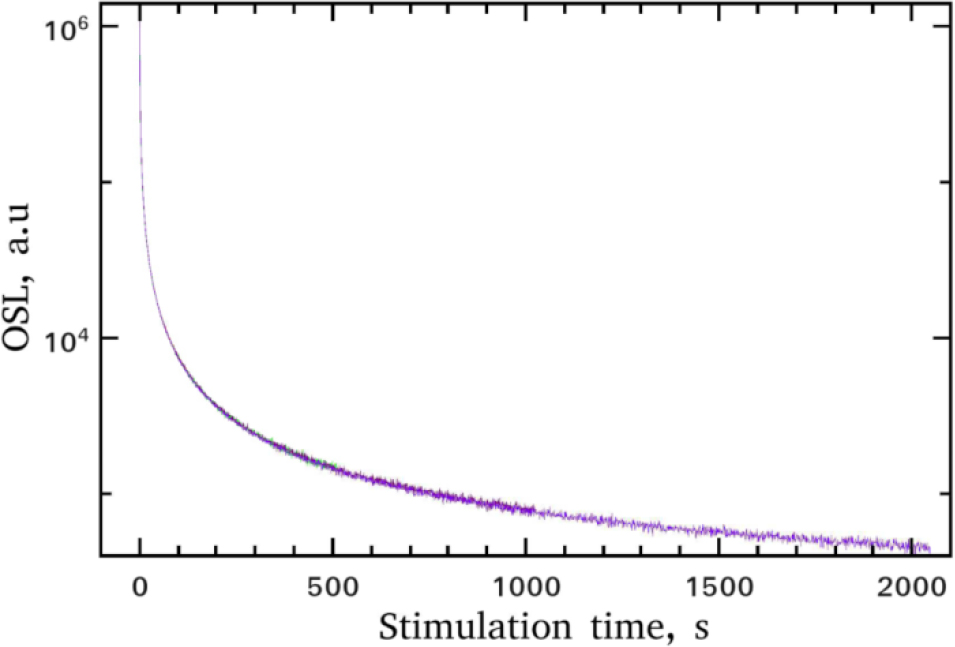
Fig. 1
CW-OSL decay curves received at room temperature, using blue light for stimulation times 128, 256, 512, 1024 and 2048 s, which coincide. This experimental feature yields the excellent reproducibility the measuring sequence.
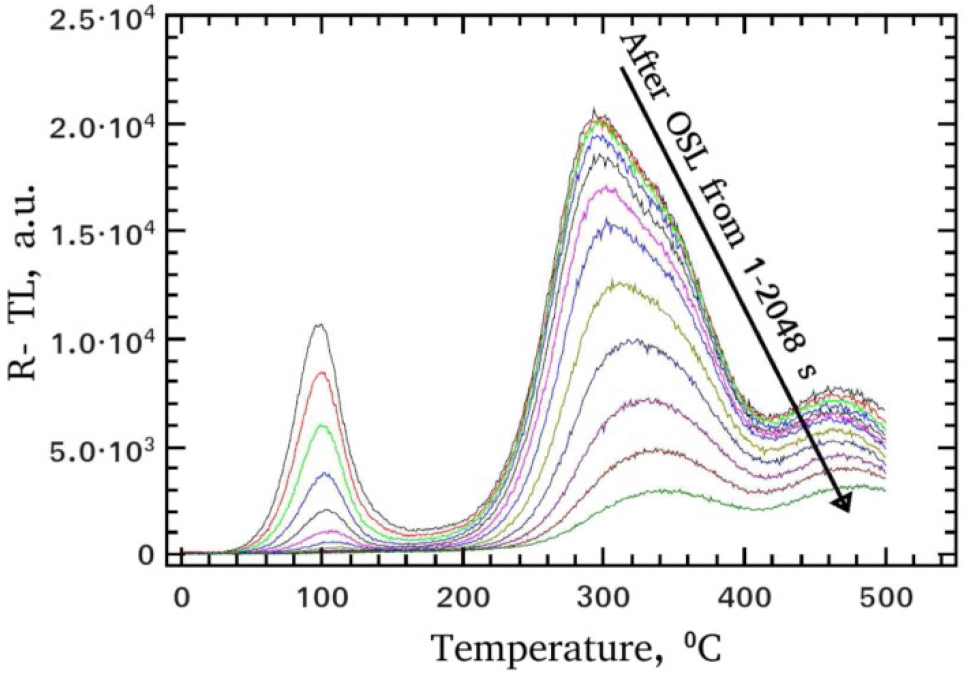
Fig. 2
Shapes of the R-TL glow-curves received after bleaching with blue light for all stimulation times, ranging between 1 and 2048 s.
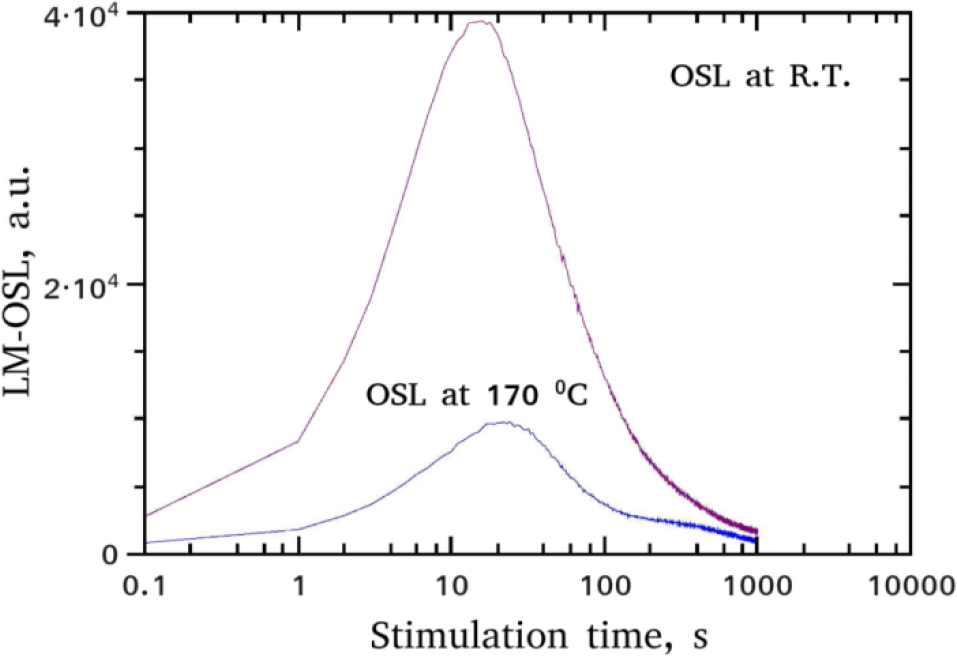
Fig. 3
Shapes of the LM-OSL curves received at RT and at 170°C after a pre-heat at 180°C.
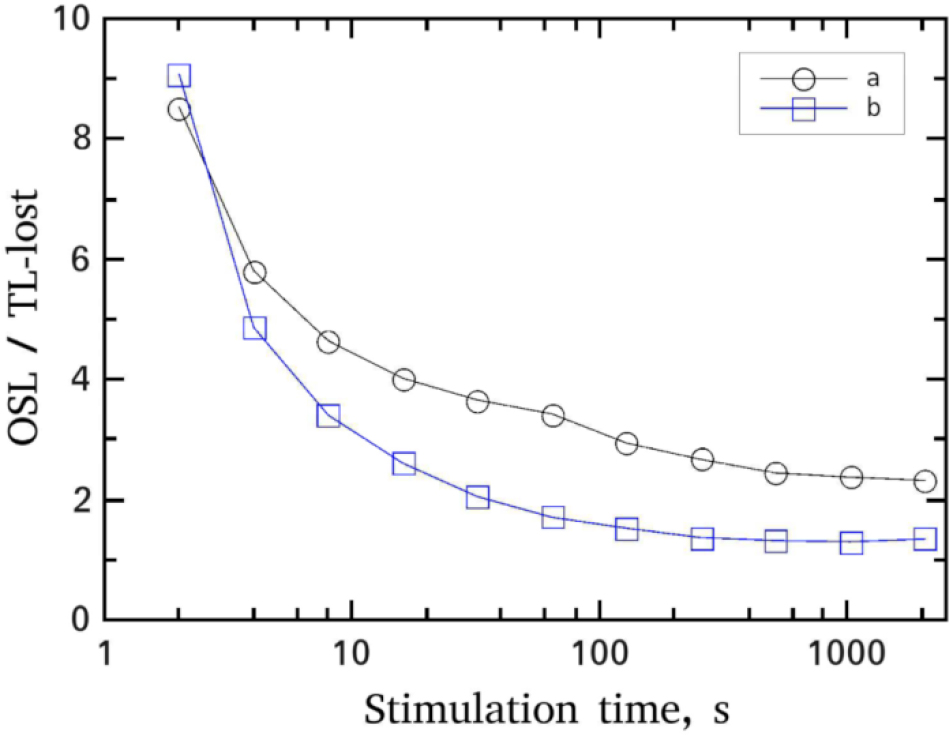
Fig. 4
The ratio of integrated CW-OSL over the TL-lost during the various stimulation times. The TL-lost is defined as the difference between the total integrals of the un-bleached glow-curve minus the bleached TL glow-curves (a) For OSL measured at RT and (b) for OSL measured at 170°C.
Table 1
The values of the trapping parameters of MgO resulting from the CGCD analysis using both general order kinetics and OTOR analytical equation.
| Peak no. | Tm (°C) | E (eV) | R | b | %OSL (RT) | %OSL (170°C) |
|---|---|---|---|---|---|---|
| 1 | 102 ± 2 | 0.90 ± 0.09 | 0.42 ± 0.07 | 1.40 ± 0.02 | 12.50 | - |
| 2 | 132 ± 1 | 0.94 ± 0.11 | 0.76 ± 0.17 | 1.97 ± 0.05 | 1.50 | - |
| 3 | 194 ± 2 | 0.82 ± 0.03 | 0.90 ± 0.06 | 1.55 ± 0.05 | 1.55 | 1.30 |
| 4 | 292 ± 4 | 1.13 ± 0.05 | 0.65 ± 0.16 | 1.60 ± 0.10 | 38.12 | 50.44 |
| 5 | 353 ± 3 | 1.24 ± 0.03 | 0.81 ± 0.04 | 1.90 ± 0.07 | 30.64 | 32.94 |
| 6 | 464 ± 2 | 1.45 ± 0.04 | 0.71 ± 0.07 | 1.79 ± 0.17 | 15.27 | 14.59 |
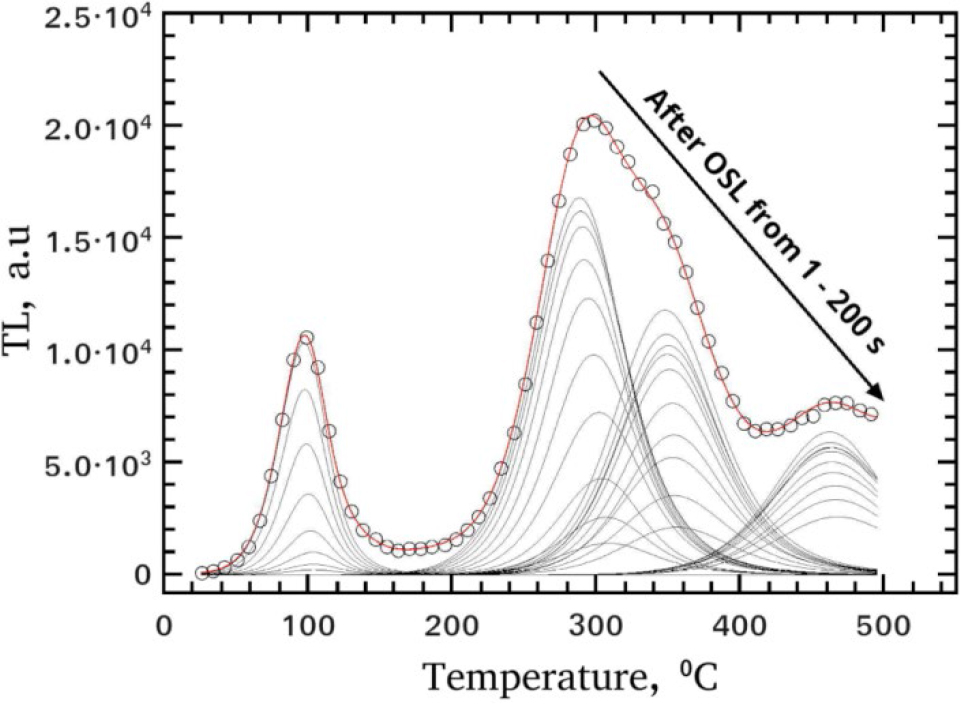
Fig. 5
Results of the CGCD analysis of RTL glow-curves after CWOSL at RT using Eqs. 3.5 and 3.6. The open circles represent the experimental glow-curve after CW-OSL for 1 s. The line through the experimental points is the fitting line. The continuous lines present the results of the CGCD of all R-TL glow-curves of Fig. 2 without the repeating of the experimental curves. The results for fitting parameters are listed in Table 1.
Table 2
The fitting parameters of the RTL integrated signals as a function of the bleaching time using both general order and OTOR analytical equations. The values are the mean between of the values obtained by the two different equations. The error values provide a strong indication towards the agreement of the two different Equations used.
| Peak Tm (°C) | OSL T | τ1 (s) | % | τ2 (s) | % |
|---|---|---|---|---|---|
| 102 | RT | 6.34 ± 0.71 | 90 | 75 ± 11 | 10 |
| 134+194 | RT | 5.68 ± 1.91 | 85 | 150 ± 40 | 15 |
| 292 | RT | 276 ± 15 | 72 | 2726 ± 380 | 28 |
| 353 | RT | 130 ± 31 | 28 | 2350 ± 280 | 72 |
| 464 | RT | 221 ± 25 | 20 | 2750 ± 360 | 80 |
| 292 | 170°C | 98 ± 7 | 58 | 782 ± 42 | 42 |
| 353 | 170°C | 85 ± 18 | 20 | 828 ± 40 | 80 |
| 464 | 170°C | 55 ± 10 | 07 | 1920 ±210 | 93 |
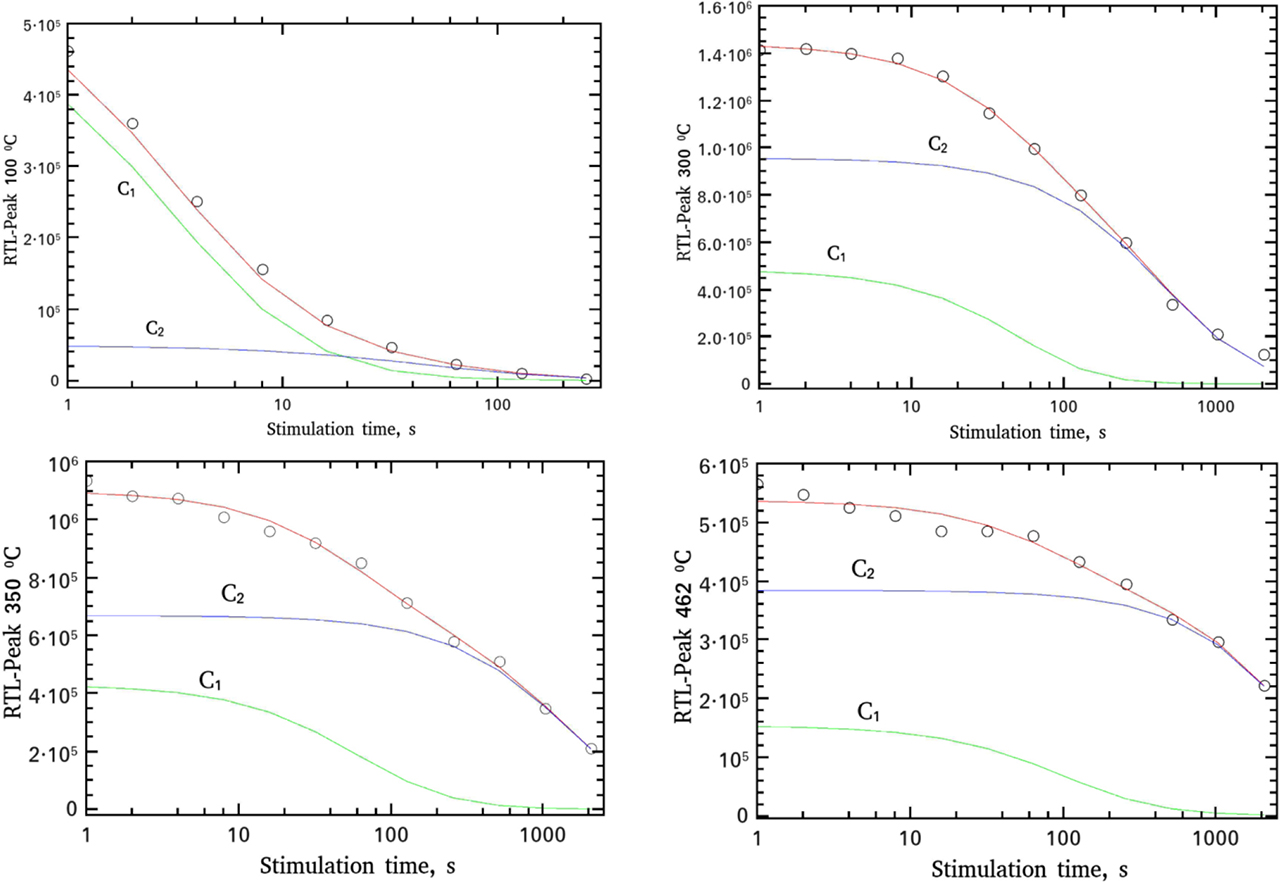
Fig. 6
Analysis examples of R-TL decay curves based on the integrated signal of the main R-TL glow-peaks resulted from CGCD analysis shown individually in Fig.5. The fit was performed using Eqs. 3.1 and 3.4. The results of the fitting parameters are listed in Table 2.
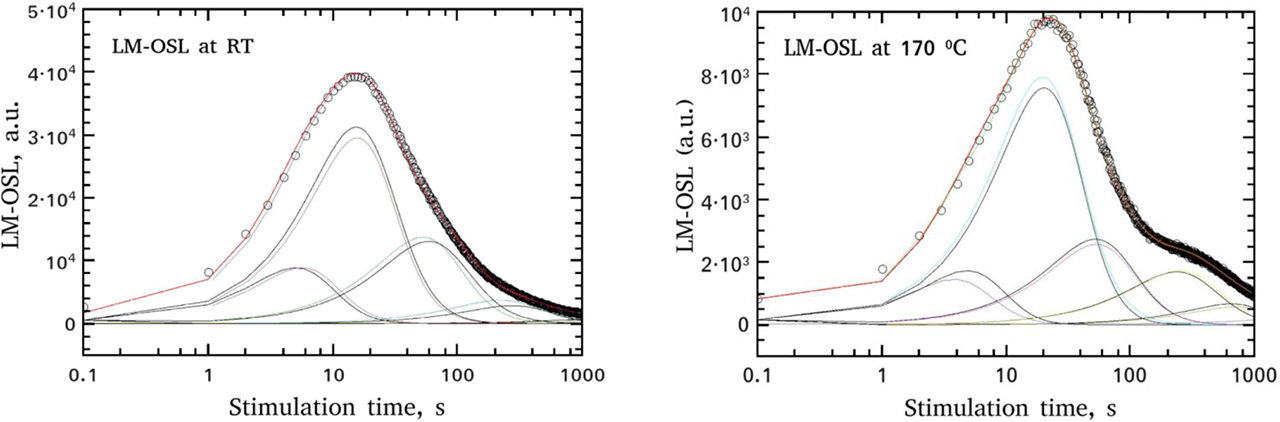
Fig. 7
Component resolved of LM-OSL curves received at RT and at 170°C after a pre-heat at 180°C, using Eqs. 3.8 and 3.9. The results of the fitting parameters are listed in Table 3.
Table 3
The fitting parameters from the analysis of the LM-OSL curve using both general order and OTOR analytical equations. The values are the mean between of the values obtained by the two different equations. Error values provide a strong indication towards the agreement of the two different Equations used.
| Component | OSL T | tm (s) | τ (s) | R | b | % |
|---|---|---|---|---|---|---|
| C1 | RT | 5.38 ± 0.45 | 0.036 ± 0.003 | 0.6 | 1.7 | 2 ± 0.15 |
| C2 | RT | 15.64 ± 0.22 | 0.306 ± 0.003 | 0.7 | 1.8 | 23.3 ± 1.1 |
| C3 | RT | 55.9 ± 4.1 | 3.9 ± 0.003 | 0.83 | 1.9 | 35.5 ± 4 |
| C4 | RT | 248 ± 38 | 76.9 ± 0.003 | 0.93 | 1.8 | 31.9 ± 2.9 |
| C5 | RT | 1151 ± 450 | 1667 ± 0.003 | 0.01 | 1.1 | 7.29 ± 0.16 |
| C1 | 170°C | 4.33 ± 0.7 | 0.024 ± 0.003 | 0.68 | 1.6 | 0.74 ± 0.18 |
| C2 | 170°C | 20.01 ± 0.40 | 0.506 ± 0.003 | 0.83 | 1.65 | 17.5 ± 1.3 |
| C3 | 170°C | 53 ± 0.5 | 3.51 ± 0.003 | 0.81 | 1.8 | 16.4 ± 0.5 |
| C4 | 170°C | 244.8 ± 9.5 | 74.42 ± 0.003 | 0.94 | 1.9 | 43.9 ± 2.1 |
| C5 | 170°C | 723 ± 92 | 653 ± 0.003 | 0.51 | 1.4 | 21.4 ± 2.5 |