
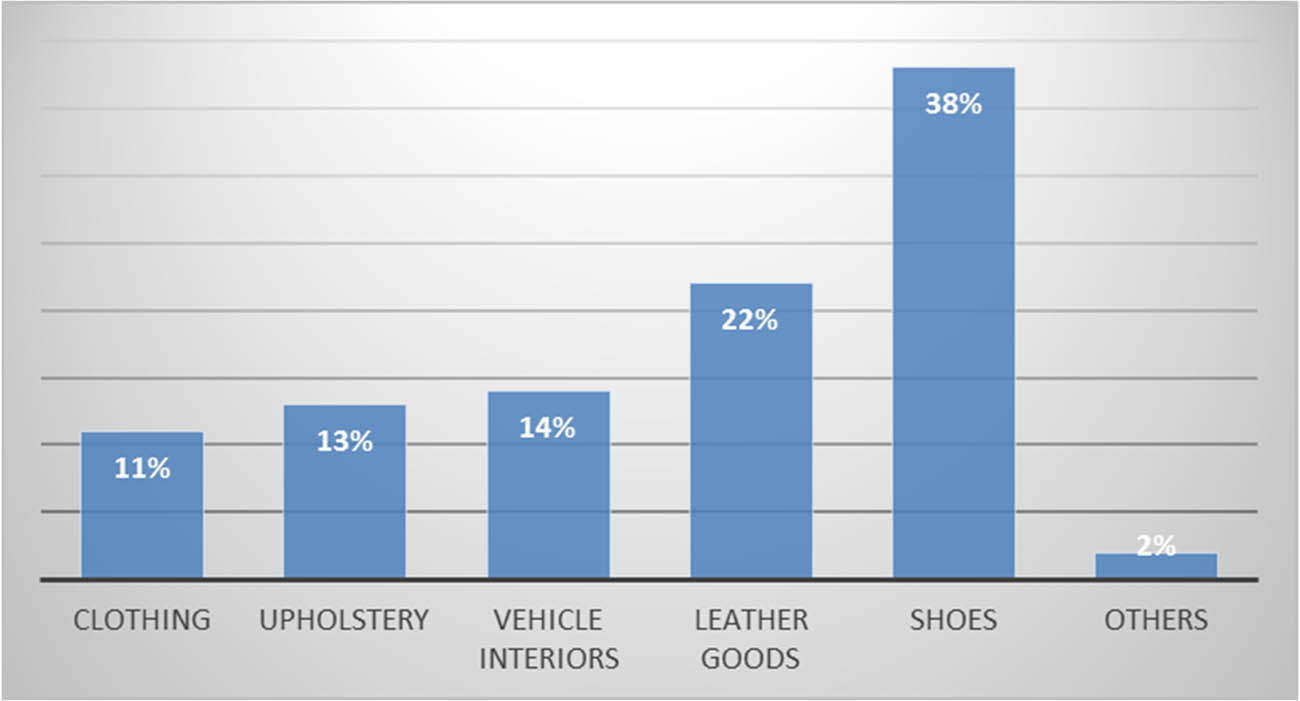
Figure 1
Use of leather in the EU by application (share of total leather output, 2018).
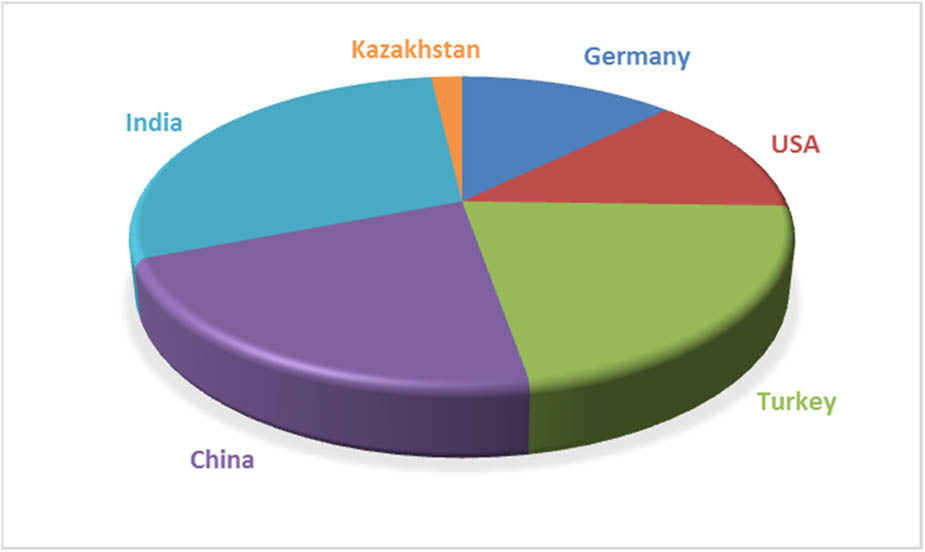
Figure 2
Share of light industry in gross domestic product (selected countries, circa 2018).
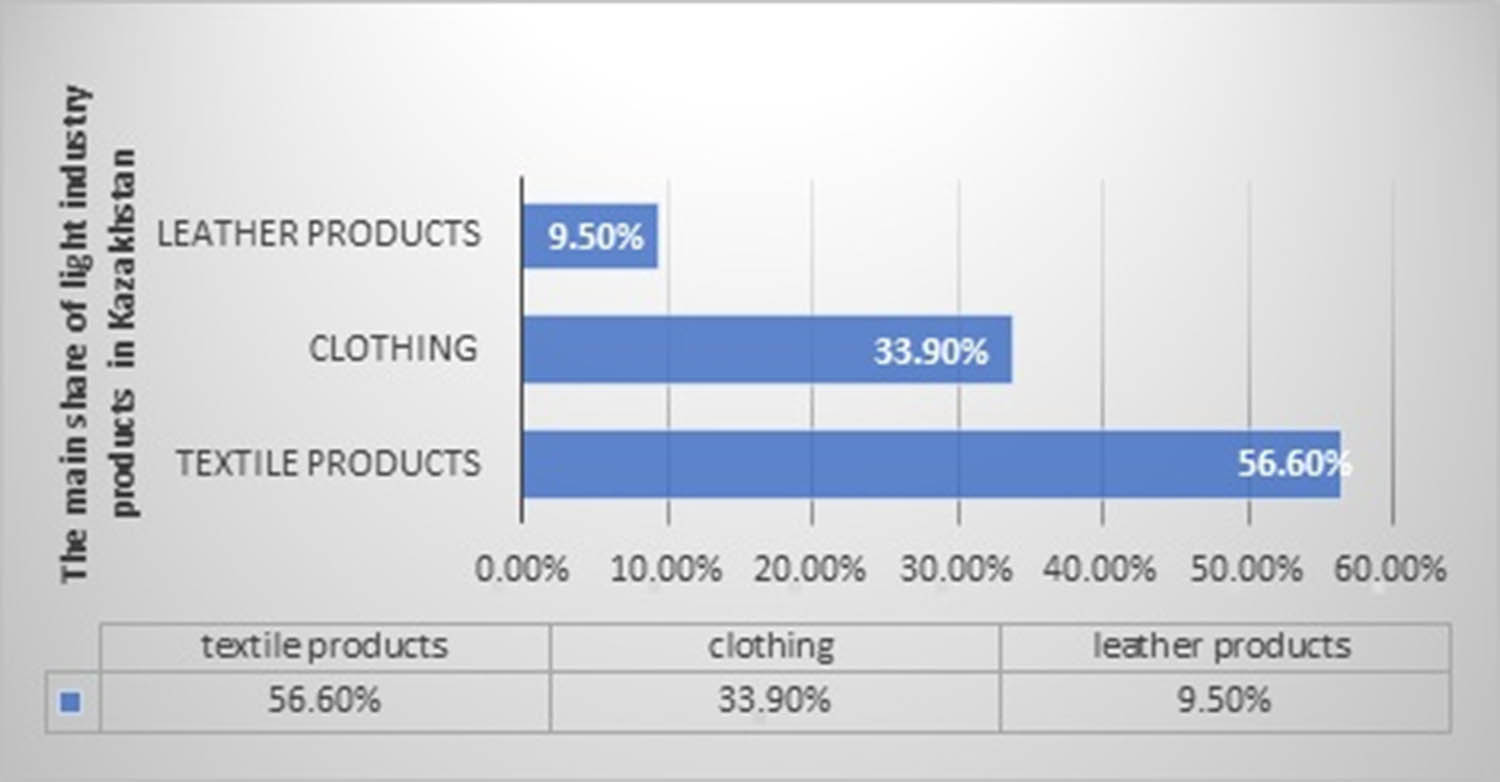
Figure 3
The main share of light industry products in Kazakhstan (2022).
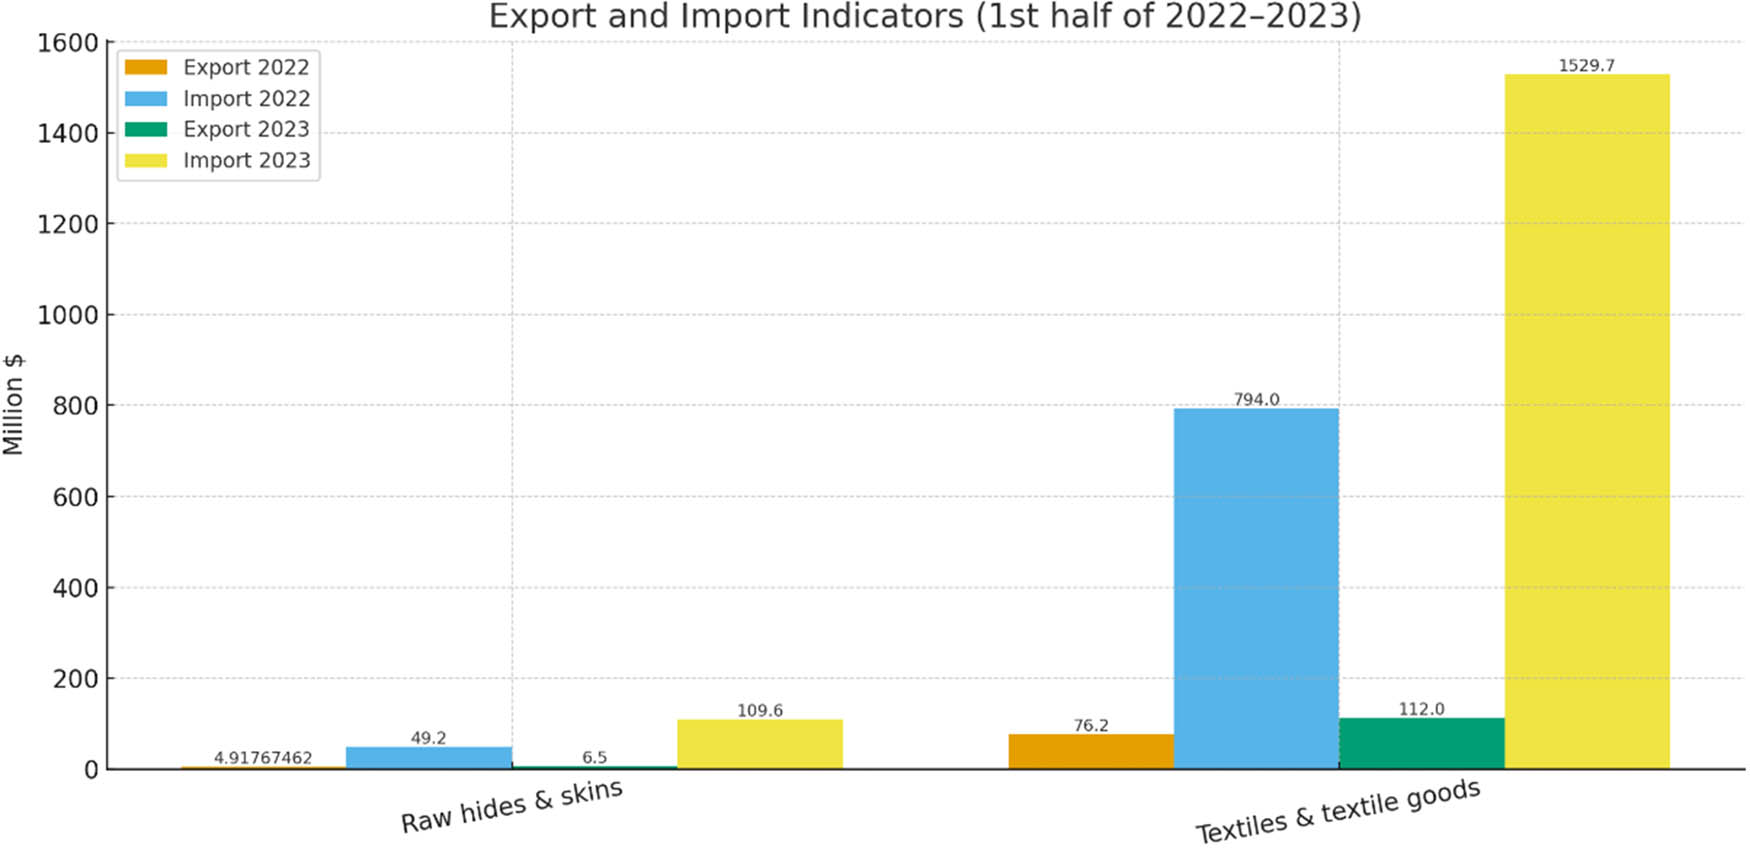
Figure 4
The structure of exports and imports according to official statistics in 2022 and 2023 million dollars.
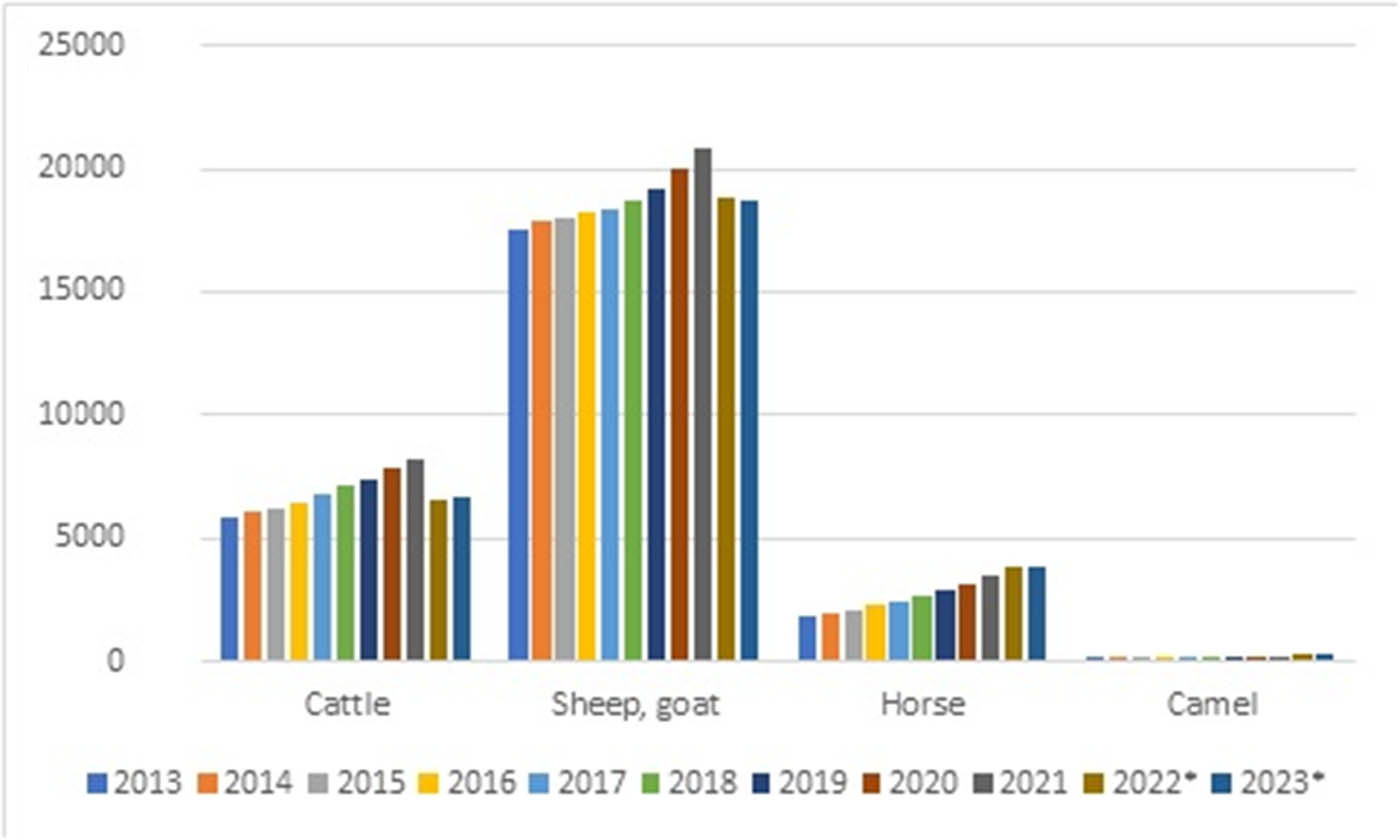
Figure 5
Number of livestock in Kazakhstan (2022–2023), thousands.
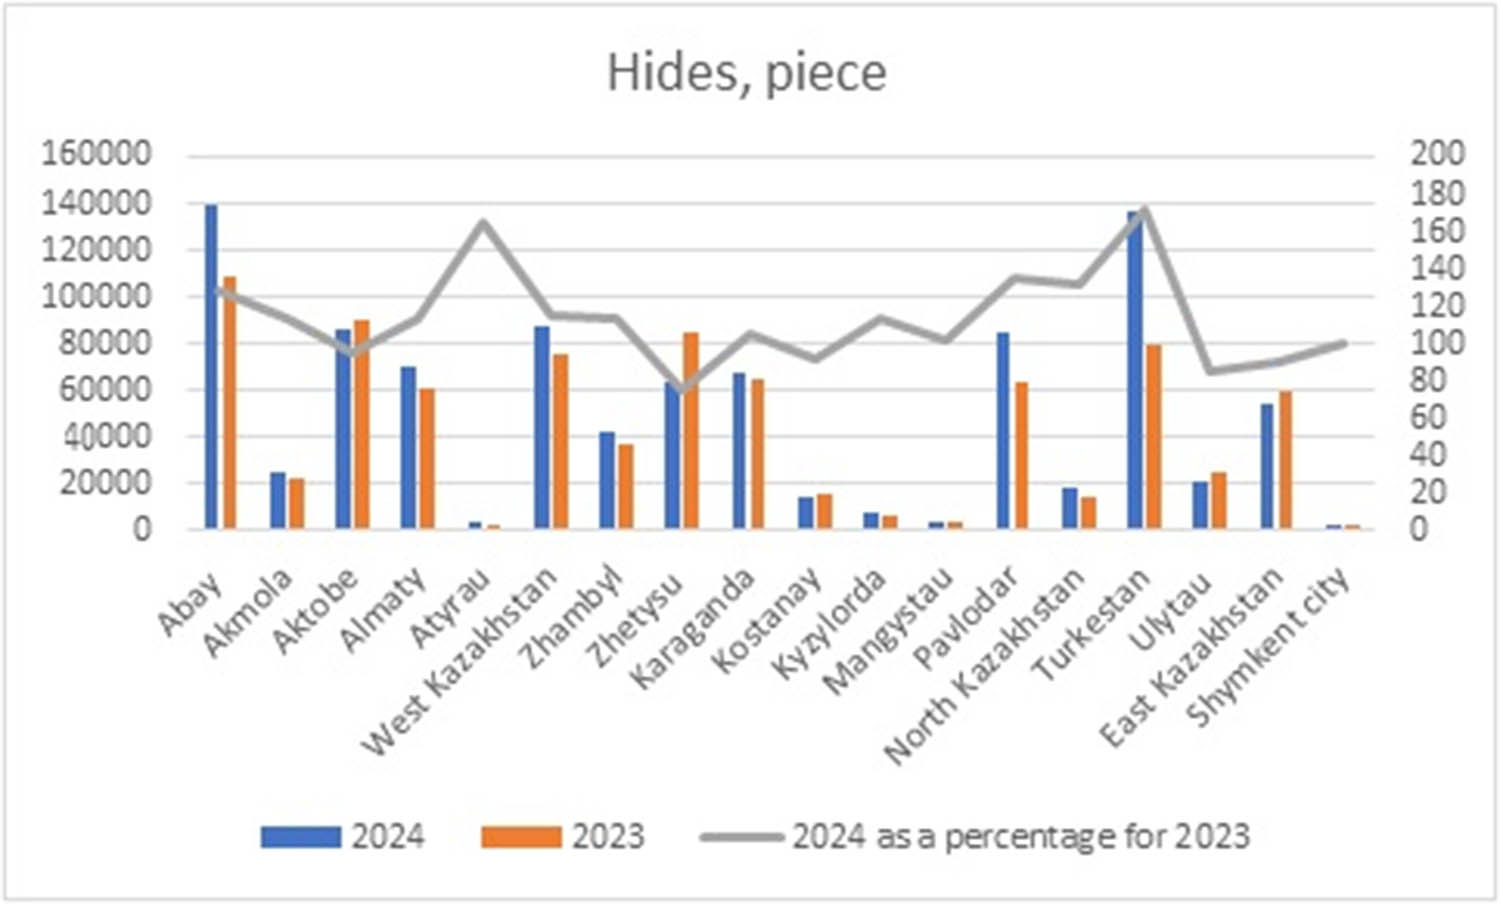
Figure 6
Hides in Kazakhstan for 2023–2024 (pieces).
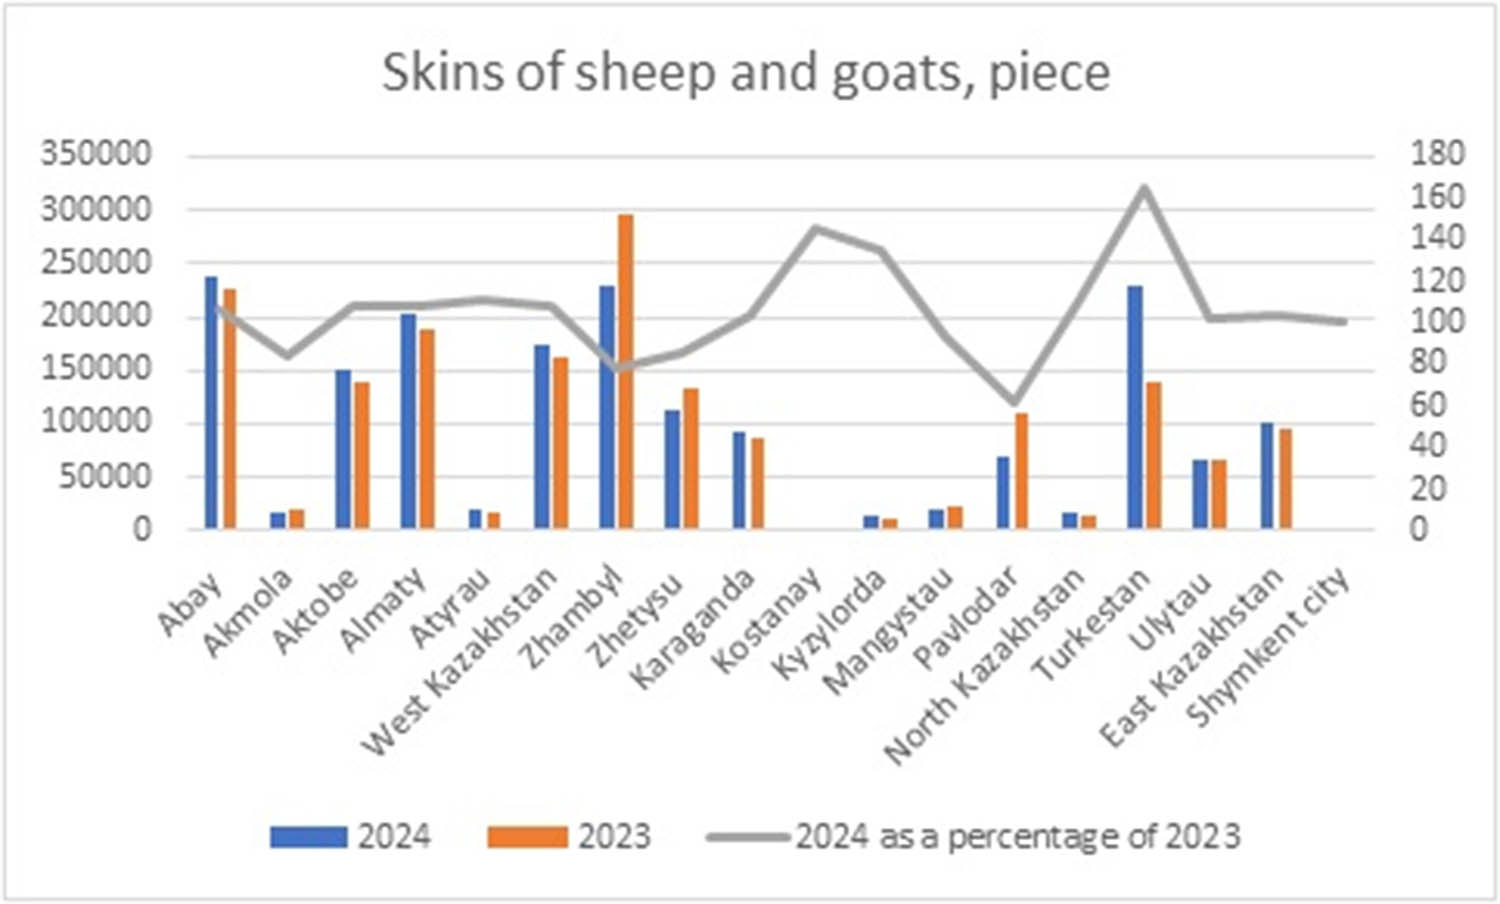
Figure 7
Skins of sheep and goat in Kazakhstan (pieces).
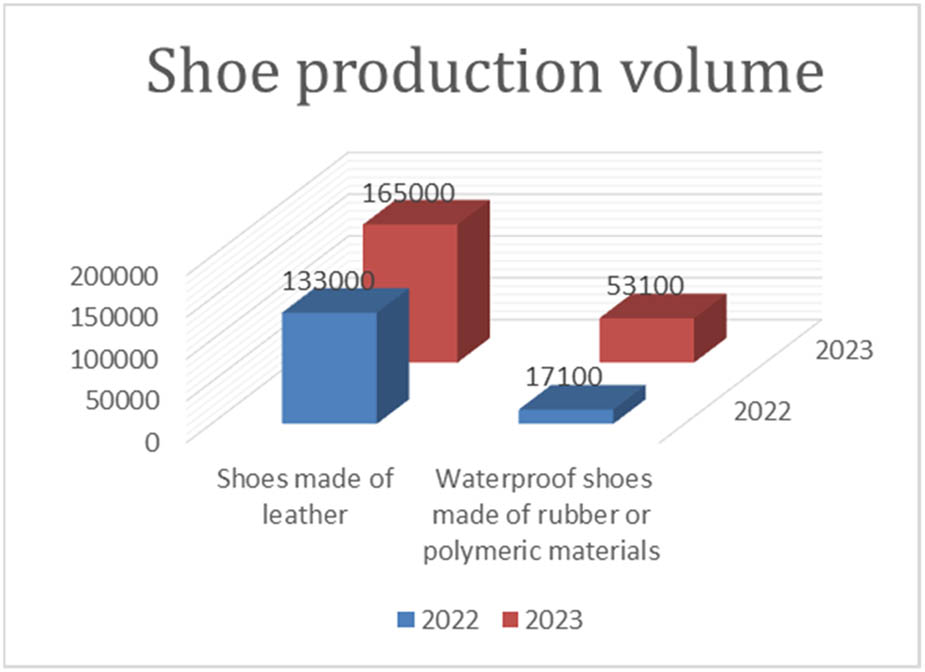
Figure 8
Volume of shoe production in the Republic of Kazakhstan.
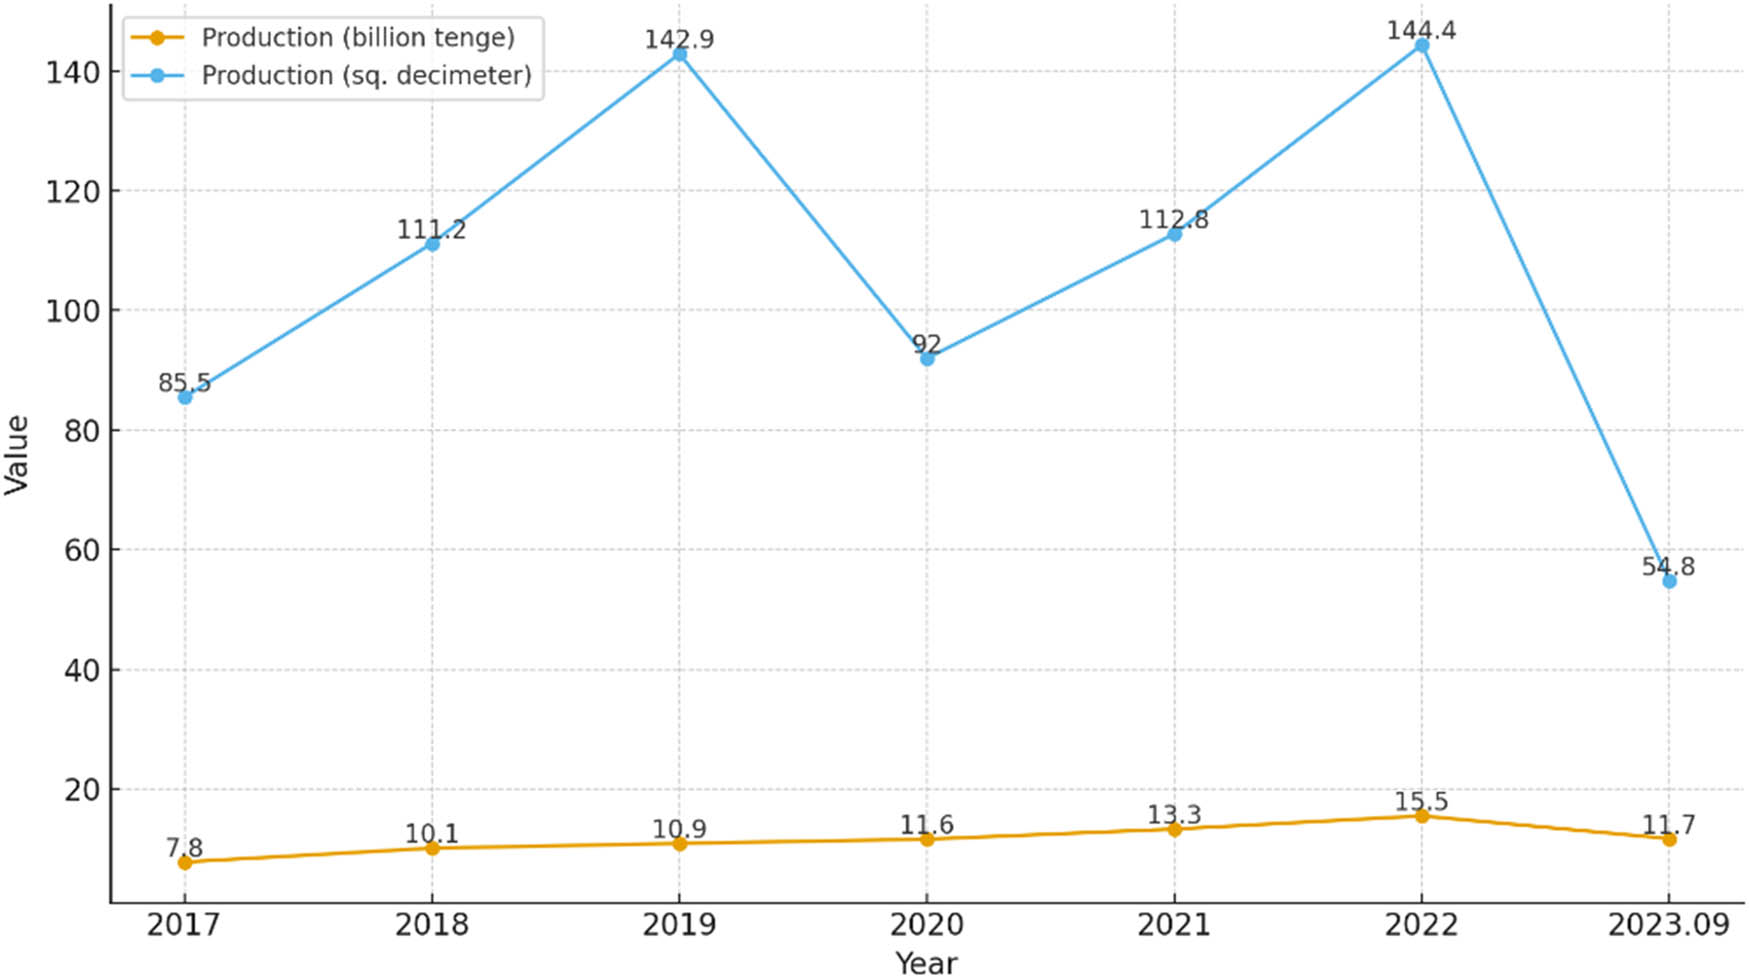
Figure 9
Export of leather and leather products production.
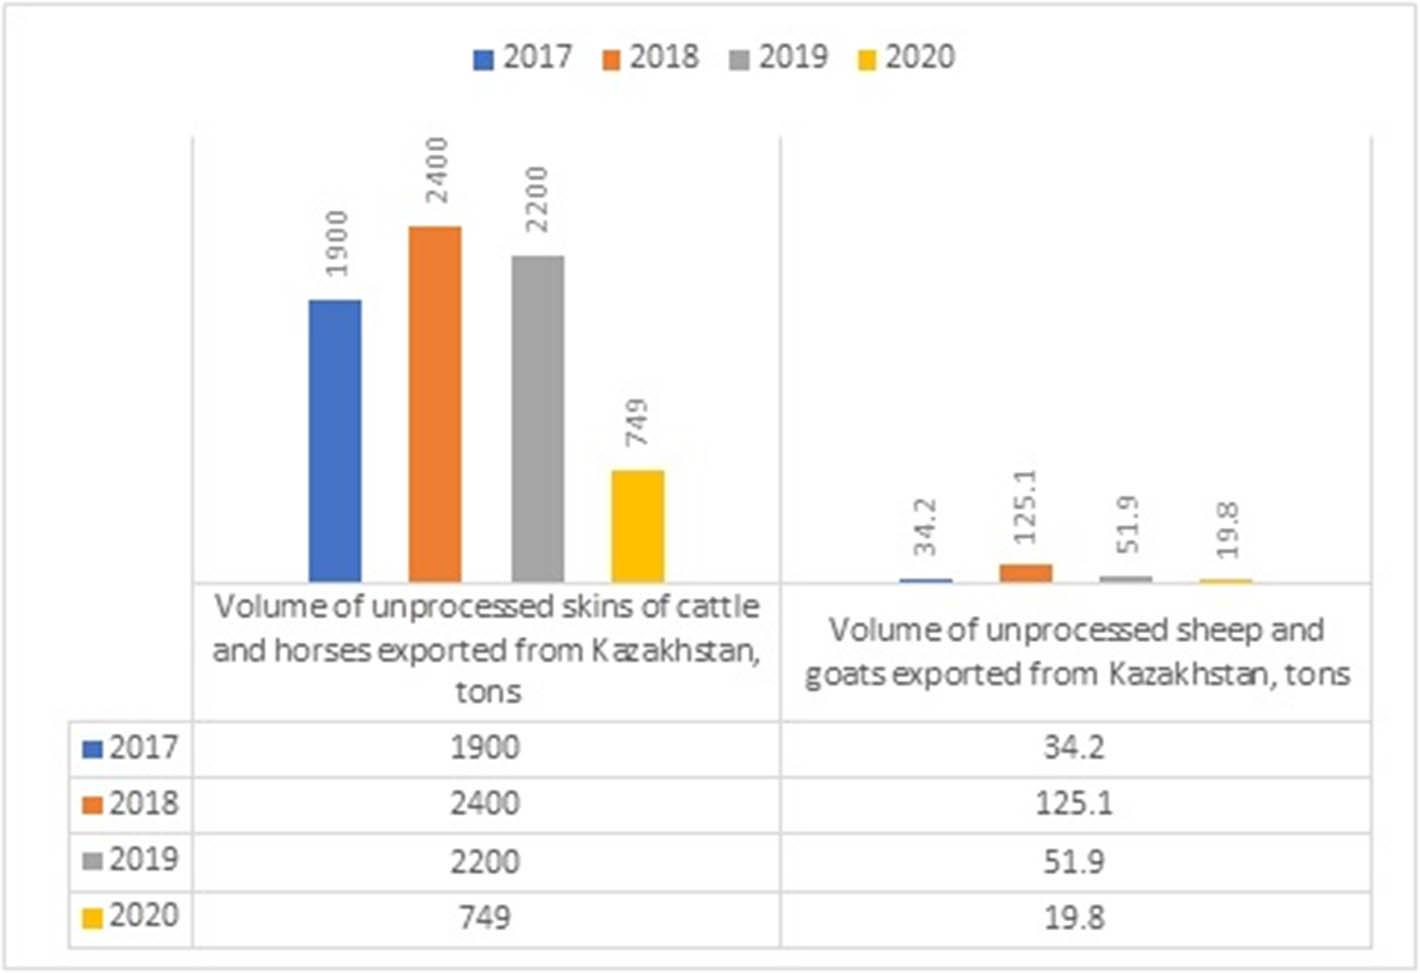
Figure 10
Volume of skins exported from Kazakhstan.
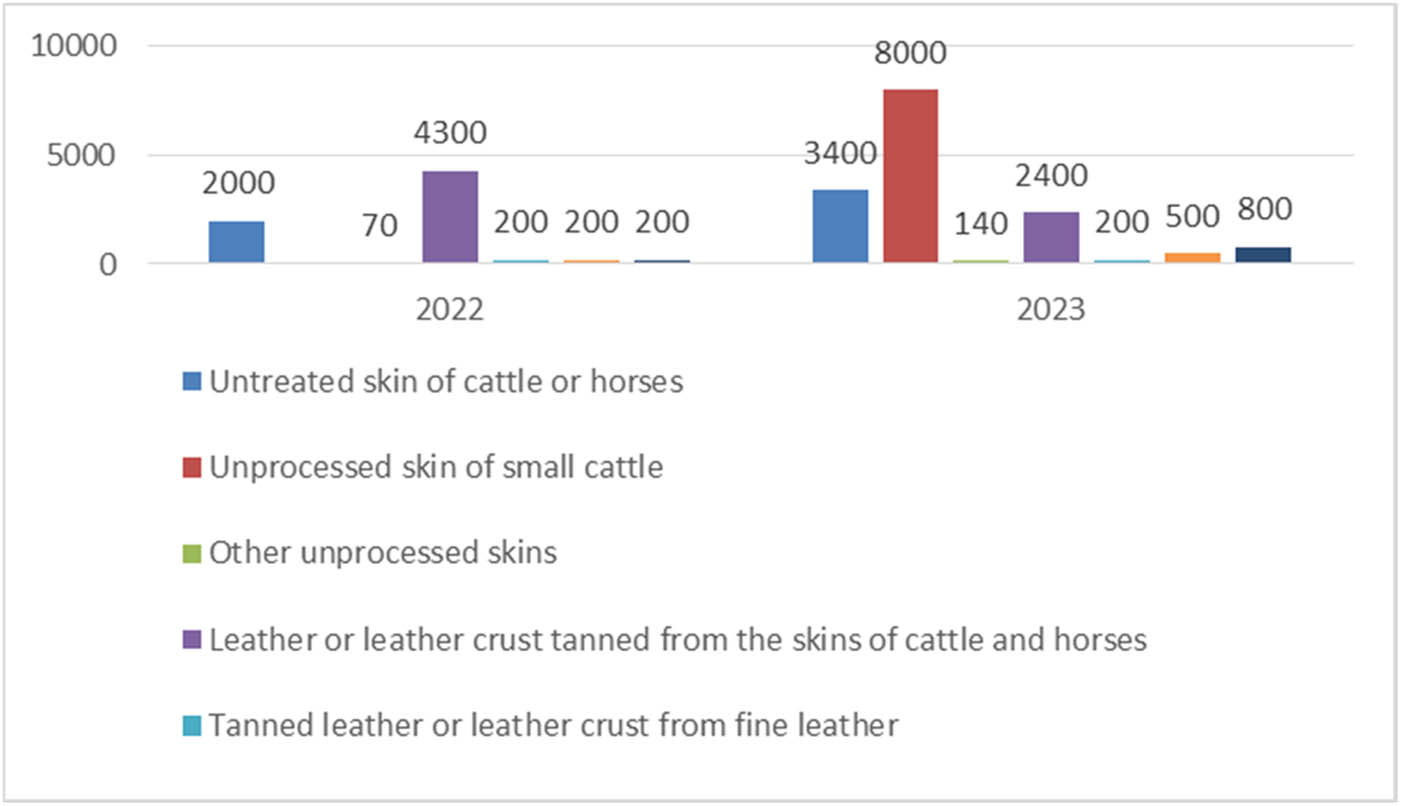
Figure 11
Export indicators of animal skins export from Kazakhstan, in tons.
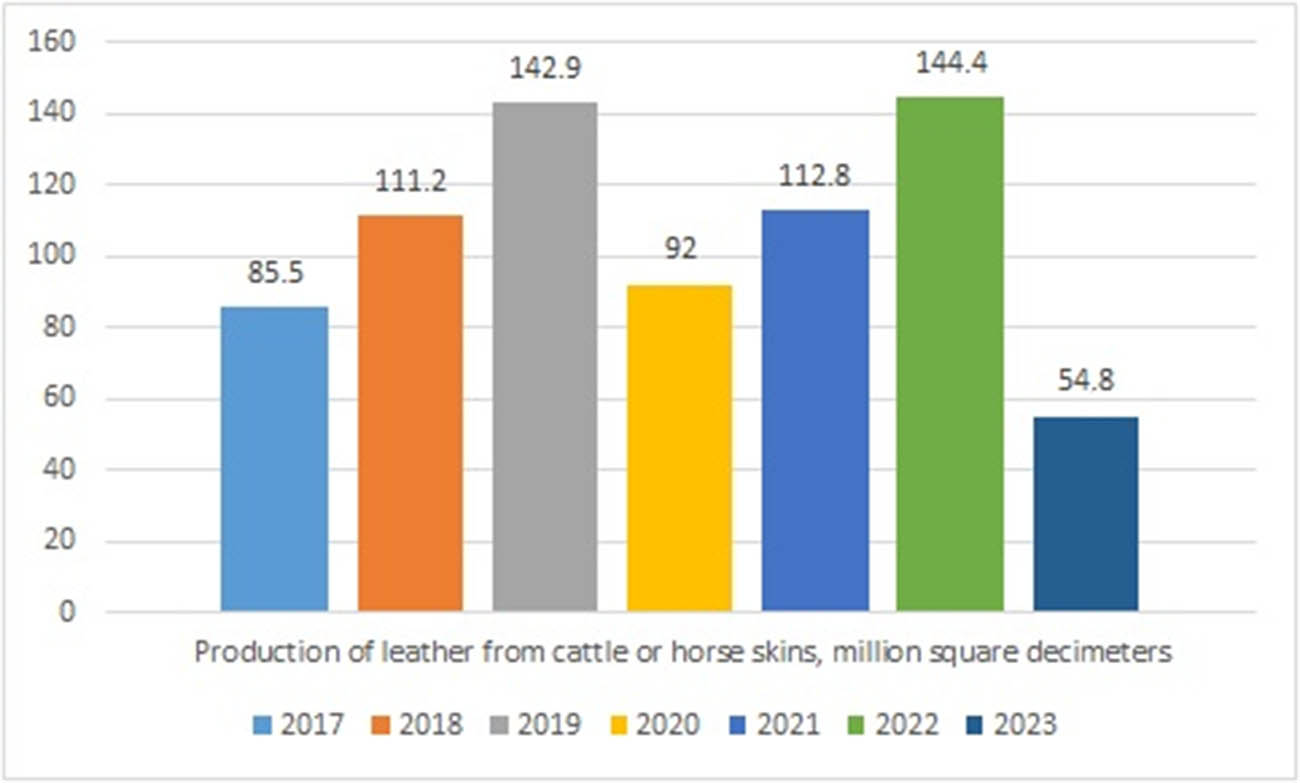
Figure 12
Production of leather from cattle or horse hides, m2 decimeters.
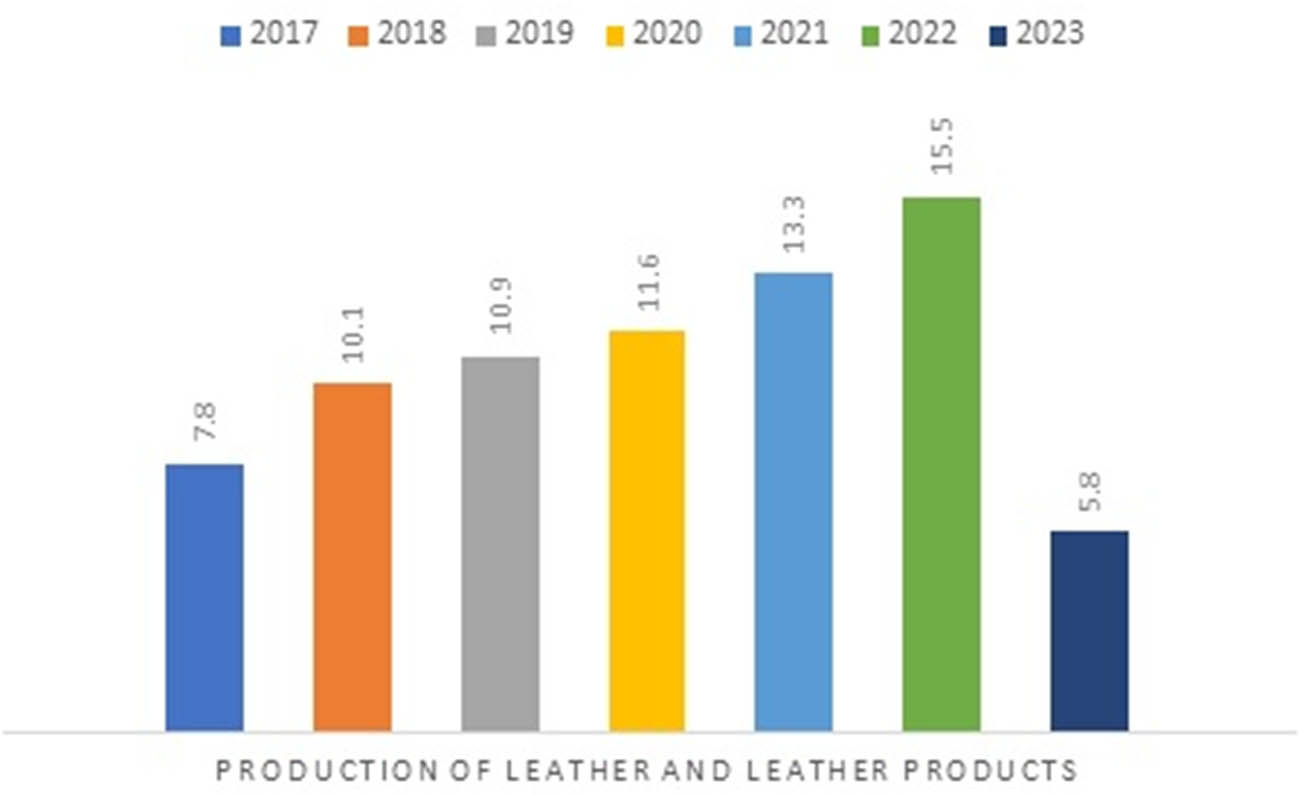
Figure 13
Production of leather and leather products, billion tenge.