
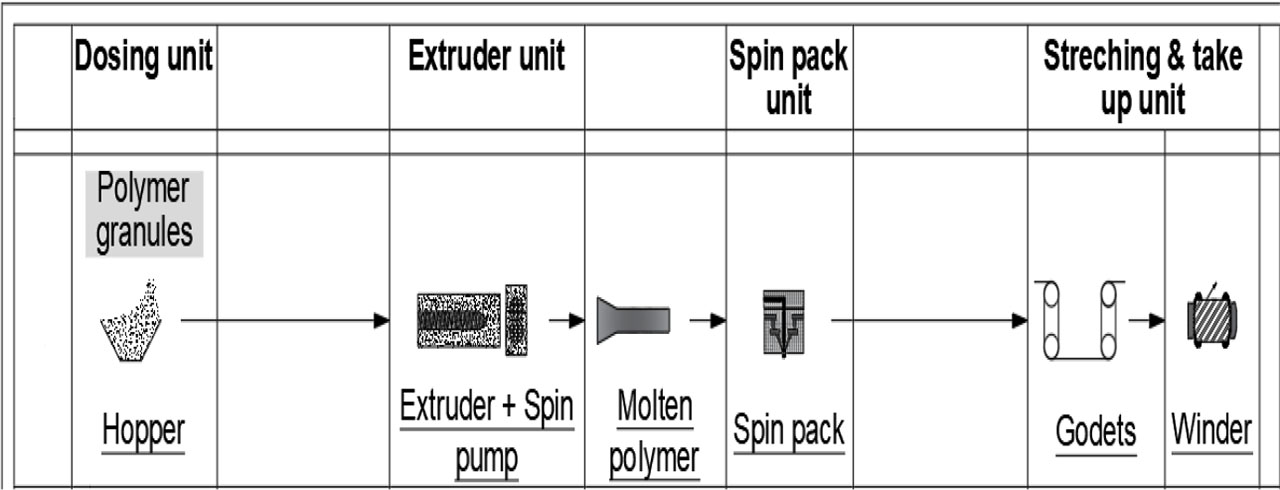
Fig. 1.
Continuous melt spinning process
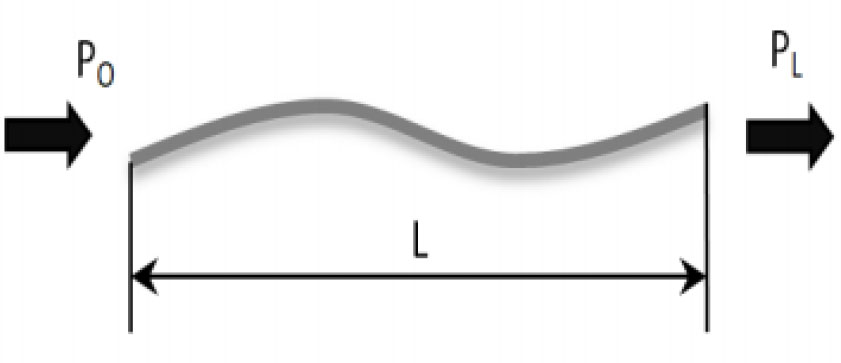
Fig. 2.
Visualisation of the input and output power of a POF
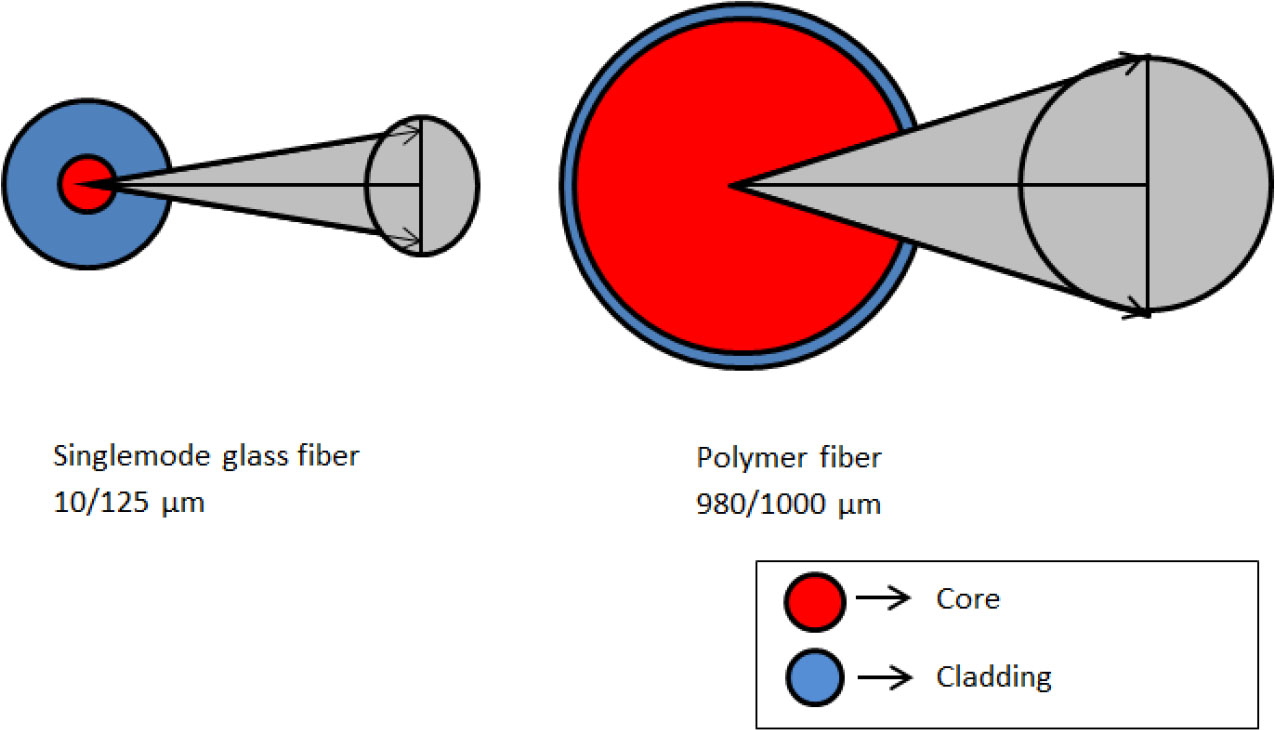
Fig. 3.
Aperture angle and cross section of glass optical fibres and polymer optical fibres, the first number refers the core diameter, whereas the second number refers the fiber diameter (core and cladding)
Table 1:
Historical development of the most significant SI-POF landmarks during the past 45 years [13, 14, 15, 16]
| Year | Organization | Milestone |
|---|---|---|
| 1968 | Dupont | First SI POF with PMMA core |
| 1972 | Toray | First SI POF with PS core |
| 1976 | Mitsubishi Rayon | Production of Eska™, a PMMA SI-POF: >300 dB/km @650 nm |
| 1981 | NTT | Low attenuation PMMA SI POF 55 dB/km at 568 nm |
| 1982 | NTT | First SI POF with deuterated PMMA core 20 dB/km at 650 nm |
| 1983 | Mitsubishi Rayon | Production of step-index PMMA-POF: 65 dB/km @570 nm |
| 1991 | Hoechst Celanese | SI PMMA “Infolite” POF 130 dB/km at 650 nm. |
| 1993 | Essex University | Transmission at 631 Mbps over 100 m by means of a PMMA-core SI POF and an equalizer circuit |
| 1994 | Asahi Chemical | First multicore SI POF for high speed transmission |
| 1995 | Mitsubishi Rayon, NEC | Transmission at 156 Mbps over 100 m by means of a low NA SI POF and a fast red LED |
| 1997 | POF Consortium of Japan | Standardization at ATM LAN 156 Mbps over 50 m of SI POF in the ATM Forum. |
| 1997 | POF Consortium of Japan | Standardization of the norm IEEE 1394 156 Mb/s over 50 m of SI POF. |
| 1998 | MOST standard for automobiles started | |
| 2006–2007 | 10 Mbps over 400 meters of 1 mm SI POF (4-PAM, 8-PAM | |
| 2006–2007 | 100 Mbps over 200 meters of 1 mm SI POF (4-PAM, 8-PAM) | |
| 2011 | POF-PLUS | 1 Gbps over 50 meters of SI PMMA |
| 2011 | Opto Marine Co., Ltd./Korea | 1 mm SI POF with data rates of 500 Mbps, 5 Gbps and 10 Gbps at 100 meters at 650 nm. |
| 2013 | KDPOF/Spain | 1 Gbps of SI POF for the automotive industry |
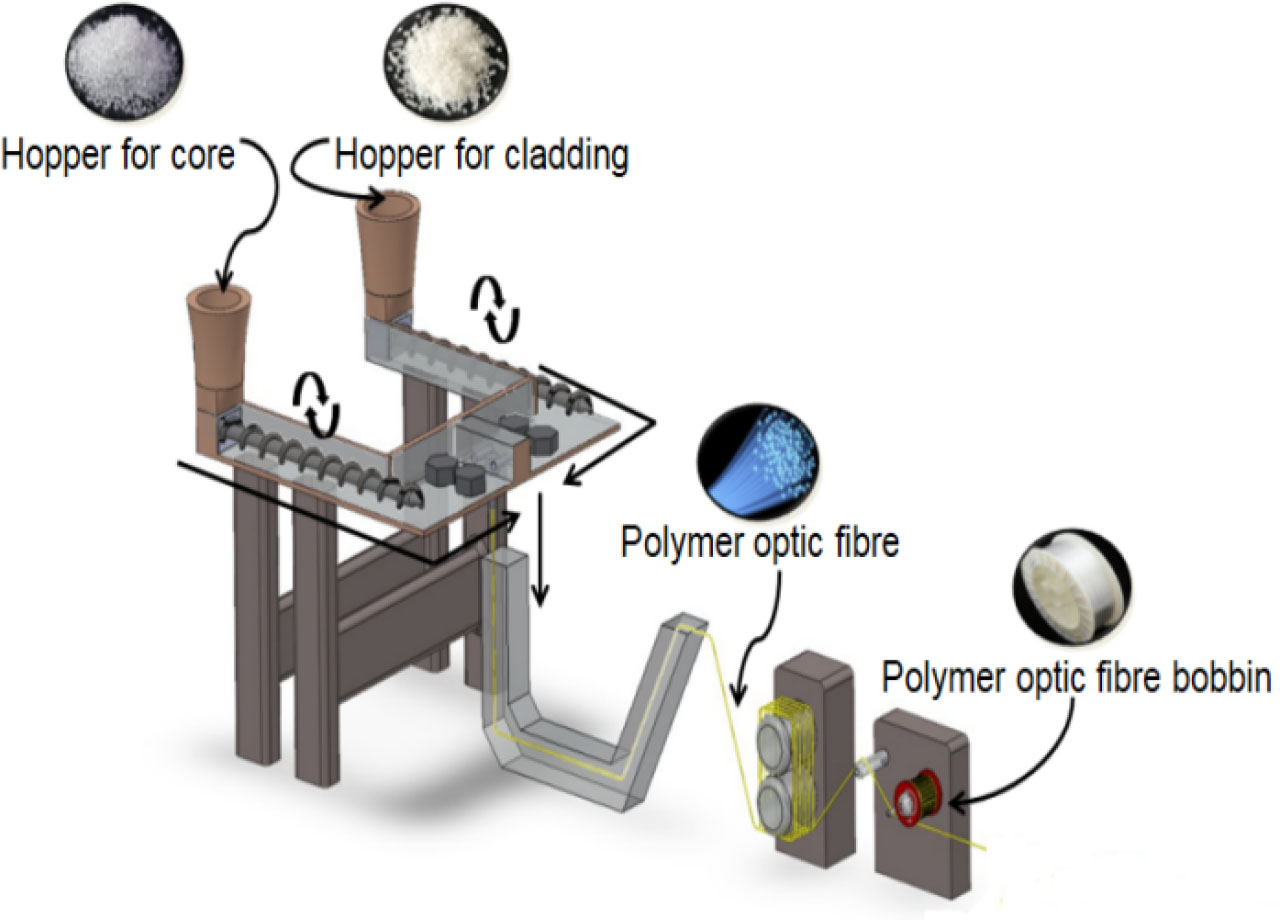
Fig. 4.
Bicomponent fibre manufacturing in the melt spinning line
Table 2.
| Material | PMMA | PVDF | PMP | PLA | PP |
|---|---|---|---|---|---|
| Grade | Plexiglas 7N | Solvay Solef 1008 | MX 002 | Ingeo 6202D | Sabic 513A |
| Density | 1.19 g/cm3 | 1.68 g/cm3 | 0.834 g/cm3 | 1.24 g/cm3 | 0.905 g/cm3 |
| Glass transition temperature (Tg) | 110 °C | −67 °C | 23–50 °C | 55–60 °C | −25°C |
| Melting temperature (Tm) | 220–260 °C | 158–200 °C | 224 °C | 220–240 °C | 120–176 °C |
| Refractive index (RI) | 1.49 | 1.42–1.49 | 1.46 | 1.456 | 1.49 |
| Luminous transmittance | 92 % | 85–94 % | 93 % | 90% | n.a. |
| Crystallinity | A | SC (50 % A) | SC (55–85 %) | SC (65 %) | SC (3.2–67 %) |
Table 3.
Spinning process parameter of 1 mm fibres [1]
| Bobbin | PMMA-PVDF (1mm)-C | PMMA-PVDF (1mm)-D | PMMA-PMP (1mm) | PMMA-PLA (1mm) | PMMA-PP (1mm) | |
|---|---|---|---|---|---|---|
| Polymer Material | Core Polymer | PMMA | ||||
| Core Grade | Plexiglas 7N | |||||
| Cladding Polymer | PVDF | PVDF | PMP | PLA | PP | |
| Cladding Grade | Solvay Solef 1008 | Solvay Solef 1008 | PMP MX002 | Purapol L130 | Sabic 513A | |
| Ambient temperature (°C) | 20 | |||||
| Temperature Profile (Core) | Heating zone 1 (°C) | 205 | ||||
| Heating zone 2 (Ext) (°C) | 215 | 215 | 225 | 225 | 225 | |
| Heating zone 3 (°C) | 230 | 230 | 235 | 235 | 235 | |
| Heating zone 4 (Probe head) (°C) | 240 | 240 | 245 | 245 | 245 | |
| Heating zone 5 (Melt pipe) (°C) | 250 | 250 | 255 | 255 | 255 | |
| Heating zone 6 (Pump Unit) (°C) | 250 | |||||
| Extruder | Pressure (Core Ext) (bar) | 35 | ||||
| Pressure (Cladding Ext) (bar) | 30 | |||||
| Process parameter | Nozzle diameter (mm) | 3.5 | ||||
| Core spin pump (cm3/U) | 1.2 | |||||
| Core spin pump speed (rpm) | 14.7 | 7.1 | 14.7 | 14.7 | 14.7 | |
| Cladding spin pump (cm3/U) | 0.3 | |||||
| Cladding spin pump speed (rpm) | 5 | |||||
| Take off unit (m/min) | 23.2 | |||||
| Winder (m/min) | 23.5 | |||||
| Heating section temperature (°C) | 135 | |||||
| Water bath temperature (°C) | 60–54 | 60–54 | 20 | 20 | 20 | |
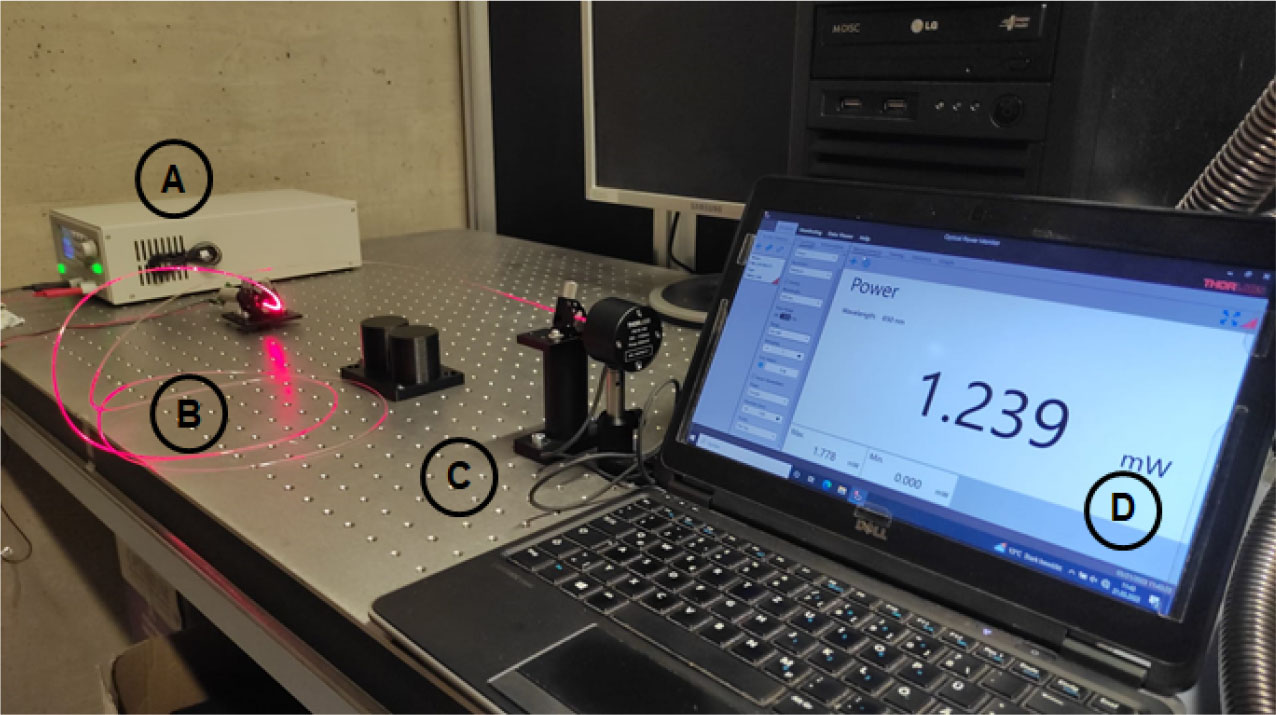
Fig. 5.
Attenuation test measurement device settlement. (a) LED light source, (b) POF, (c) integrating sphere with light detector, and (d) measure power
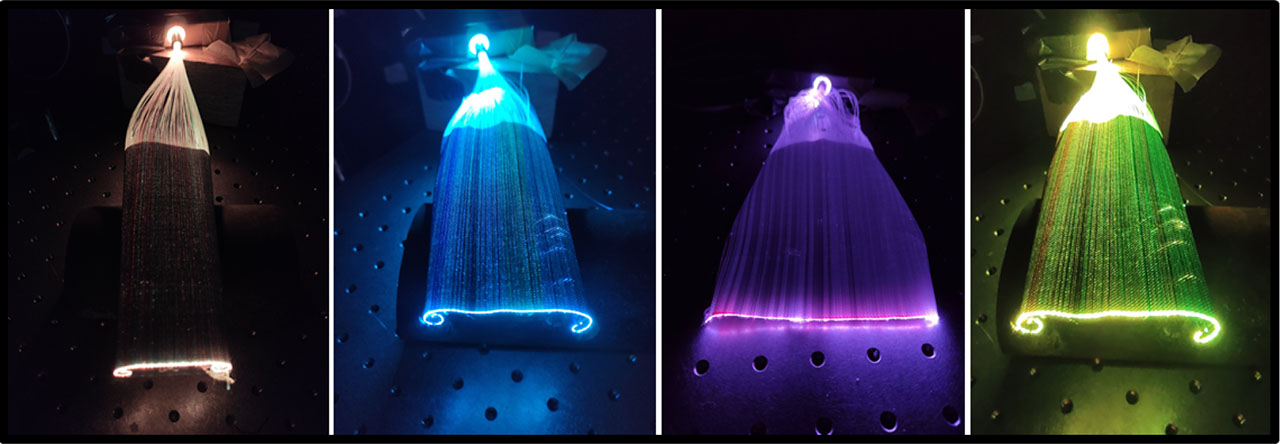
Fig. 6.
Light emission views of POFs on fabric with different coloured light sources (the light source colors are left to right: white, blue, purple, yellow)
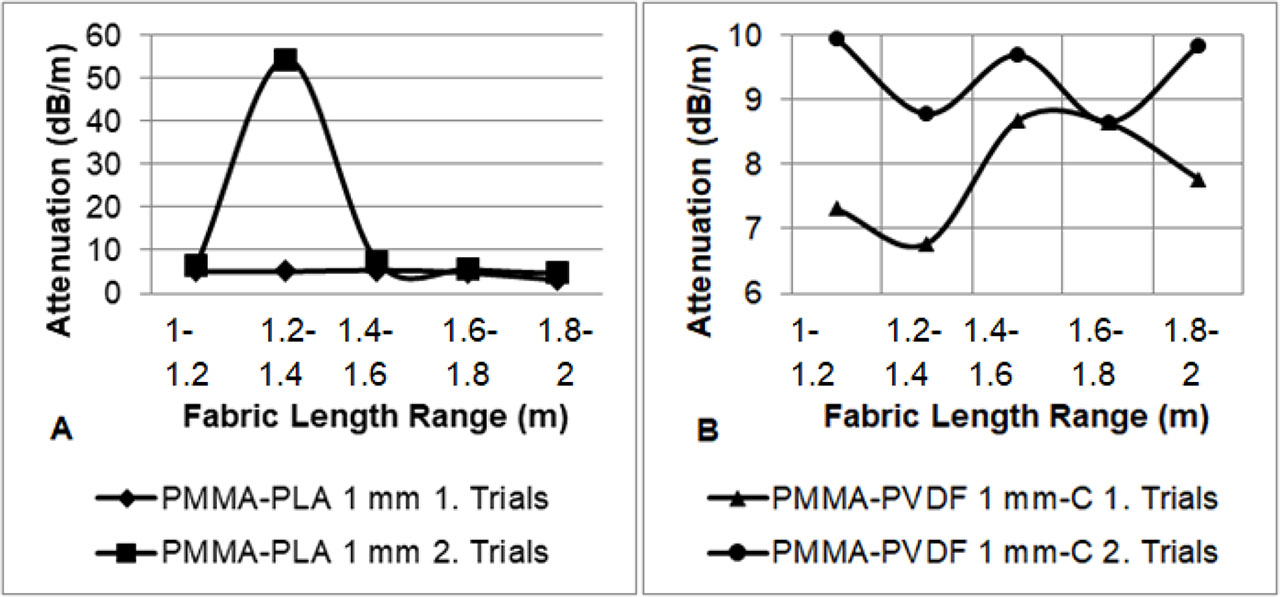
Fig. 7.
Comparison of the two different attenuation measurements of two specimens on the same bobbin with respect to their each measurement length
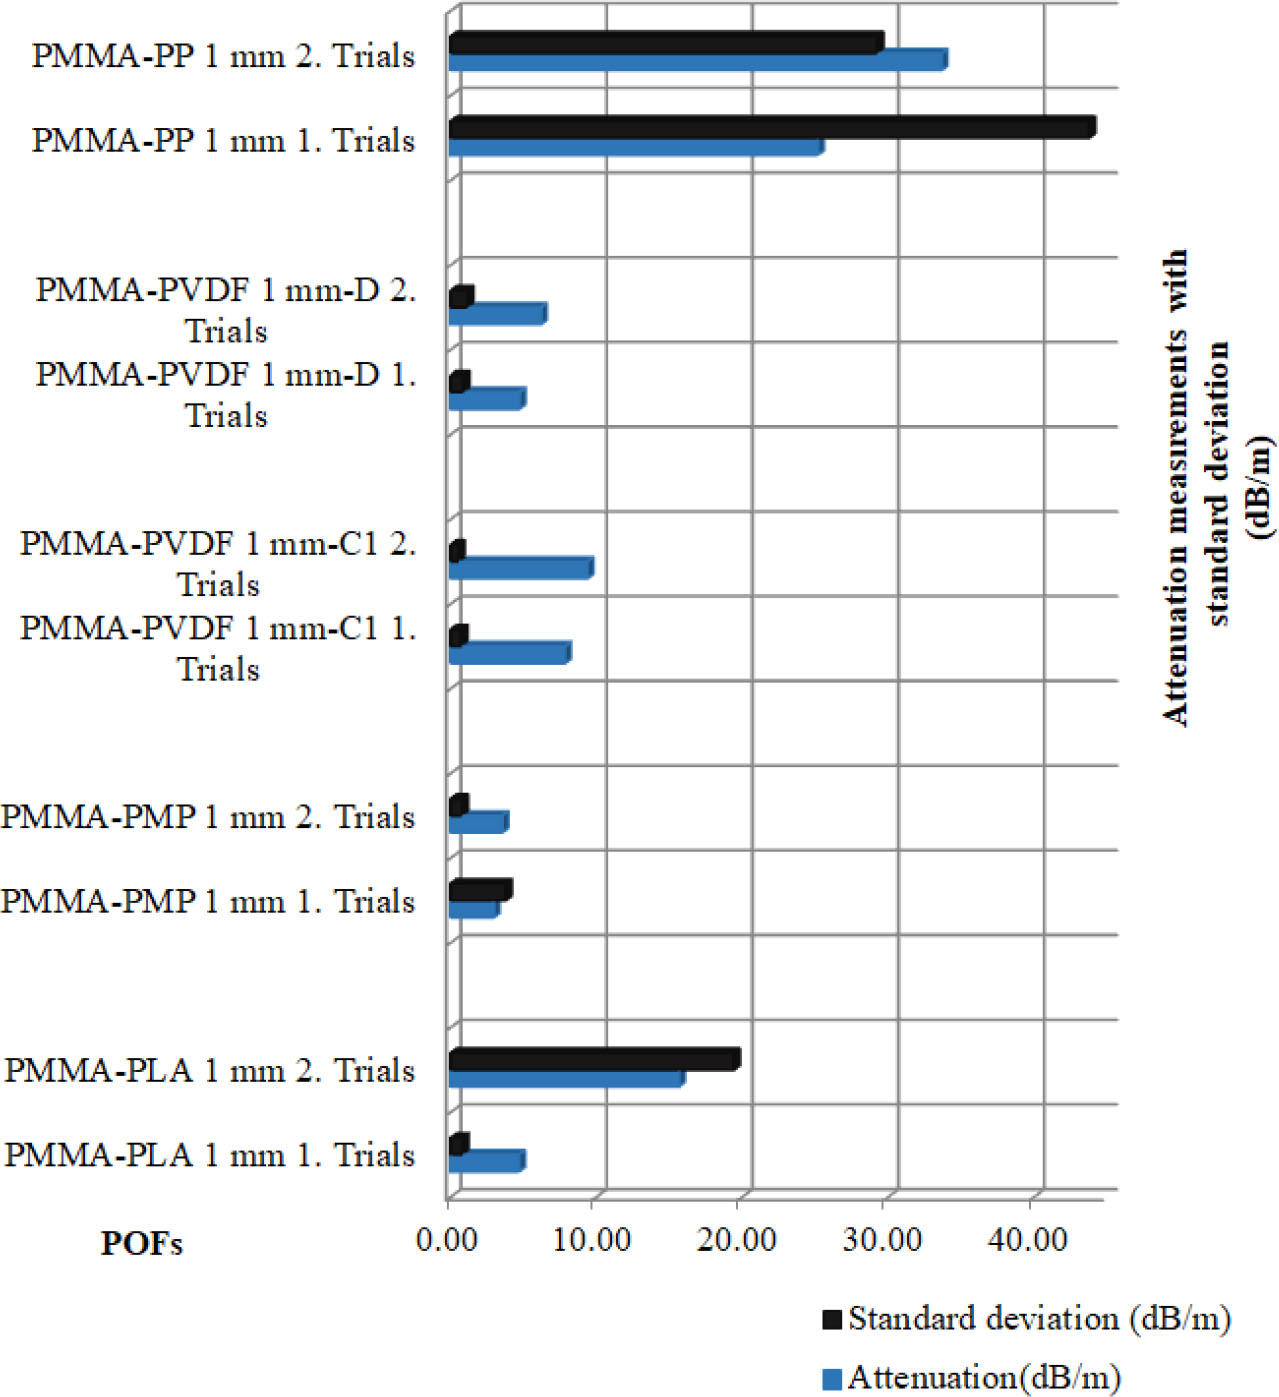
Fig. 8.
Overall mean attenuation measurement of fibres for two specimens on the same bobbin for 1 mm