
Table 1.
Properties and parameters of samples
| Type | Manufacturer | Material | Area density, g/m2 | Thickness, mm | Width of package,mm | Web forming method | Bonding method |
|---|---|---|---|---|---|---|---|
| PP30 | Jialianda Nonwovens Co., Ltd | Polypropylene | 30 | 1.63 | 143 | Spun-laid | Hot pressing |
| PLA30 | Smartwin International Group Co., Ltd | Polylactice acid | 30 | 1.11 | 1800 | Carding web | Carding |
| PET30 | Smartwin International Group Co., Ltd | Polyethylene terephthalate | 30 | 0.95 | 1800 | Spun-laid | Hot pressing |
| PA20 | Smartwin International Group Co., Ltd | Polyamide | 20 | 0.80 | 1800 | Spun-laid | Hot pressing |
| PA30 | Smartwin International Group Co., Ltd | Polyamide | 30 | 1.08 | 1800 | Spun-laid | Hot pressing |
| PA40 | Smartwin International Group Co., Ltd | Polyamide | 40 | 1.28 | 1800 | Spun-laid | Hot pressing |
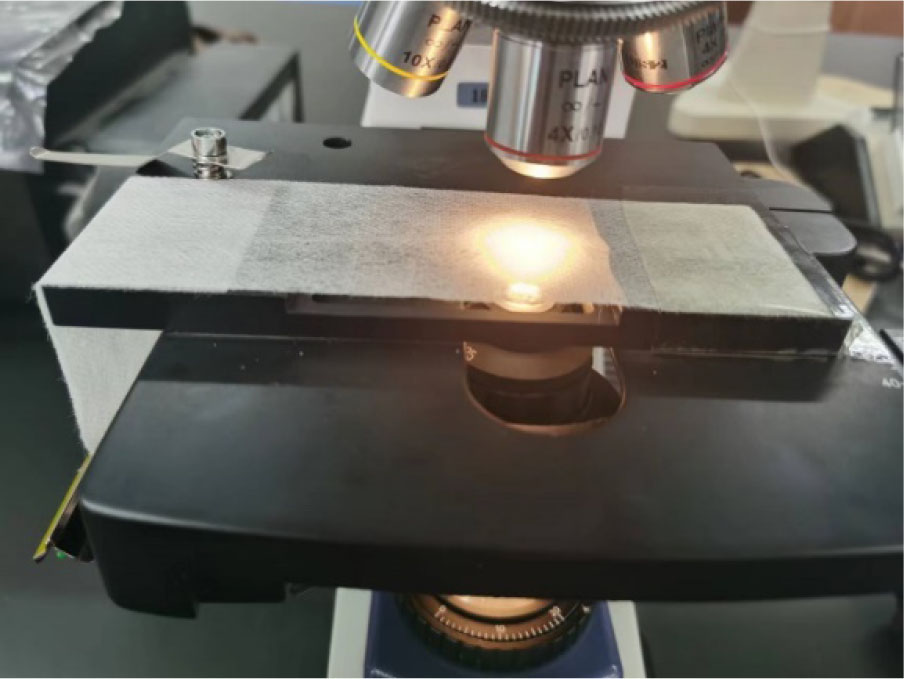
Fig. 1
Measurement of surface morphology of nonwovens
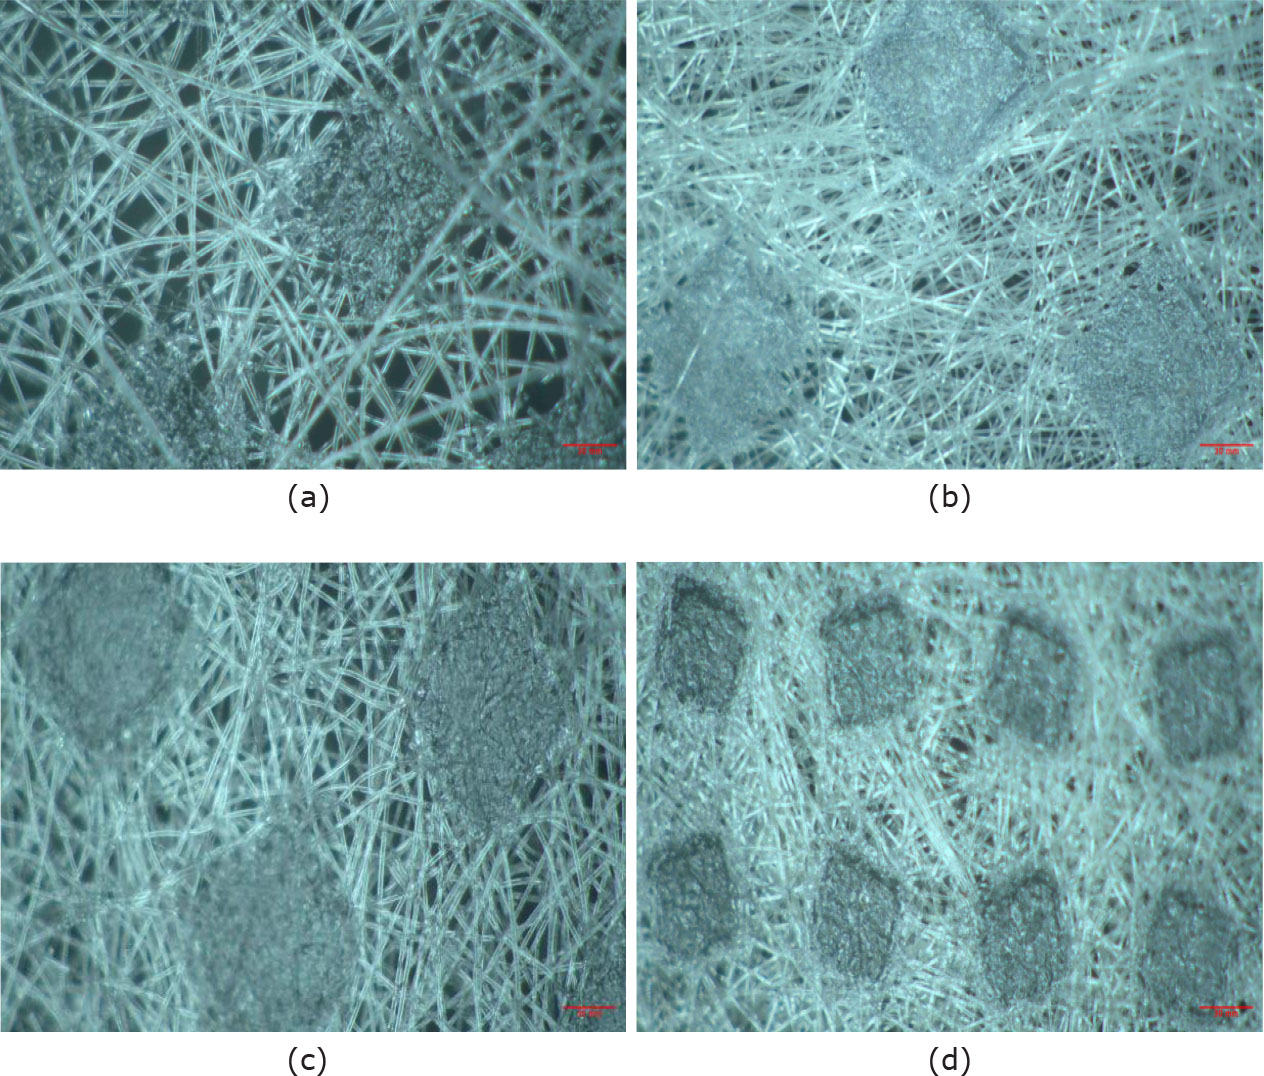
Fig. 2
Photos of surface morphology of nonwovens, (a) PP30, (b) PLA30, (c) PET30, (d) PA30
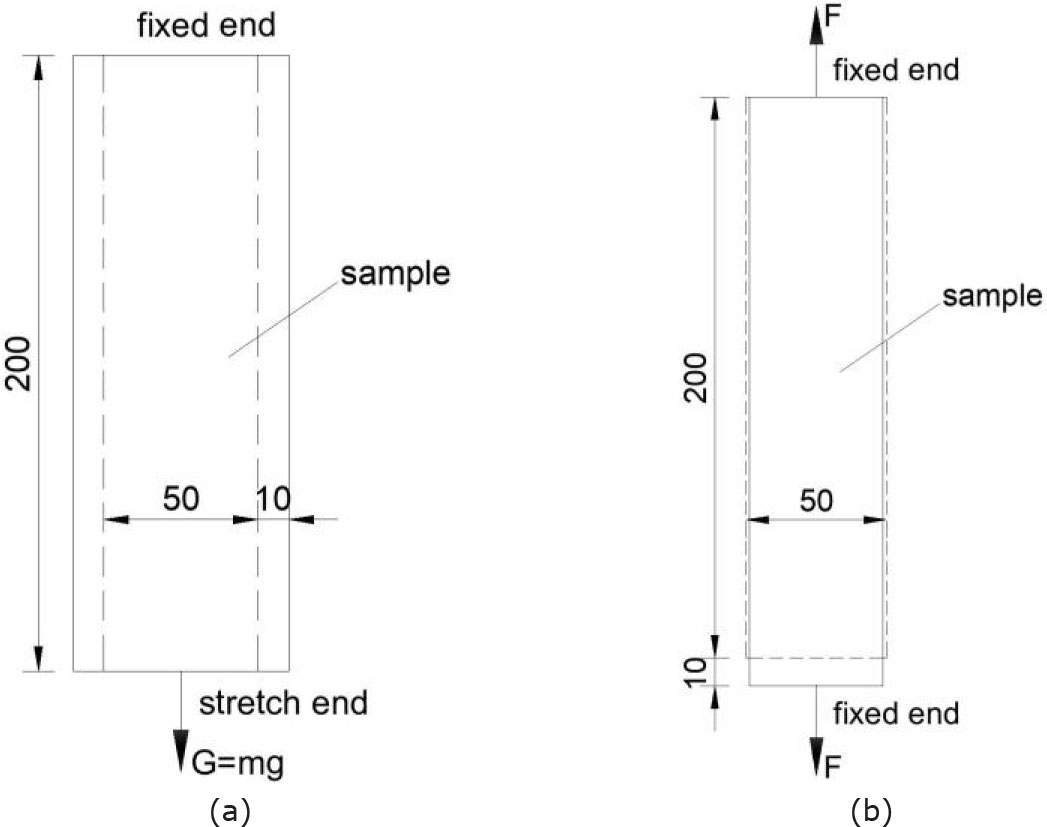
Fig. 3
Schematic diagram of creep and relax tests: (a) creep test, (b) relax test
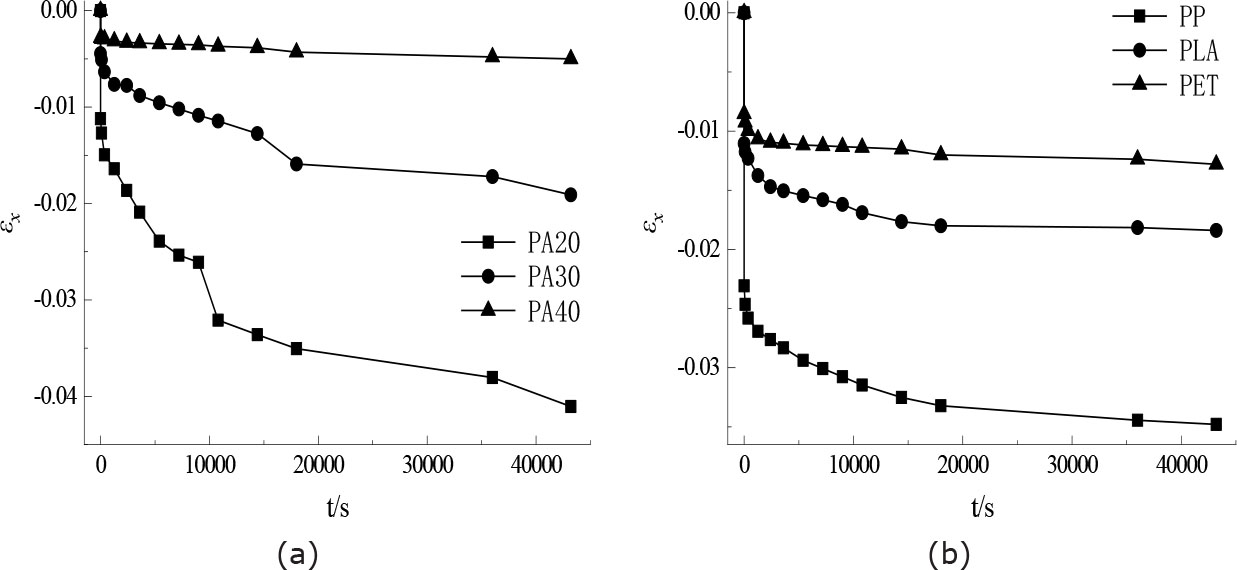
Fig. 4
Strain-time curve of creep test: (a) PA20, PA30 and PA40, (b)PP30, PLA30, and PET30
Table 2.
Prony series with order 6 expression of the equivalent transverse strain
| Type | Regression equation |
|---|---|
| PP30 | εx(t)=4.42628+1.09253e−t/32028.50978+0.73885e−t/282.31417+ 0.58798e−t/3771.29624+1.60838e−t/57.29553+ 0.52102e−t/1346.1015+7.18362e−t/7.14774 |
| PLA30 | εx(t)=−0.01837+0.00203e−t/690.82678+0.00354e−t/1.71985+ 0.00254e−t/3345.76762+0.00813e−t/1.76406+ 0.00076e−t/17688.93783+0.00137e−t/159.68997 |
| PET30 | εx(t)=−0.01317+0.00902e−t/1.90676+0.00209e−t/29409.01145+ 0.00004e−t/2.15781+0.00001e−t//23847.32555+ 0.00069e−t/29.86732+0.00133e−t/255.54712 |
| PA20 | εx(t)=−0.04475+0.00433e−t/43199.94444+9.88×10−18e−t/1118.18378+ 0.01821e−t/1654.64907+0.00861e−t/43199.93206+ 0.00334e−t/7.33281+0.01027e−t/1.95681 |
| PA30 | εx(t)=−0.01967+0.00378e−t/802.57842+2.29×10−13 e−t/15657.97923+ 0.0024e−t/10.92507+0.00566e−t/23940.20253+ 0.00422e−t/13740.79532+0.0036e−t/1.19744 |
| PA40 | εx(t)=−0.00554+0.00184e−t/35871.37391+4.91×10−12e−t/23381.26005+ 0.00289e−t/1.47535+0.00029e−t/12560.94798+ 1.15×10⁻²¹e−t/29276.85456+0.00052e−t/527.90410 |
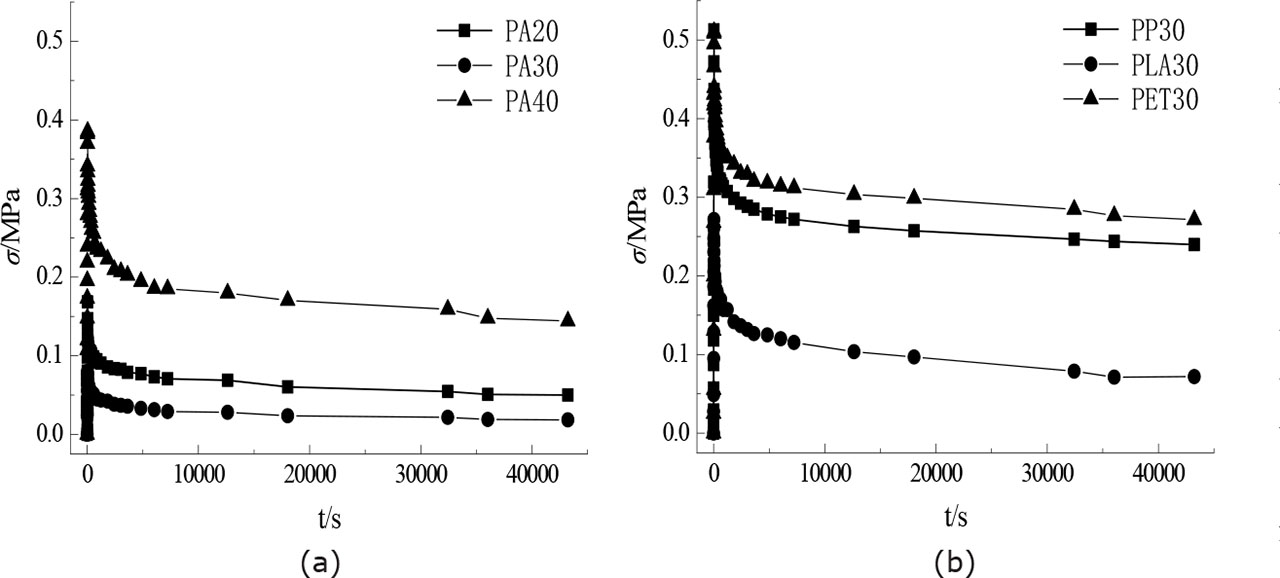
Fig. 3
Stress-time curve of relax test,(a) PA20, PA30 and PA40, (b)PP30, PLA30 and PET30
Table 3.
Prony series with order 6 expression of the relax modulus
| Type | Regression equation |
|---|---|
| PP30 | E(t)=4.42628+1.09253e−t/32028.50978+0.73885e−t/282.31417+ 0.58798e−t/3771.29624+1.60838e−t/57.29553+ 0.52102e−t/1346.1015+7.18362e−t/7.14774 |
| PLA30 | E(t)=0.72456+4.52×10⁻¹⁴e−t/20545.52934+1.24187e−t/2137.01999+ 1.43×10⁻¹³e−t/36360.07692+7.56×10−14e−t/9155.68766+ 1.77333e−t/43199.70987+9.20×10−13e−t/16839.05726 |
| PET30 | E(t)=5.38462+1.64×10⁻¹⁶e−t/453.42766+1.20874e−t/6652.87856+ 1.22×10⁻¹³e−t/23242.29474+1.70×10−8e−t/32347.22098+ 4.75E−7e−t/1705.50865+0.57320e−t/14404.62676 |
| PA20 | E(t)=0.90989+0.89126e−t/12247.20516+7.23×10−7e−t/33414.44565+ 1.52×10⁻⁶e−t/8424.74793+2.56×10−13e−t/93.12918+ 2.93×10⁻⁸e−t/18919.63773+0.01144e−t/15146.15837 |
| PA30 | E(t)=0.31736+0.18224e−t/20190.21103+0.48432e−t/2192.37282+ 1.30×10⁻¹⁷e−t/34546.26469+6.98×10−5e−t/24365.33458+ 0.00039e−t/25031.94717+0.12488e−t/17679.49483 |
| PA40 | E(t)=2.49469+0.00083e−t/9403.58163+1.69301e−t/2187.80999+ 2.15×10⁻⁹e−t/22263.27476+0.01963e−t/2349.39762+ 1.20932e−t/34067.64849+0.00011e−t/7157.69109 |
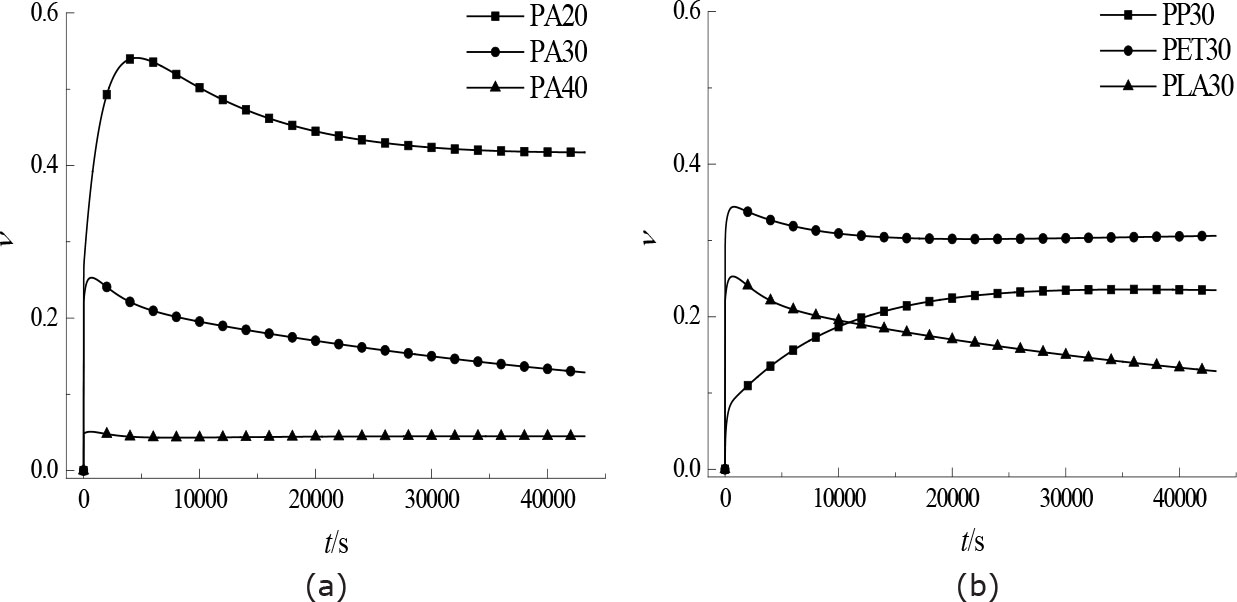
Fig. 4
Poisson's ratio-time curve: (a) PA20, PA30 and PA40, (b)PP30, PLA30 and PET30