
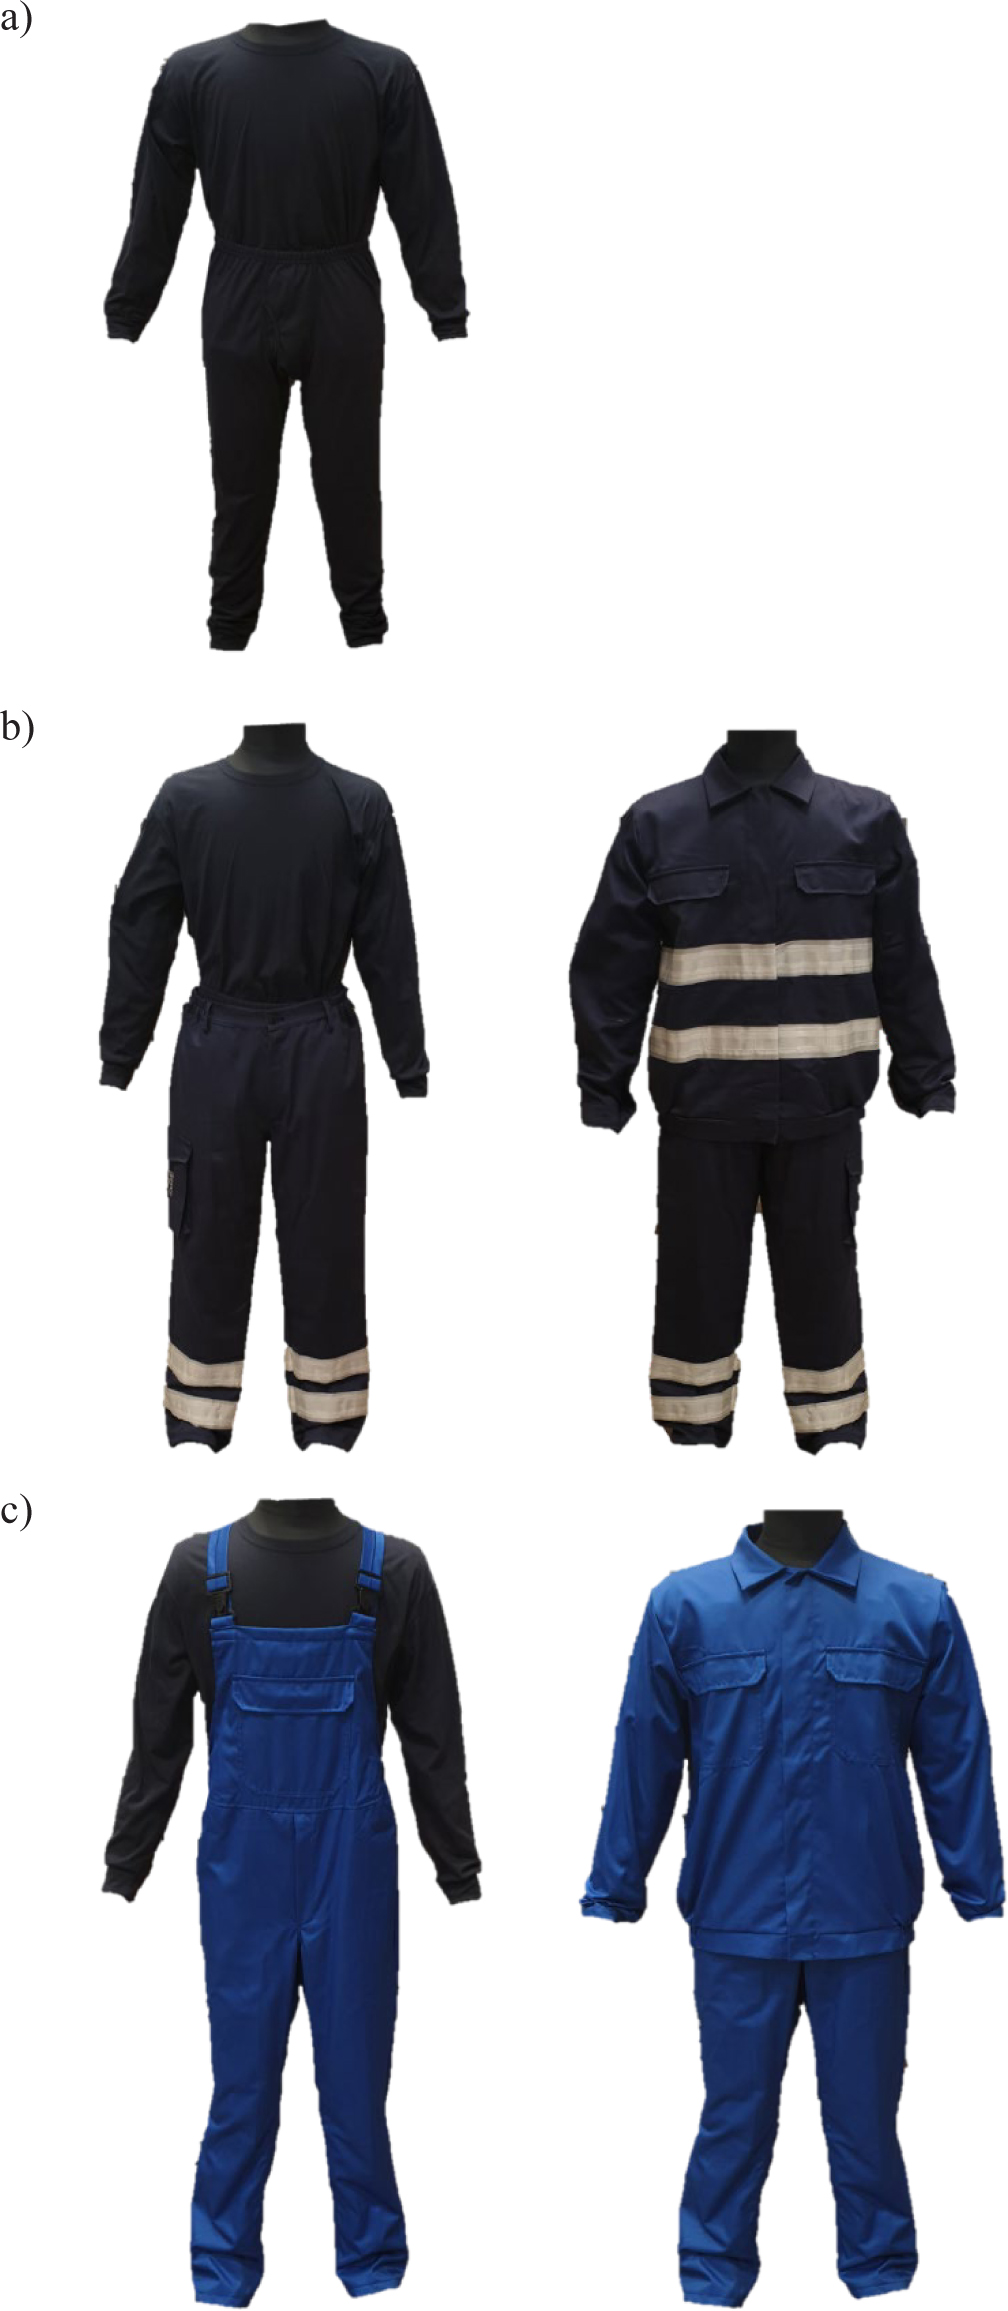
Fig. 1.
The clothing used for the tests: a) underwear (U), b) set 1 (S1) (energy sector), c) set 2 (S2) (chemical industry)
Table 1.
A detailed description of the tested clothing
| Name | Material composition | Normative requirements | Industrial application | |
|---|---|---|---|---|
| Outerwear clothing | ||||
| Set S1 | jacket and waist-length pants | 79% cotton, 20% polyester, 1% antistatic fiber; Hydro-Tec finish; 260 g/m2 | EN ISO 13688:2013 [21], EN ISO 11611:2015 [22], EN 11612:2015 [23], EN 1149-5:2018 [24], EN 13034:2005 [25], EN ISO 14116:2015 [26], IEC 61482-2:2018 [27] | power industry, chemical industry, welding and hot factors, explosion hazard zone, high visibility |
| Set S2 | acid-proof jacket and acid-proof dungarees | 80% polyester, 20% cotton; 225 g/m2 | EN ISO 13688:2013 [21], EN 13034:2005 [25] | chemical industry |
| Underwear | ||||
| U | long-sleeved t-shirt and underpants | 59% Protex, 39% Cotton, 2% negastat; 205 g/m2 | EN ISO 13688:2013 [21], EN ISO 11612:2015 [22], EN 1149-5:2018 [24] | gas industry, fuel industry, explosion hazard zone |
Table 2.
Data obtained from the manufacturer describing the different sizes
| Size | Height [cm] | Circumference | ||
|---|---|---|---|---|
| chest [cm] | waist [cm] | collar [cm] | ||
| 50 | 170-176 | 96-100 | 88-92 | 40-41 |
| 54 | 176-182 | 104-108 | 96-100 | 42-43 |
| 56 | 182-188 | 108-112 | 100-140 | 43-44 |
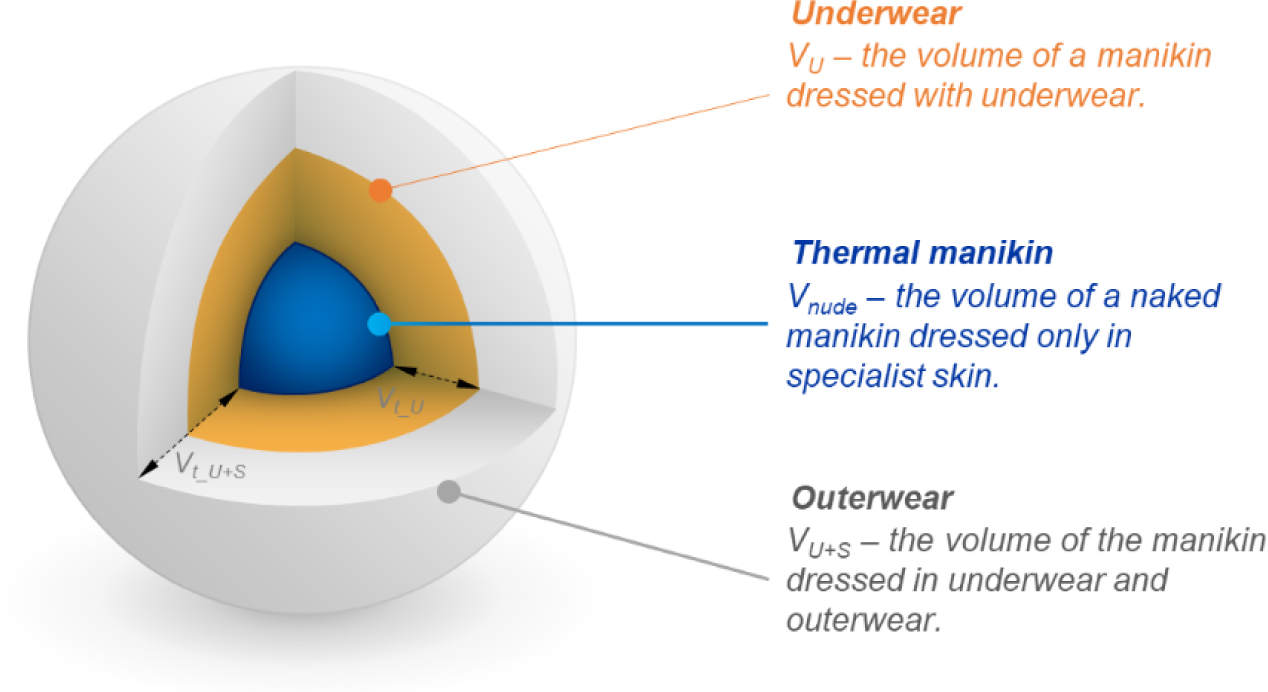
Fig. 2.
Method of calculating the total air volume schematically presented
Table 3.
Air volume, air gap size, total thermal Insulation (mean value ± standard deviation) calculated by parallel method for static and dynamic test conditions
| Variants | Size | Vt [dm3] | dair [mm] | Total thermal insulation It [m2oC/W] | Resultant total thermal insulation Itr [m2oC/W] |
|---|---|---|---|---|---|
| U | 54 | 16 | 10 | 0.164±0.001 | 0.131±0.000 |
| U_S1(50) | 50 | 34 | 21 | 0.204±0.001 | 0.166±0.000 |
| U_S1(54) | 54 | 39 | 29 | 0.210±0.001 | 0.172±0.000 |
| U_S1(56) | 56 | 47 | 30 | 0.217±0.000 | 0.169±0.000 |
| U_S2(50) | 50 | 34 | 21 | 0.202±0.000 | 0.160±0.000 |
| U_S2(54) | 54 | 48 | 24 | 0.205±0.002 | 0.164±0.000 |
| U_S2(56) | 56 | 50 | 29 | 0.209±0.000 | 0.165±0.000 |
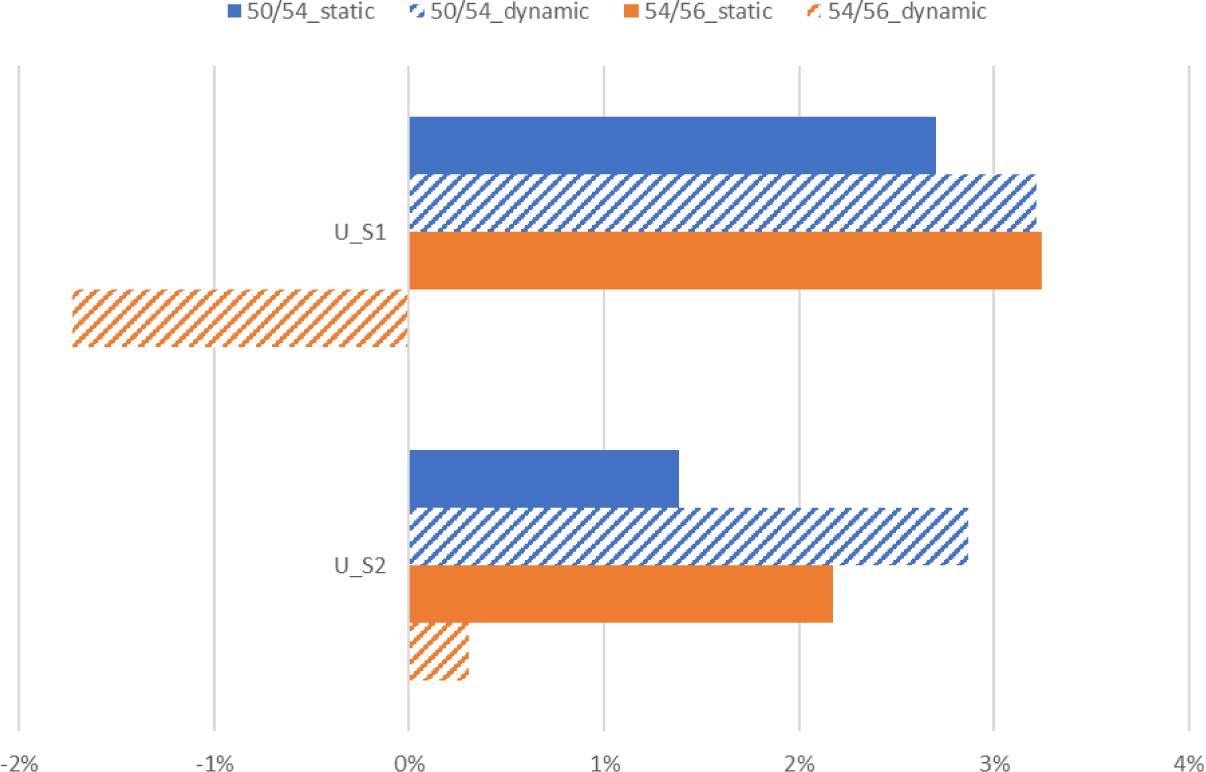
Fig. 3.
Percentage of the difference between the values of thermal insulation (in static and dynamic conditions) for individual sizes of outerwear (parallel method)
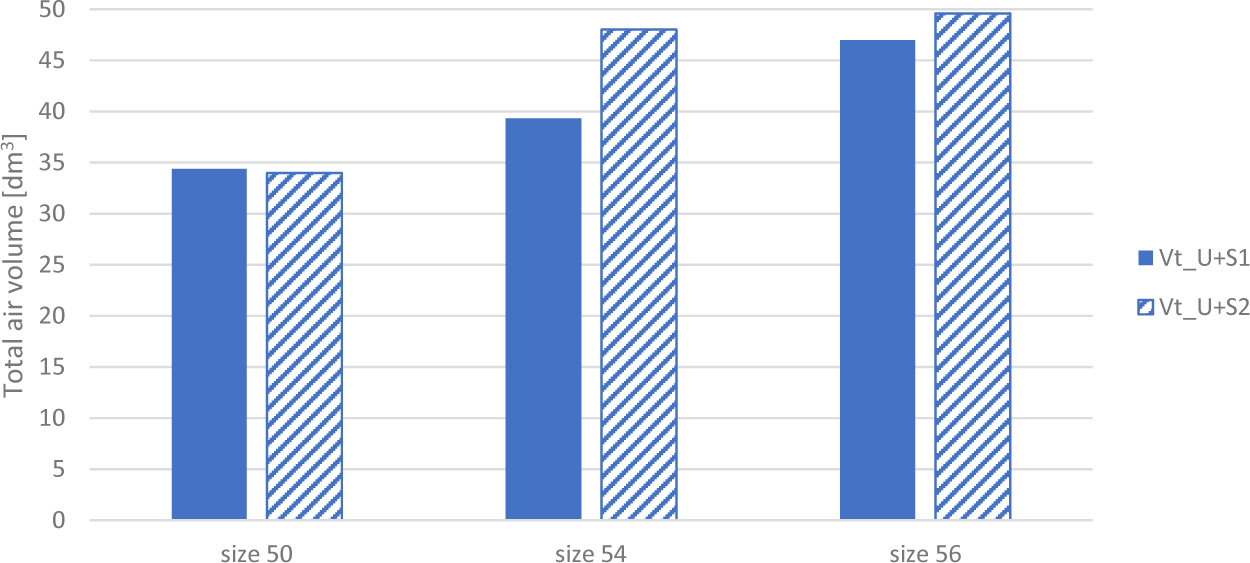
Fig. 4.
Total air volume: from the skin of the manikin to the surface of the outerwear (Vt_U+Si)
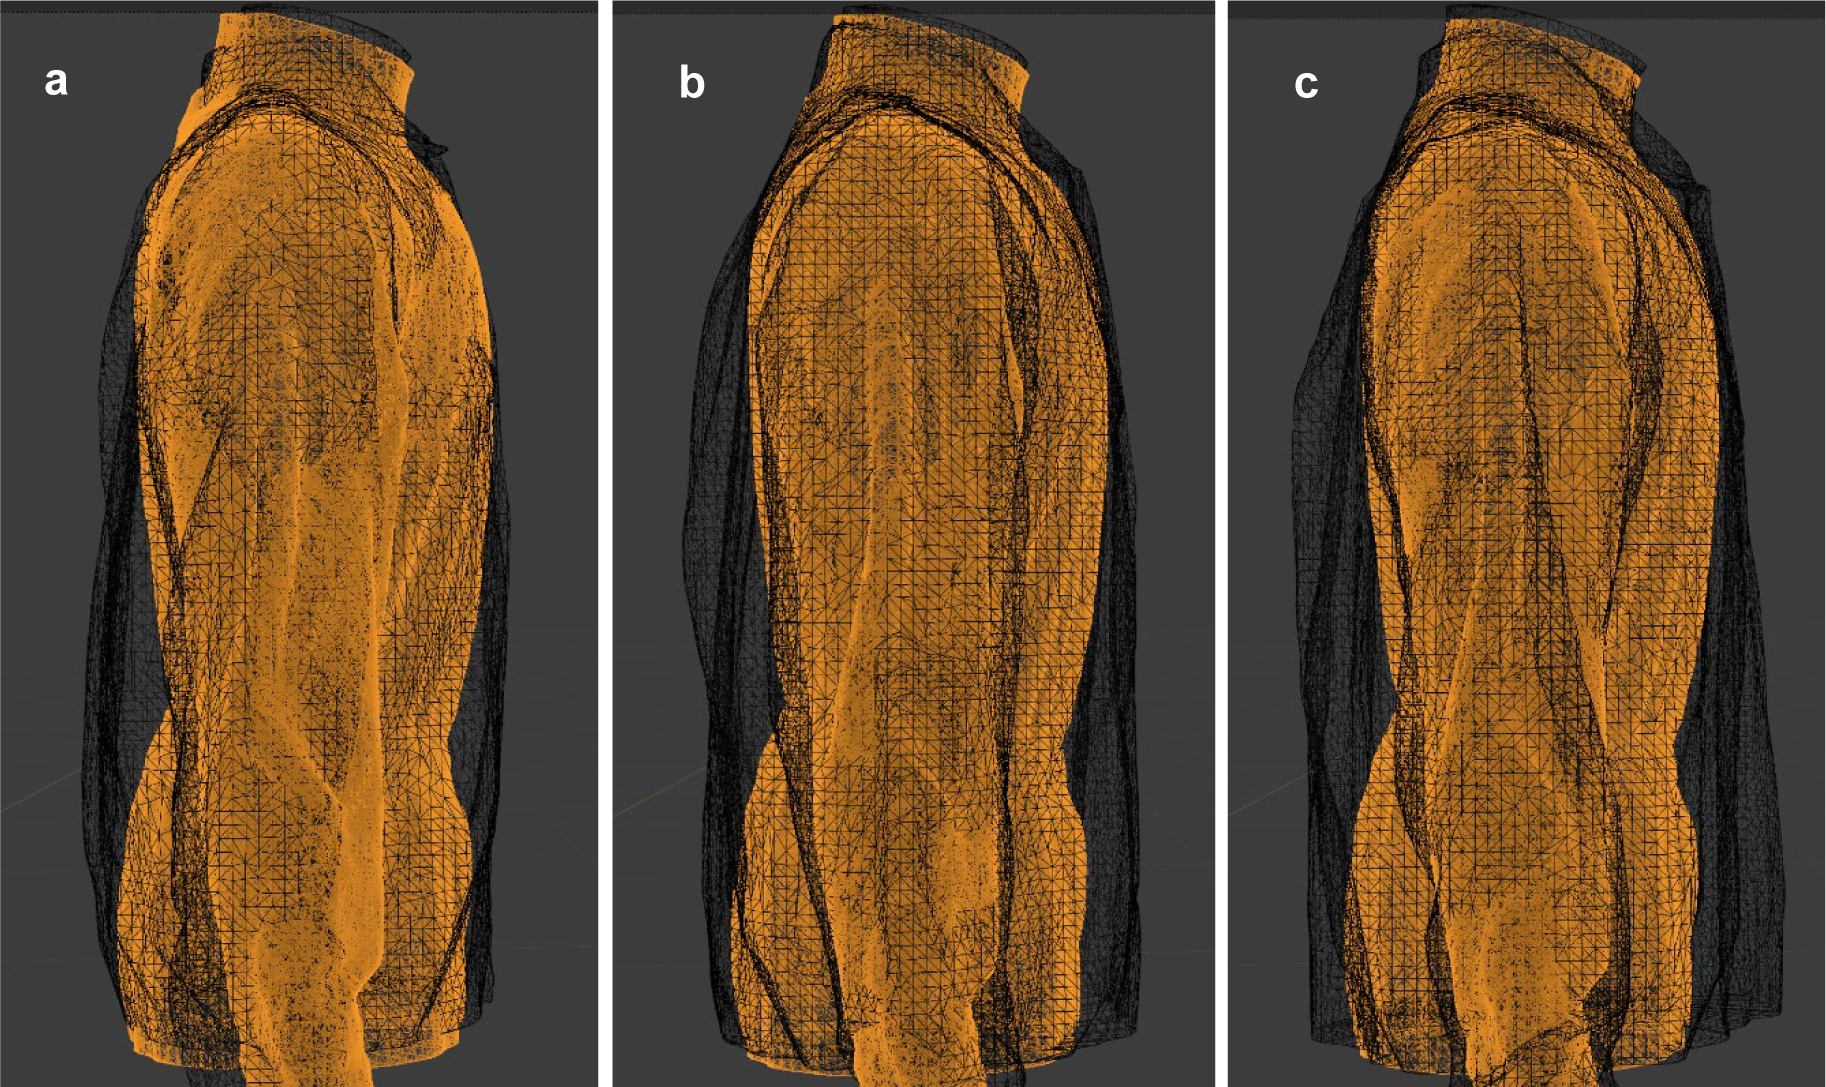
Fig. 5.
3D scan images of manikin dressed with underwear and set S2 in different variants: a) size 50), b) size 54, c) size 56
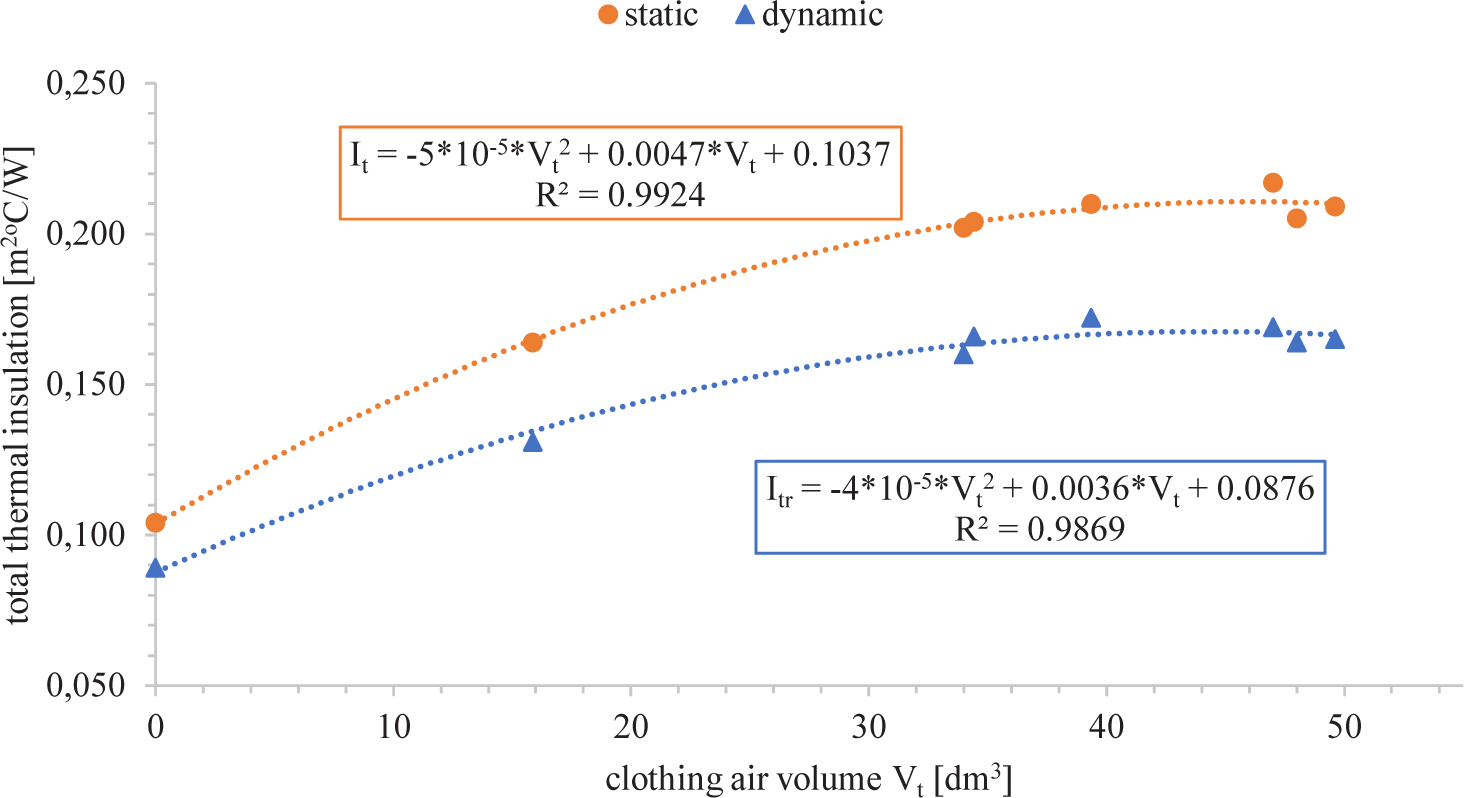
Fig. 6.
Relationship between the clothing’s total thermal insulation (static and dynamic) and air volume
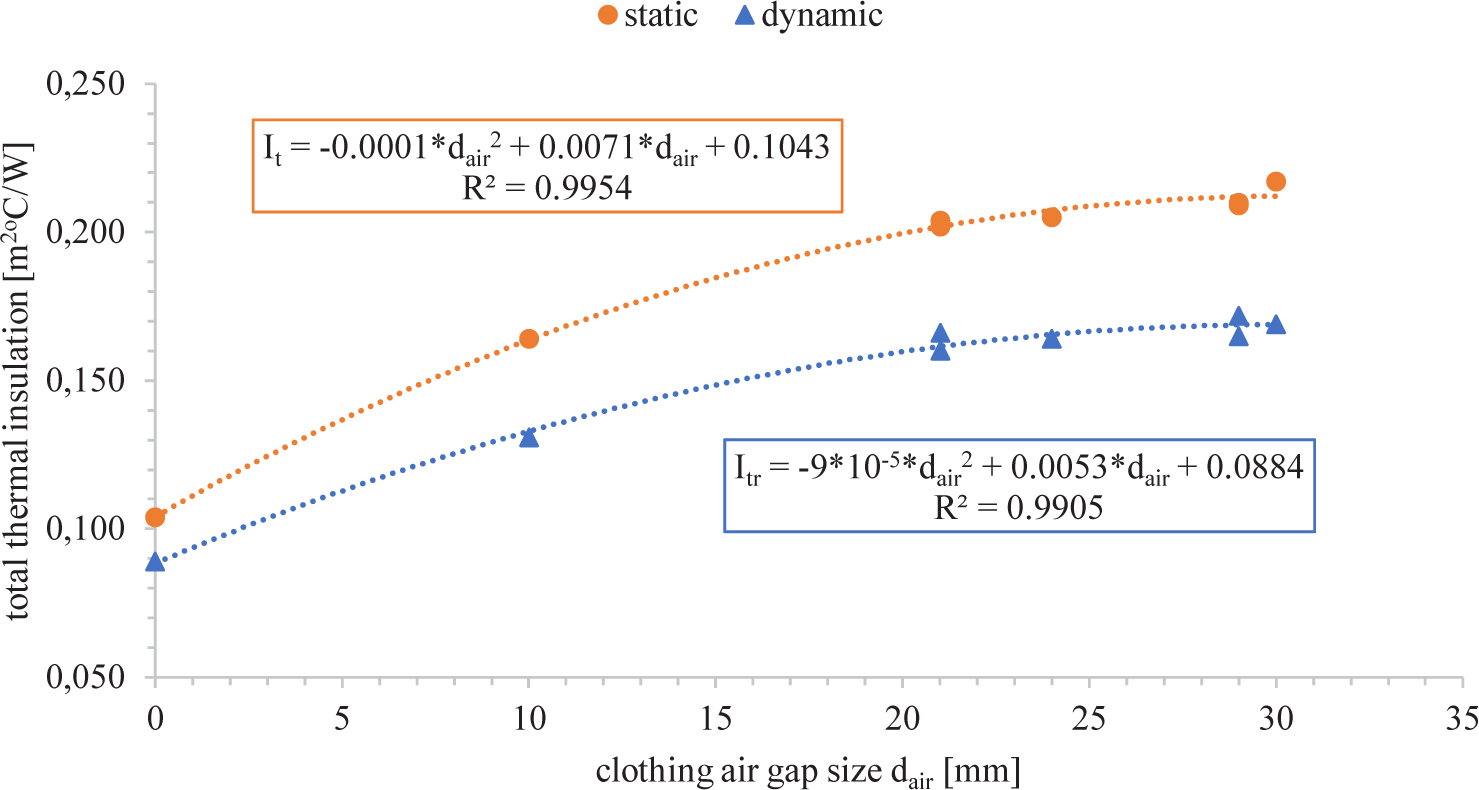
Fig. 7.
Relationship between the clothing’s total thermal insulation (static and dynamic) and the air gap size
Table 4.
The equations for the relationship between the clothing’s total thermal insulation (in static and dynamic test conditions), total air volume (Vt), and air gap size (dsir)
| Test conditions | Total air volume Vt [dm3] | Average air gap dair [mm] |
|---|---|---|
| static | It = −5*10−5*Vt2 + 0.0047*Vt + 0.104 (2) | It = −0.0001*dair2 + 0.0071*dair + 0.104 (3) |
| dynamic | Itr = −4*10−5*Vt2 + 0.0036*Vt + 0.088 (4) | Itr = −9*10−5*dair2 + 0.0053*dair + 0.088 (5) |