
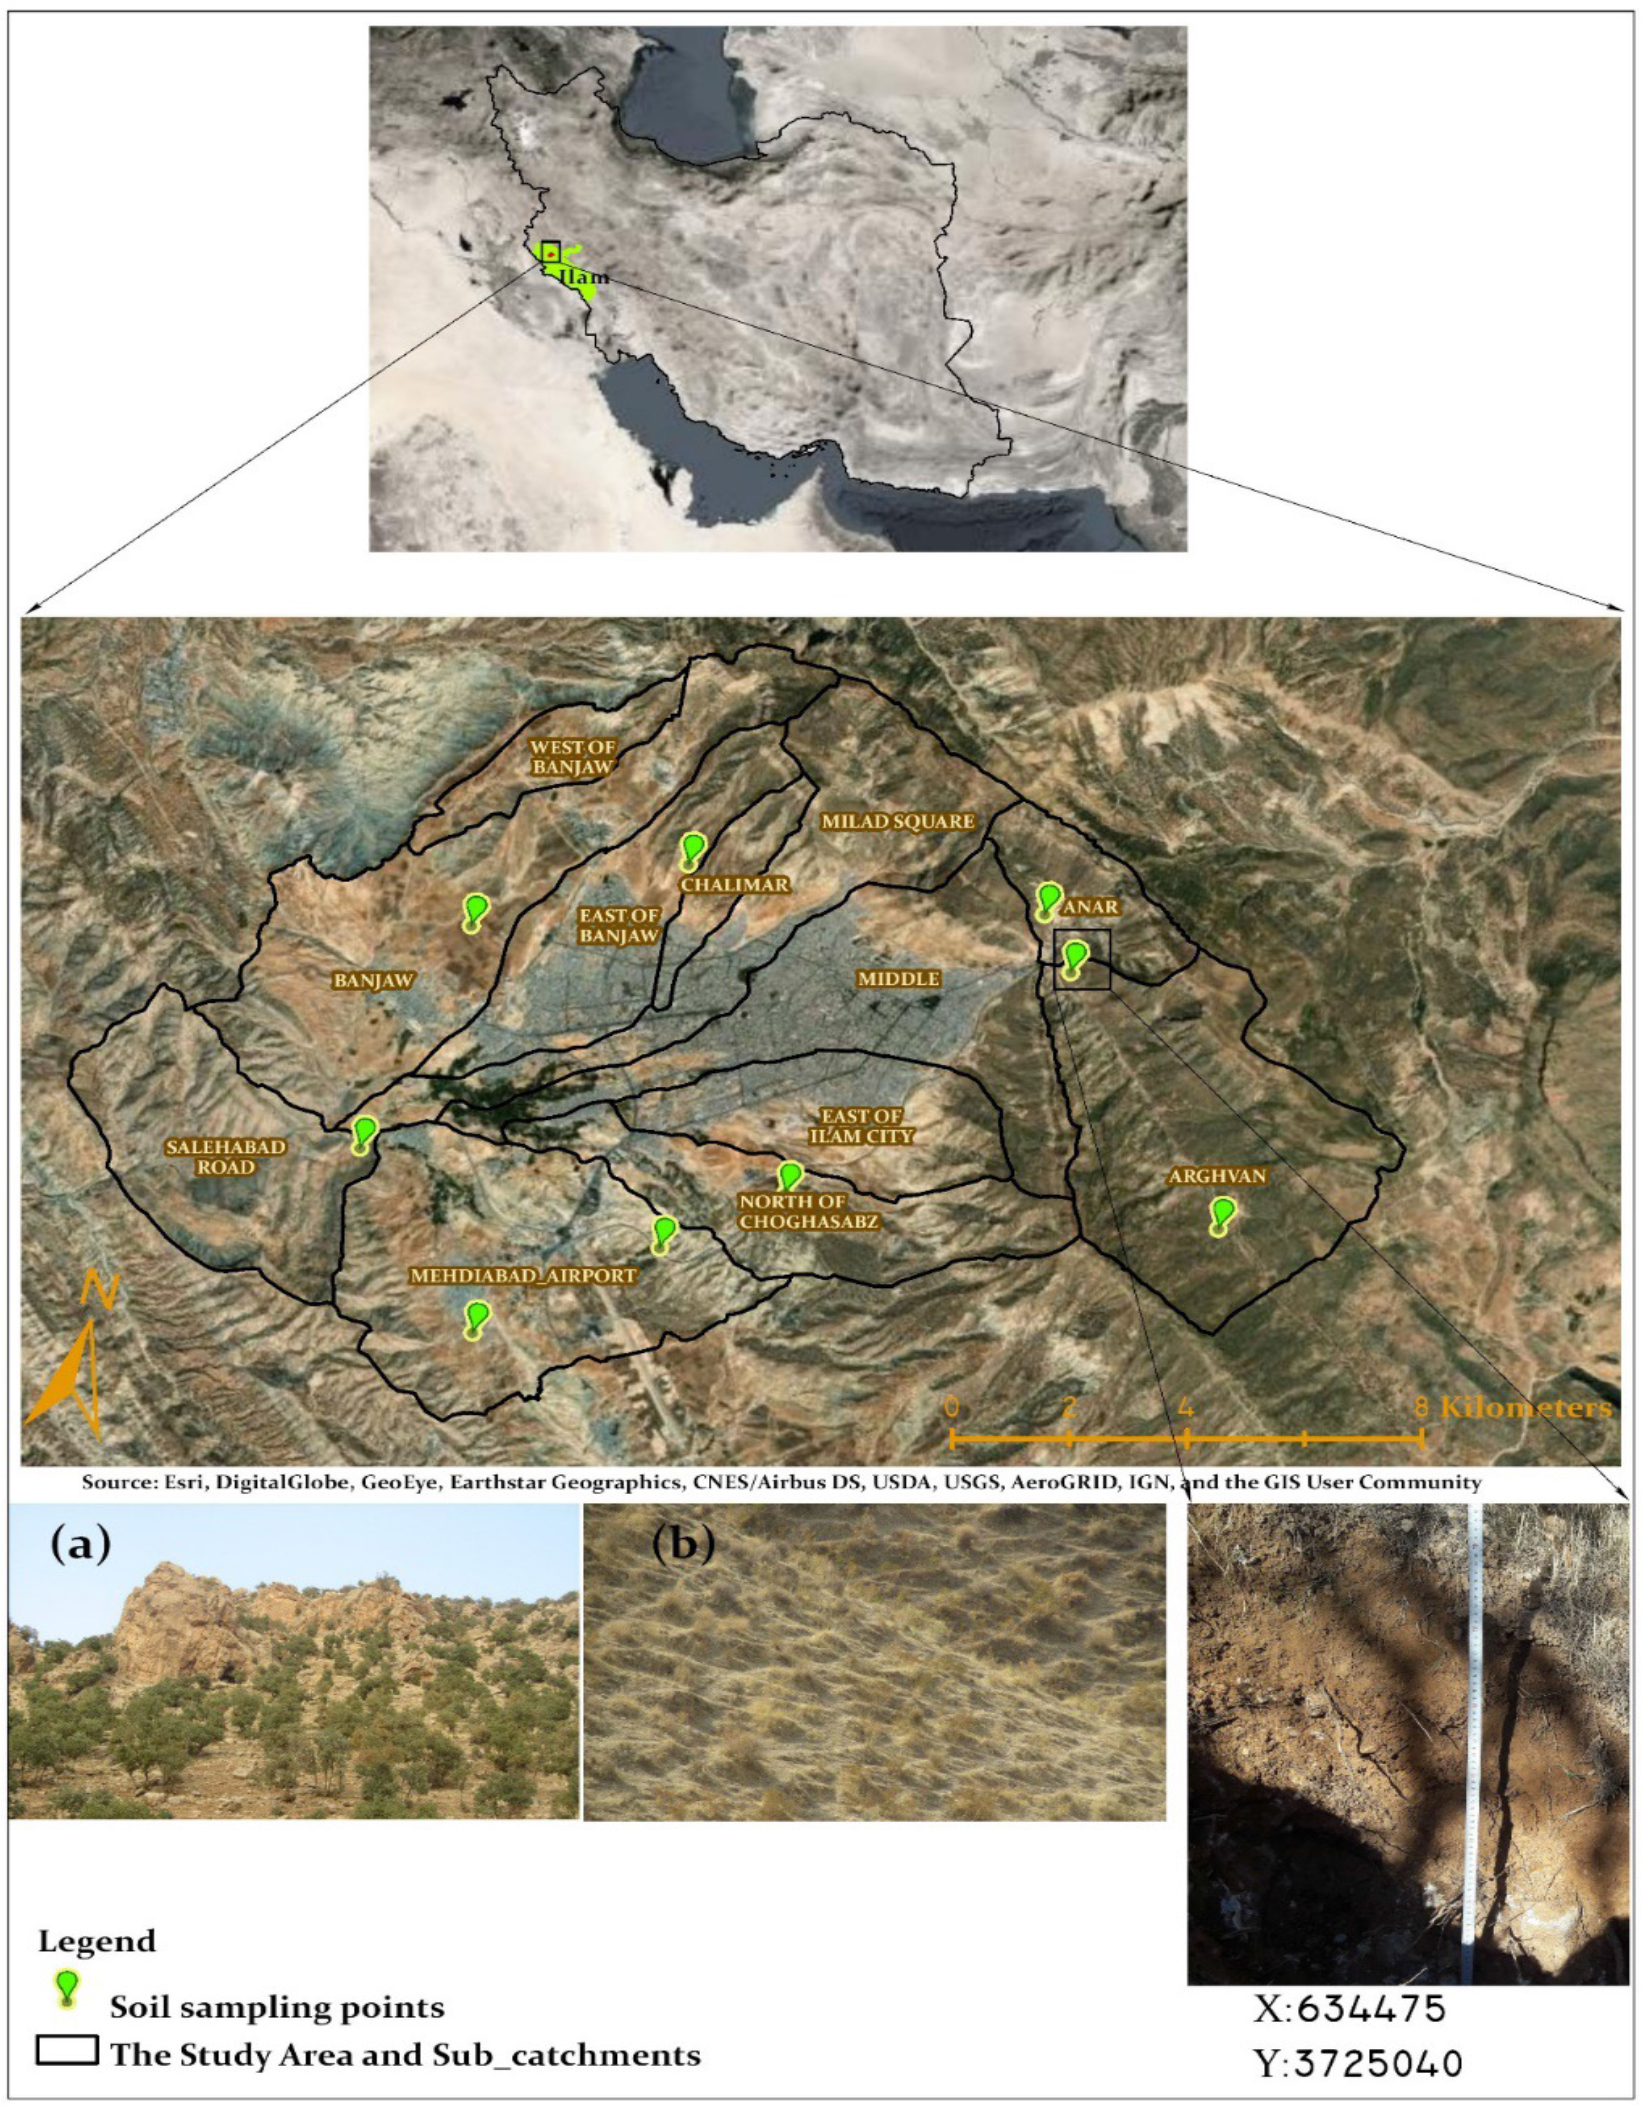
Figure 1.
Location of the study area and pictures of the soil erosion types in the catchment (a) sheet erosion in the Southwest of the catchment and rock fall movements.
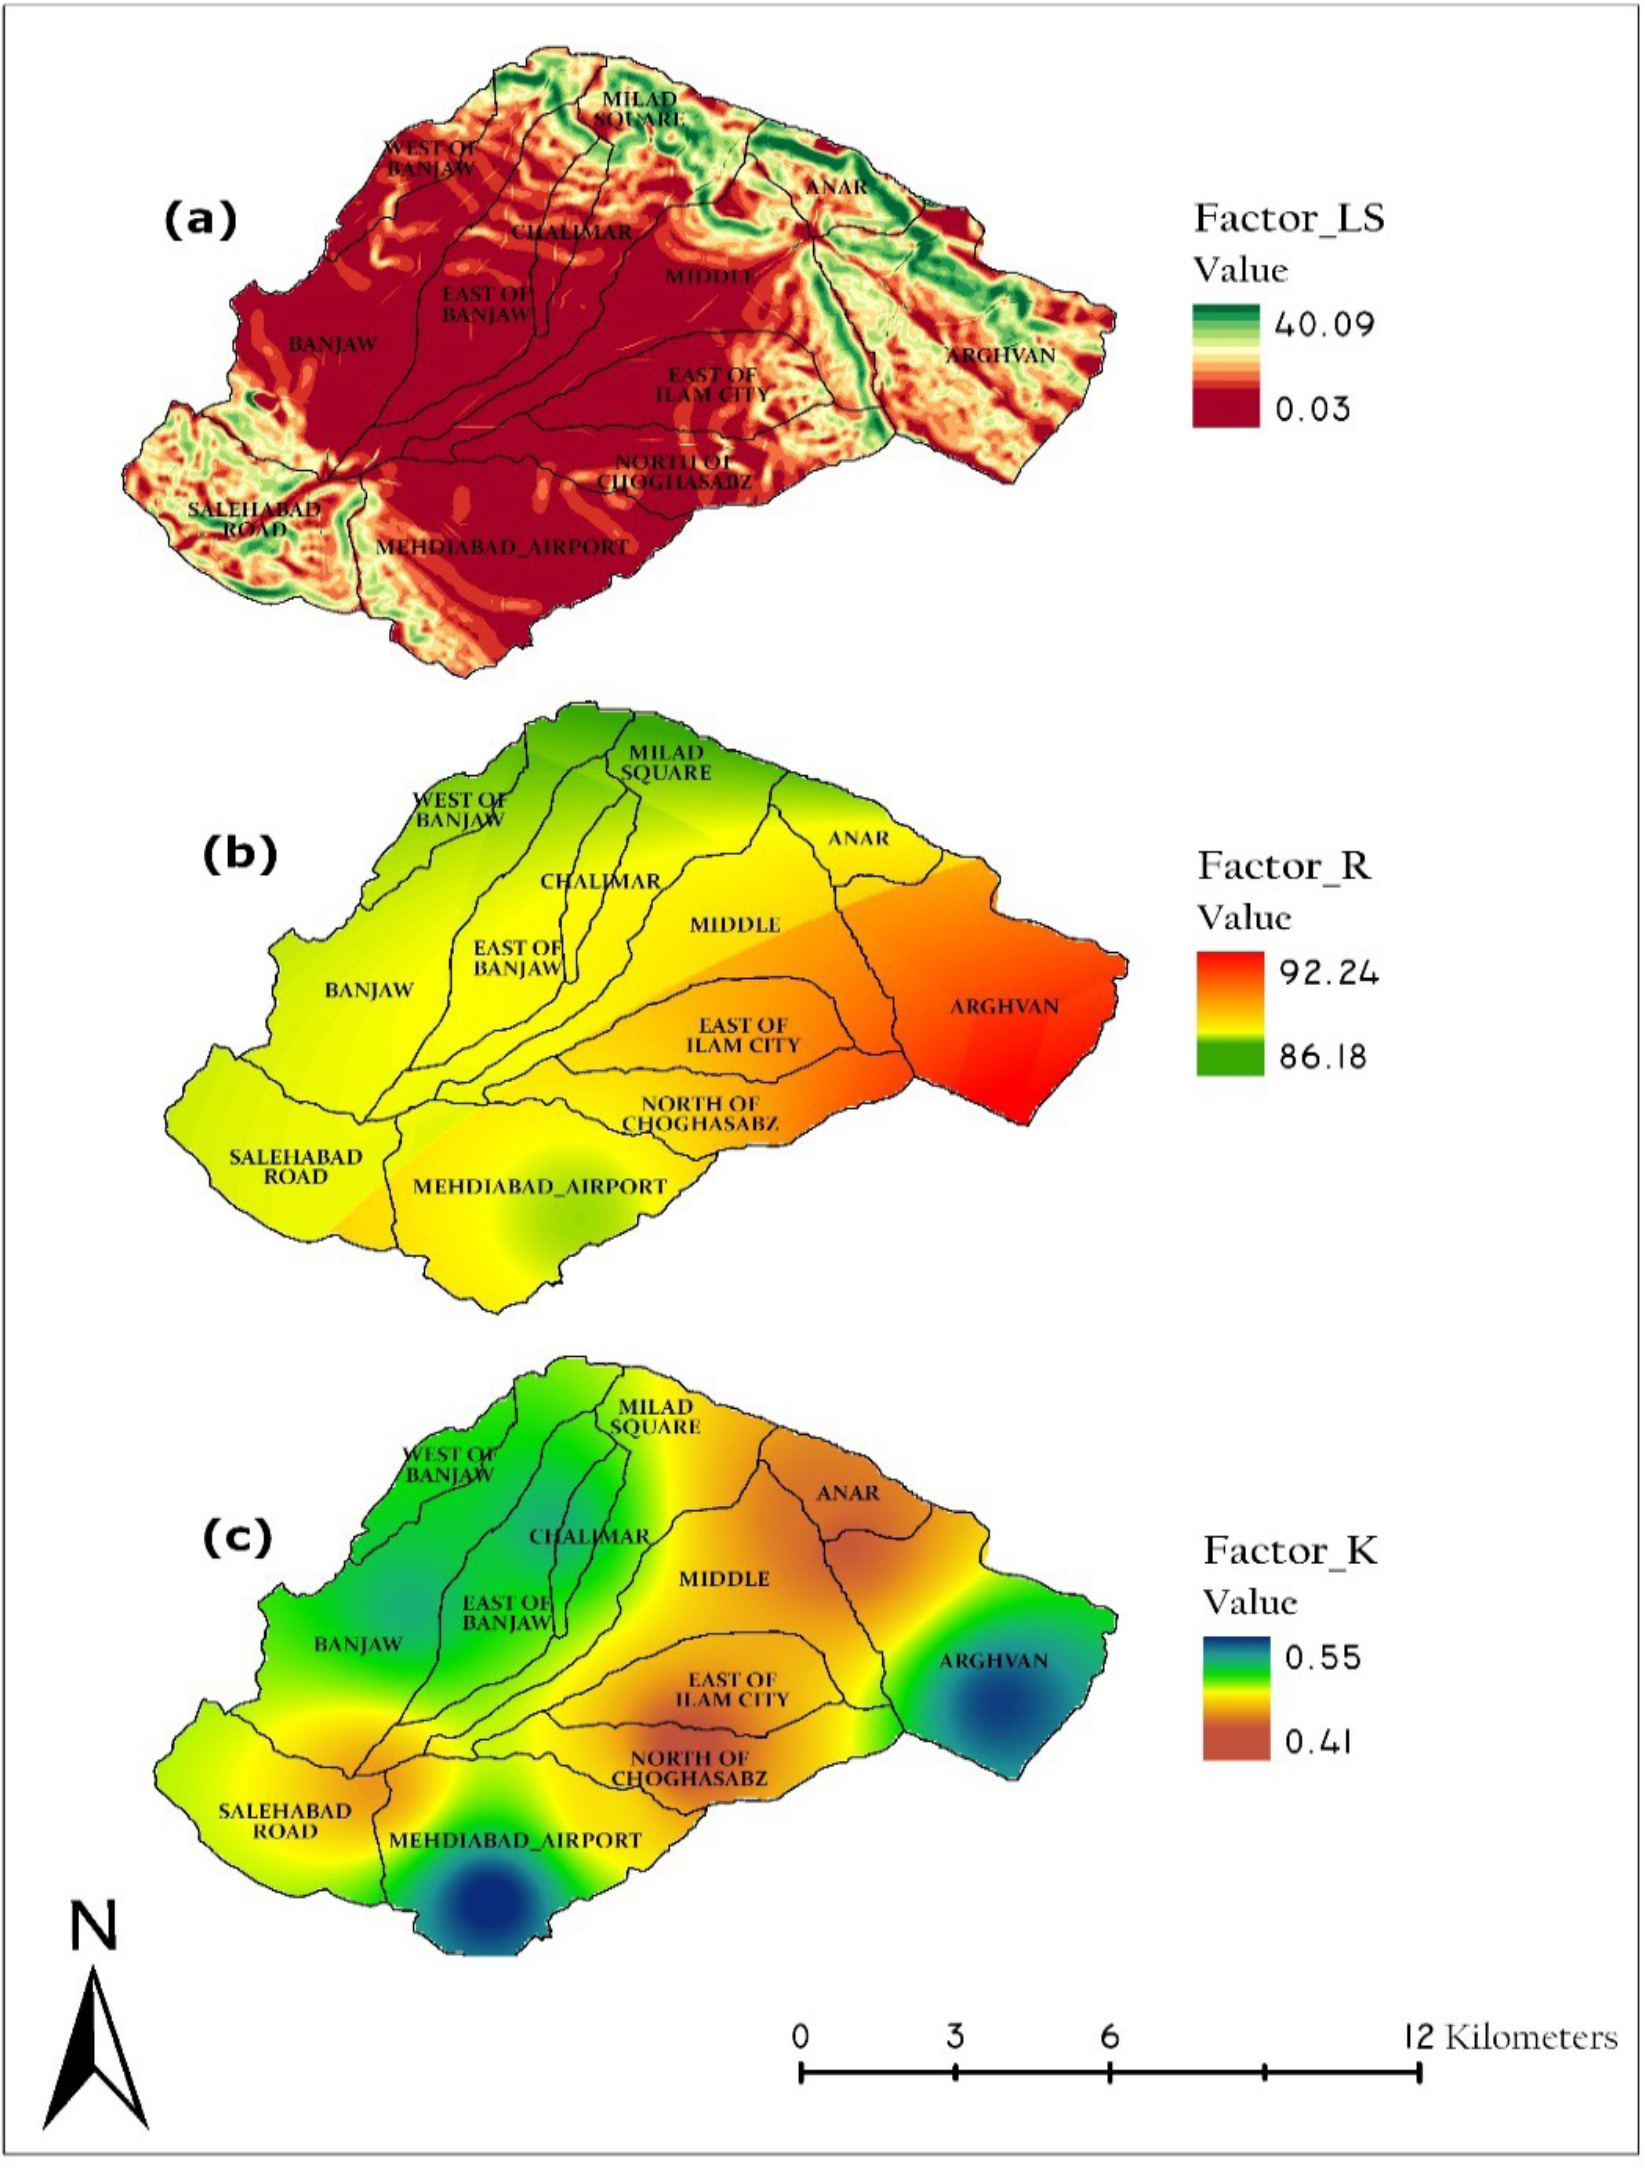
Figure 2.
Factors used to calculate the annual soil loss in the RUSLE model.
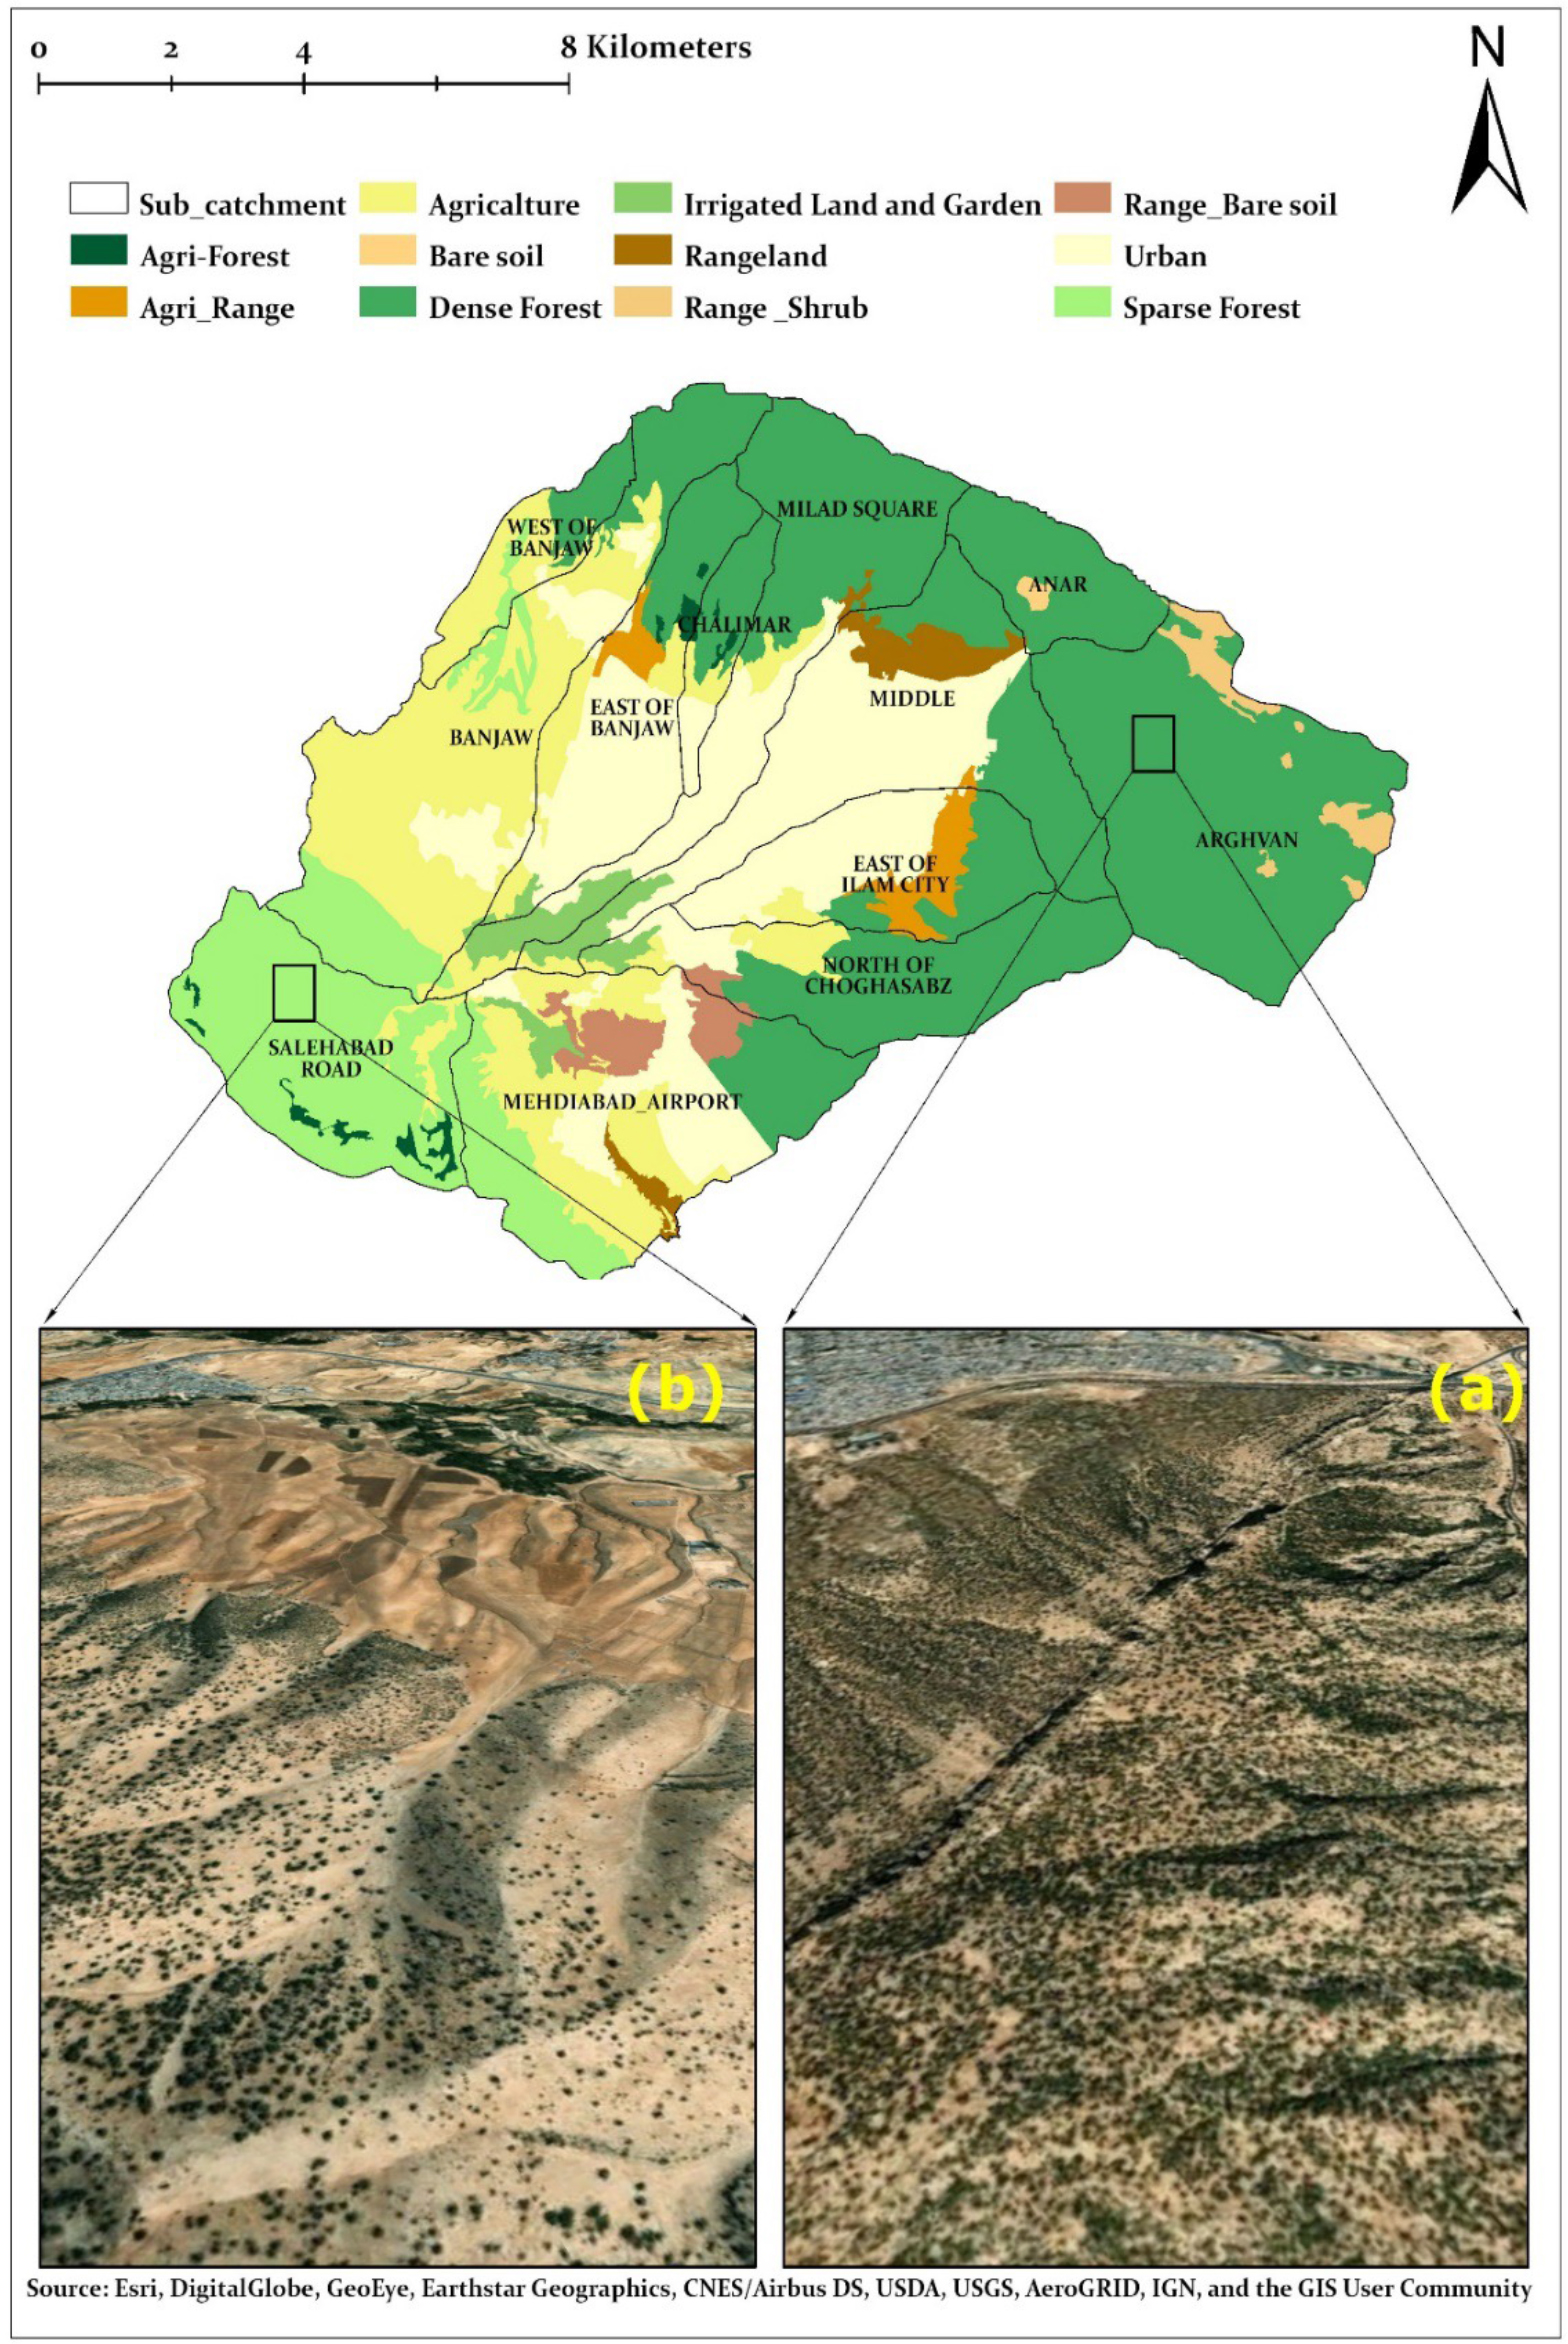
Figure 3.
The Land use map of the study catchment and pictures of the (a) Dense Forest, (b) Sparse Forest.
Source: Esri, DigitalGlobe, GeoEye, Earthstar Geographies, CNES/Airbus DS, USDA, USGS, AeroGRID, IGN, and the GIS User Community
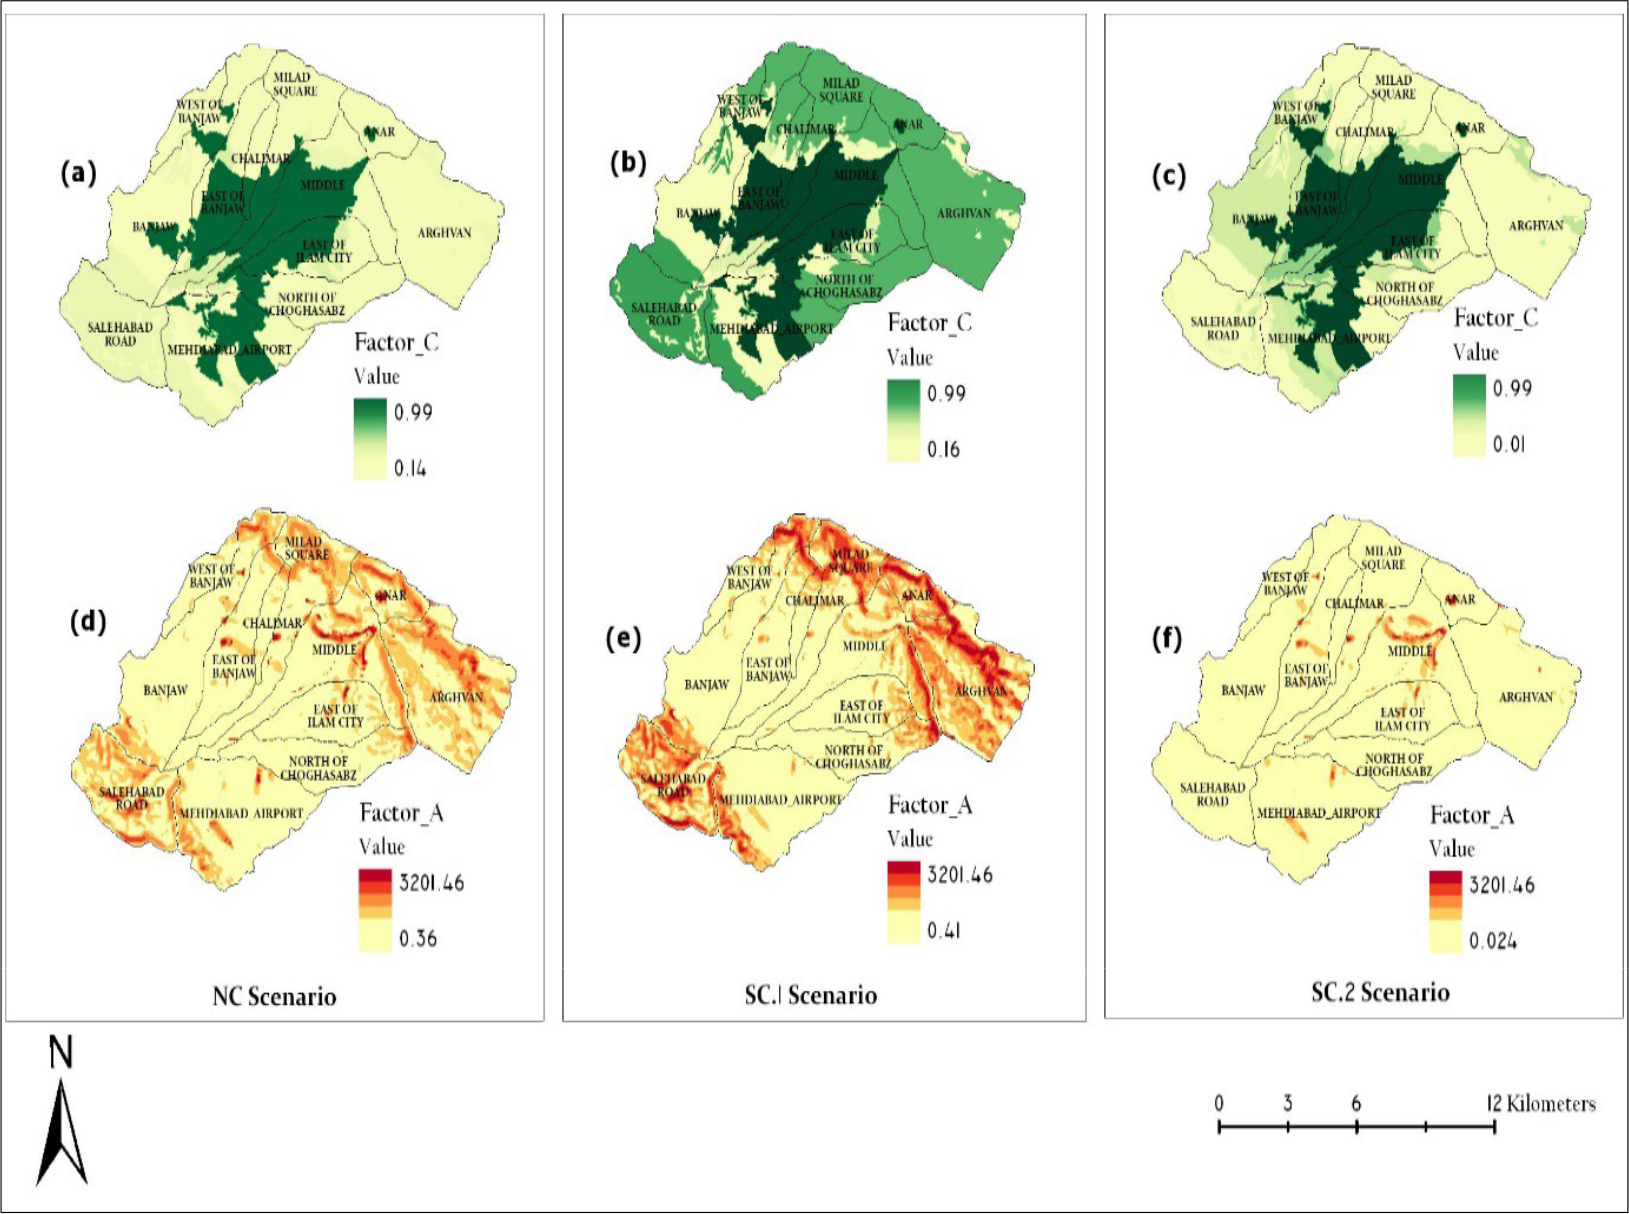
Figure 4.
The C factor and levels of soil erosion maps for the defined scenarios on the Ilam catchment.
Table 1.
Average annual soil erosion (t ha-1 year-1) under natural conditions.
| Land use type | NC | ||||
|---|---|---|---|---|---|
| Area | Factor | Soil loss | |||
| (km2) | (%) | C | Mean | Std | |
| Dense Forest | 52.974 | 40.18 | 0.17 | 78.61 | 53.17 |
| Sparse Forest | 17.083 | 12.96 | 0.2 | 95.41 | 48.85 |
| Agri-Forest | 0.854 | 0.65 | 0.14 | 46.79 | 27.61 |
| Agri-Range | 2.075 | 1.57 | 0.25 | 46.42 | 32.38 |
| Agriculture | 23.075 | 17.5 | 0.16 | 16.27 | 18.4 |
| Bare soil | 0.17 | 0.13 | 0.99 | 256.6 | 156.5 |
| Rangeland | 1.954 | 1.47 | 0.2 | 77.94 | 64.01 |
| Range-Bare soil | 2.138 | 1.62 | 0.55 | 39.02 | 36.74 |
| Range-Shrub | 1.476 | 1.12 | 0.19 | 62.01 | 55.7 |
| Irrigated and Garden | 2.833 | 2.15 | 0.18 | 9.36 | 12.49 |
| Urban | 27.212 | 20.64 | 0.99 | 63.54 | 63.88 |