
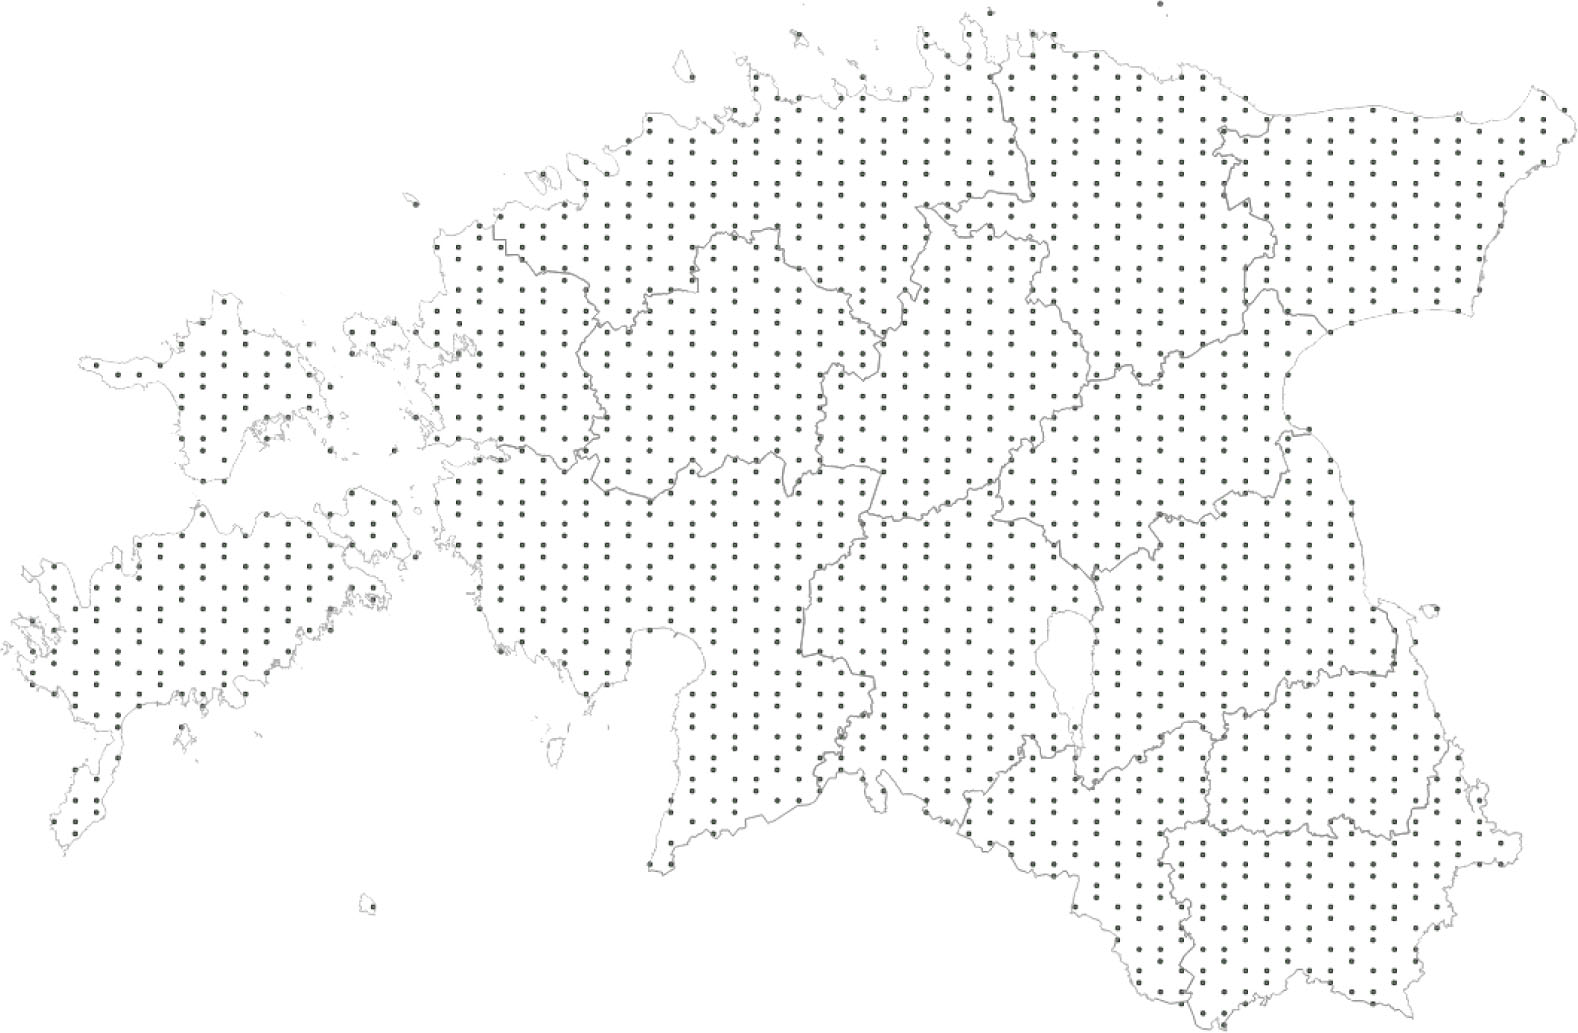
Figure 1
Cluster network of the Estonian NFI (2014–2018).
Joonis 1. Statistilise metsainventuuri proovitükkide klastrite paiknemine (2014–2018).
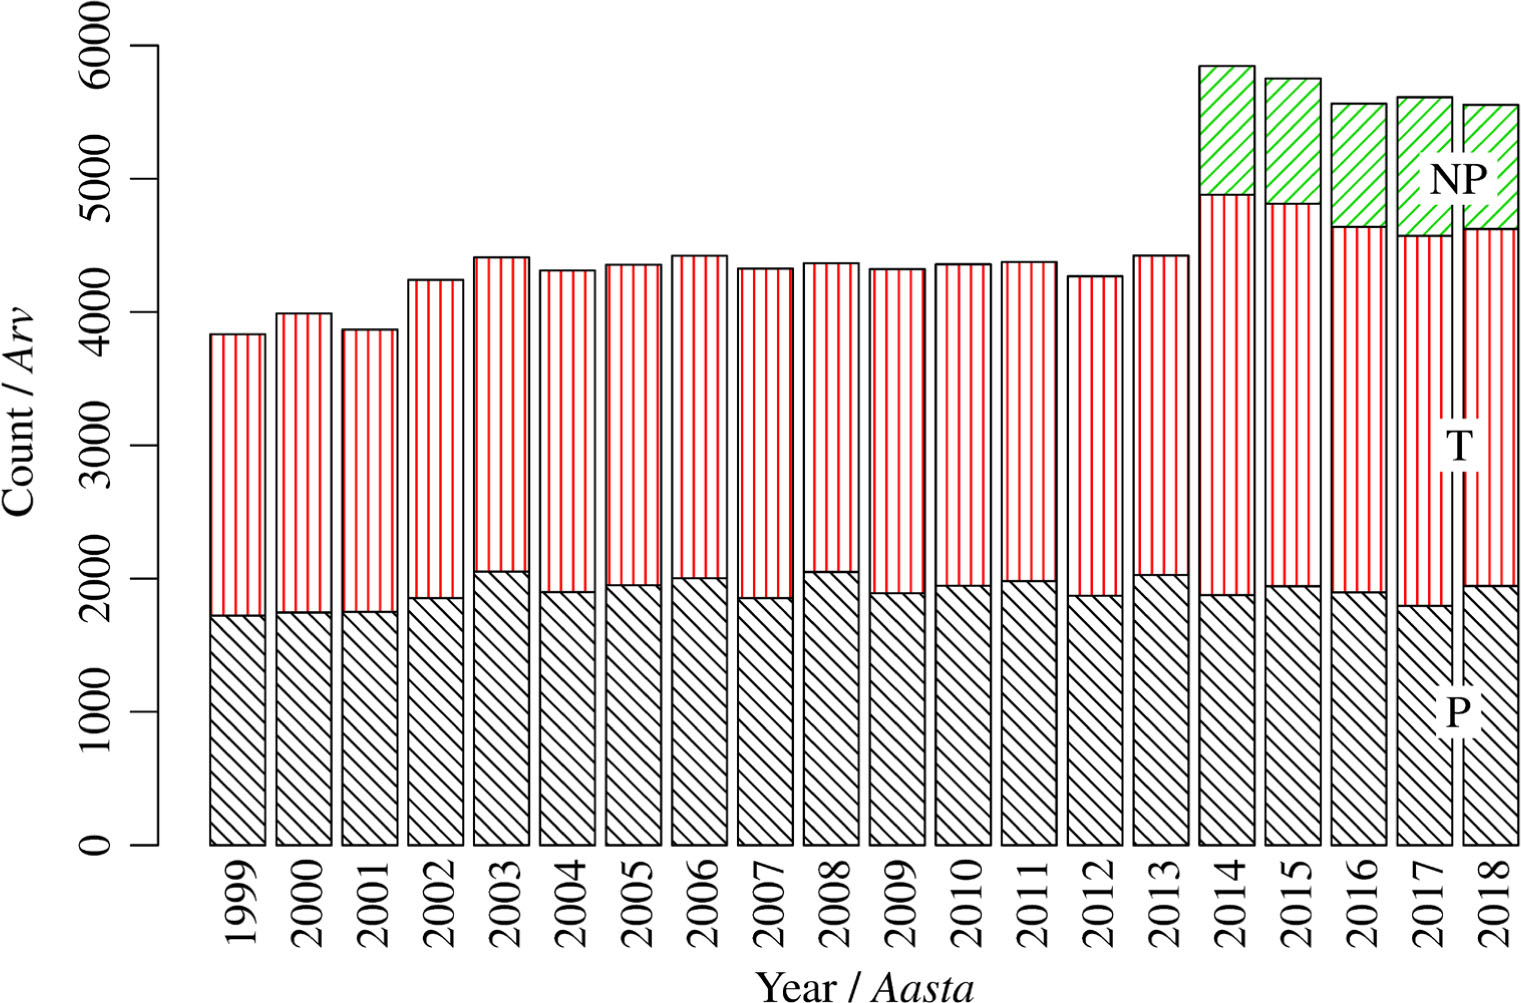
Figure 2
Number of measured permanent (P), temporary (T), and new permanent (NP) sample plots per year.
Joonis 2. Aastas mõõdetav alaliste (P), ajutiste (T) ja uute alaliste (NP) proovitükkide arv.
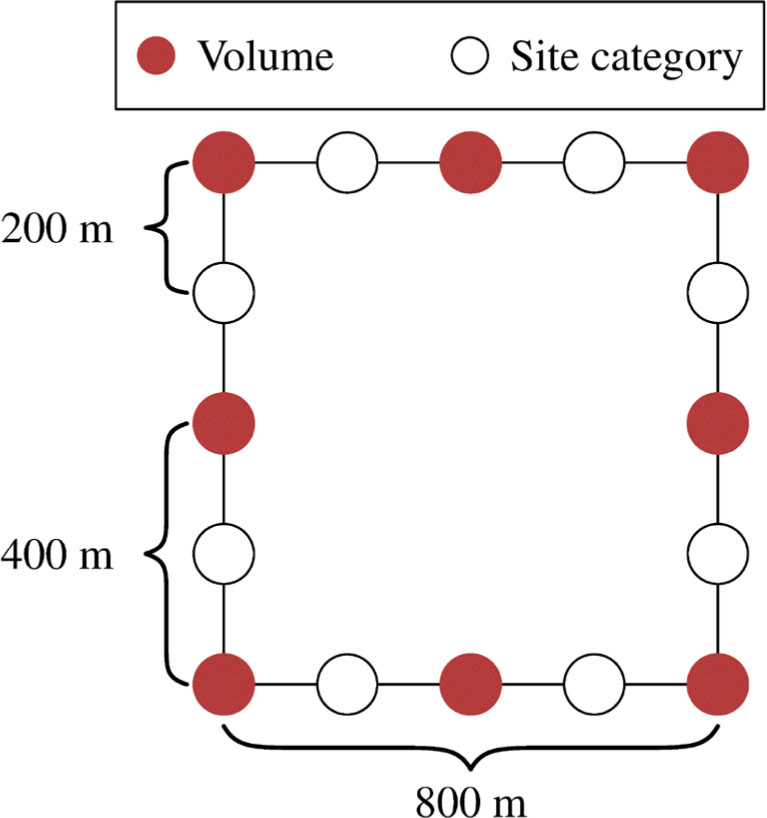
Figure 3
Estonian NFI cluster design and sample plot arrangement.
Joonis 3. Eesti statistilise metsainventuuri proovitükkide paiknemine klastris.
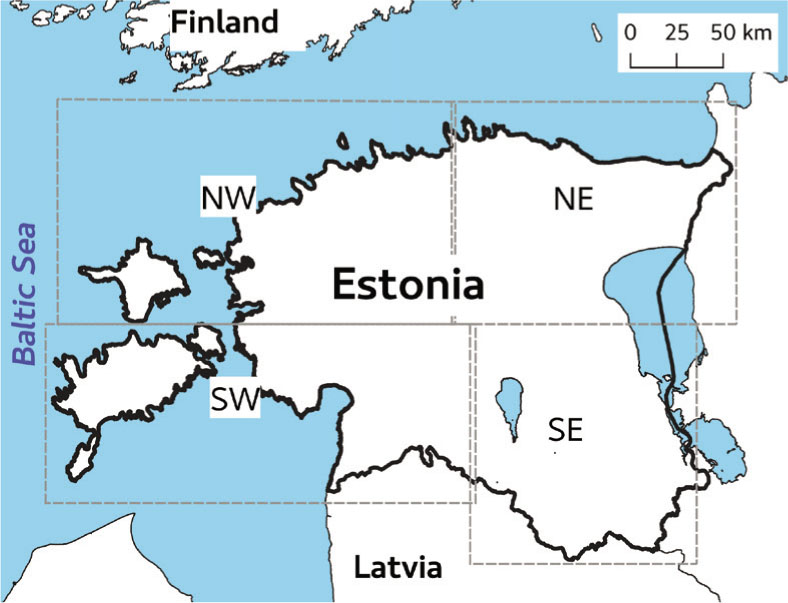
Figure 4
Location of target areas for fitting forest height and standing-wood volume models, corresponding to the Estonian Land Board ALS measurement schema. The areas are partially overlapping.
Joonis 4. Maa-ameti aerofotomõõdistuse objektid, mille piires lähendatakse puistu kõrguse ja tüvemahu prognoosmudelid. Alad on mõningase ülekattega.
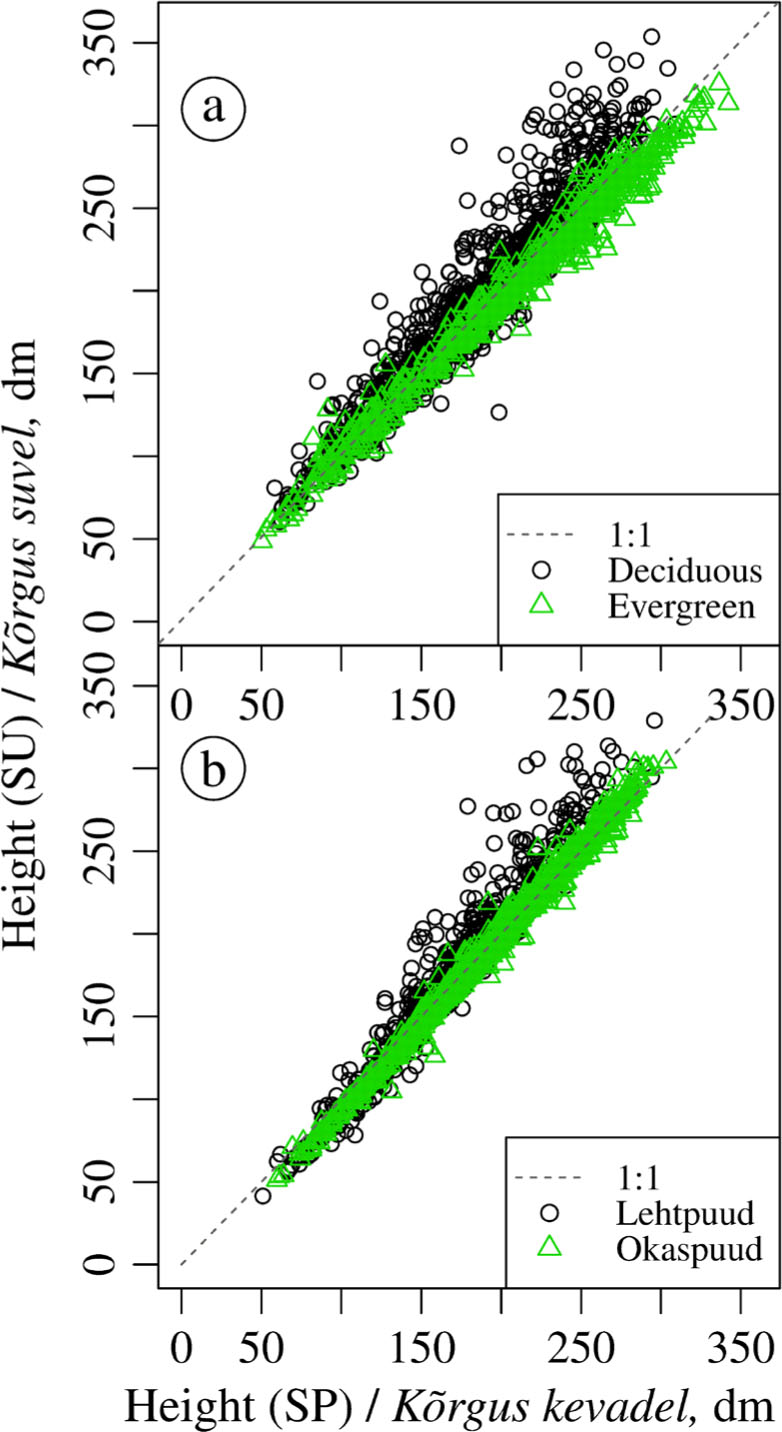
Figure 5
Predicted forest height on the overlap area of ALS data: (a) blocks SW and SE, (b) blocks NW and NE. The blocks correspond to lidar data from summer (SU) and springtime (SP).
Joonis 5. Lidarmõõtmise alade ülekatetel asuvatele puistutele prognoositud kõrgus: (a) plokid SW ja SE, (b) plokid NW ja NE. Plokid vastavad suvistele (SU) ja kevadistele (SP) lidarandmetele.
Table 1
Parameters for the forest-height H (dm) prediction model (1). ALS data are from spring (SP) and summer (SU), with RSE the model residual standard error, R2 the coefficient of determination, and DF the number of degrees of freedom. Insignificant values (p > 0.05) are in italics.
Tabel 1. Metsa kõrguse H (dm) prognoosmudeli (1) parameetrid. Eristatud on suvised (SU) ja kevadised (SP) laserskaneerimise lennud. RSE on mudeli jääkhälve, R2 on determinatsioonikordaja ja DF on vabadusastmete arv. Mitteolulised väärtused (p > 0,05) on kursiivis.
Table 2
Parameters for the standing-wood volume M (m3 ha−1) prediction model (2) for the upper layer. ALS data are from springtime (SP) and summer (SU). RSE is the model residual standard error, R2 the coefficient of determination, and DF the number of degrees of freedom. Insignificant values (p > 0.05) are in italics.
Tabel 2. Esimese rinde tüvemahu M (m3 ha−1) prognoosmudeli (2) parameetrid. Eristatud on suvised (SU) ja kevadised (SP) laserskaneerimise lennud. RSE on mudeli jääkhälve, R2 on determinatsioonikordaja ja DF on vabadusastmete arv. Mitteolulised väärtused (p > 0.05) on kursiivis.
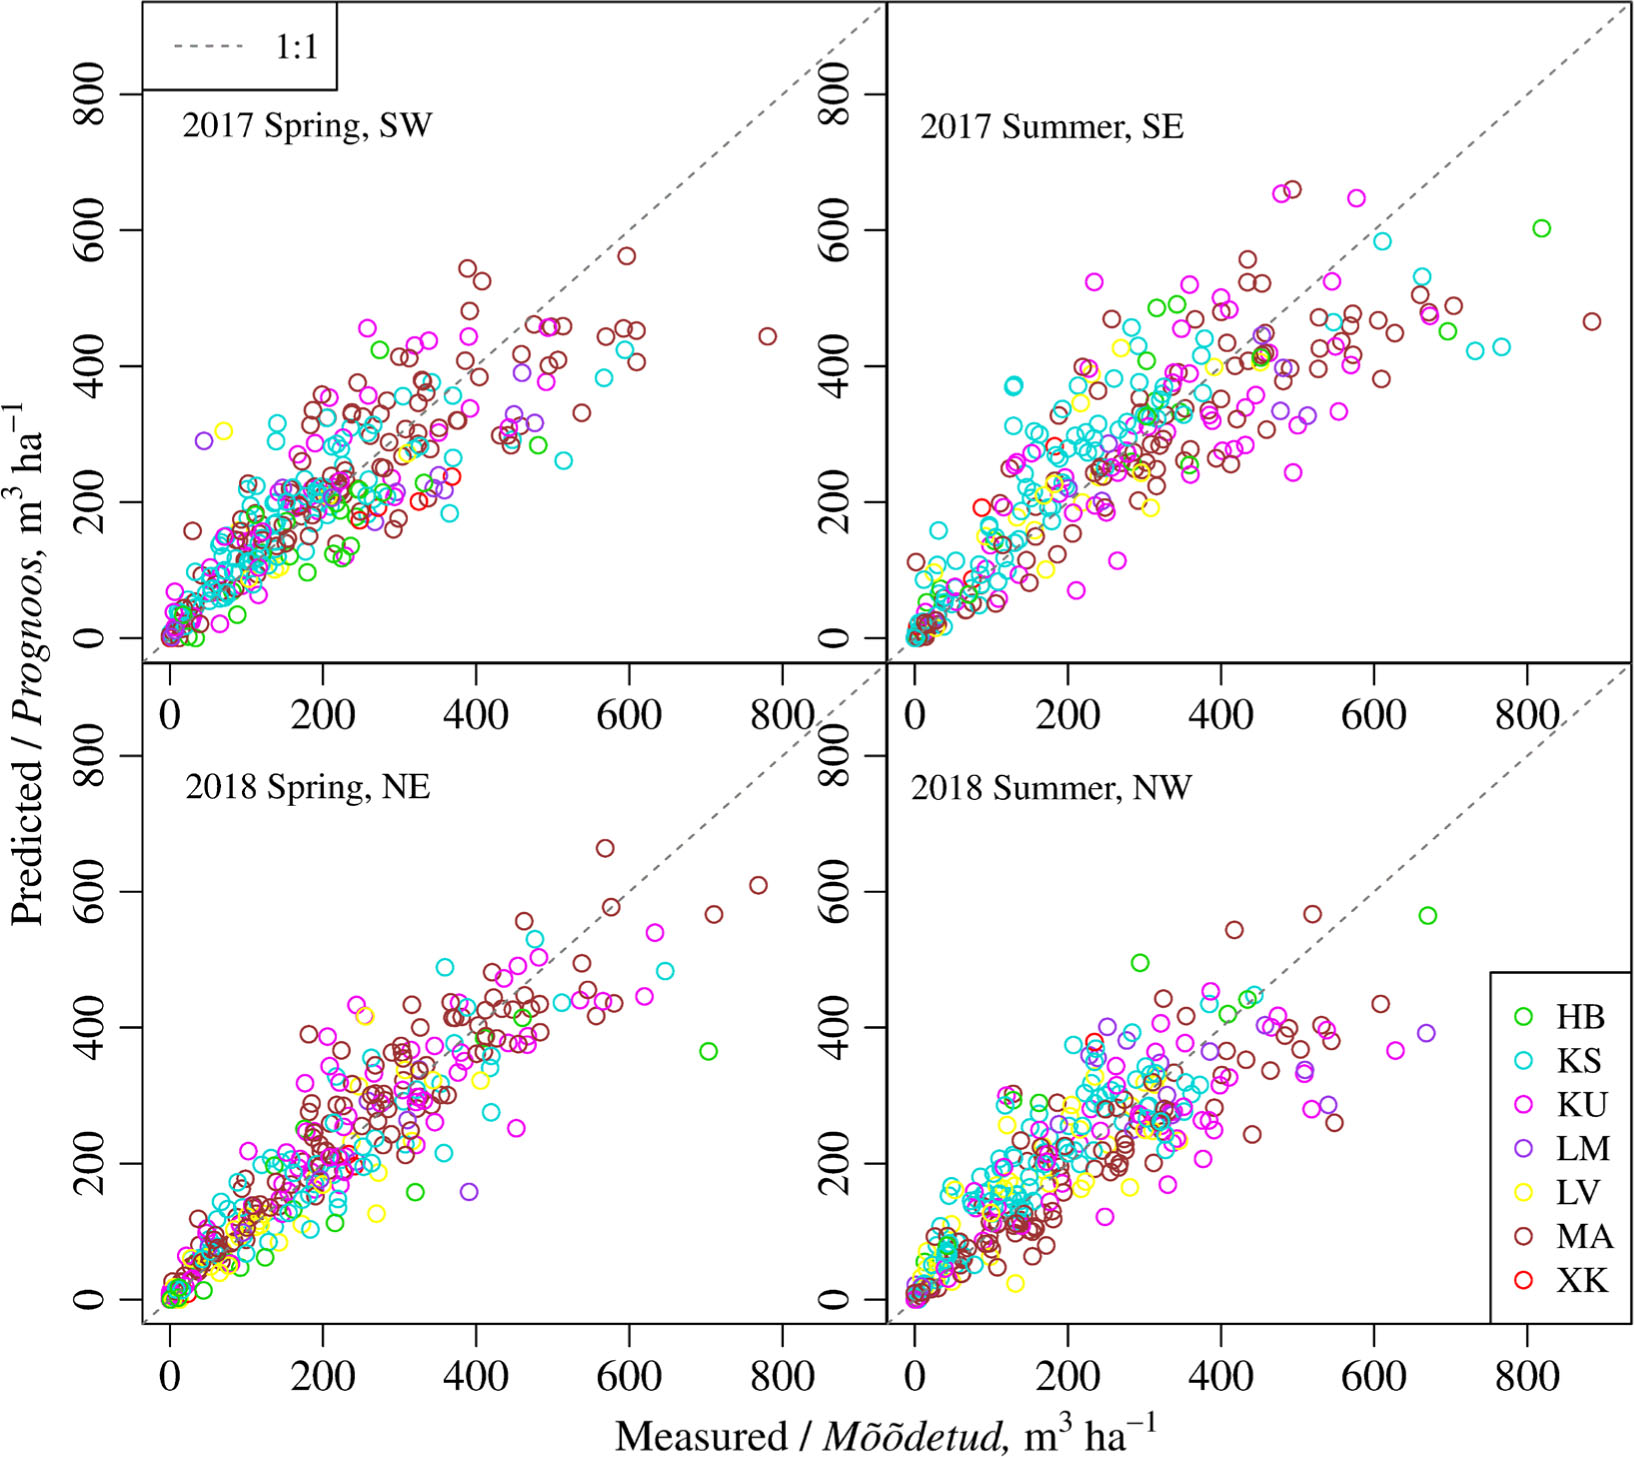
Figure 6
Measured and predicted wood volume for NFI sample plots. Dominant species codes: HB = European aspen; KS = silver birch; KU = Norway spruce; LM = black alder; LV = grey alder; MA = Scots pine; XK = other.
Joonis 6. Mõõdetud ja prognoositud tüvemaht SMI proovitükkidel. Enamuspuuliikide koodid on metsakorralduse juhendi järgi.
Table 3
Standing-wood volume M (m3 ha−1) prediction errors under model (2), by dominant tree species, with ALS data distinguished according to spring (SP) and summer (SU).
Tabel 3. Esimese rinde tüvemahu M (m3 ha−1) prognoosmudeli (2) vead peapuuliikide järgi. Eristatud on suvised (SU) ja kevadised (SP) laserskaneerimise lennud.
| ALS data ALS andmed | Target area Piirkond | Variable* Tunnus* | Dominant species**/ Enamuspuuliik** | ||||||
|---|---|---|---|---|---|---|---|---|---|
| HB | KS | KU | LM | LV | MA | XK | |||
| SP 2017 | SW | M̅ | 190 | 161 | 179 | 263 | 152 | 250 | 233 |
| SP 2017 | SW | RSE | 77 | 67 | 70 | 116 | 96 | 83 | 81 |
| SP 2017 | SW | MRE | −37 | 11 | 18 | −45 | 25 | −1 | −59 |
| SP 2017 | SW | N | 22 | 93 | 43 | 13 | 7 | 106 | 7 |
| SU 2017 | SE | M̅ | 265 | 190 | 287 | 331 | 199 | 302 | 87 |
| SU 2017 | SE | RSE | 102 | 92 | 106 | 90 | 76 | 98 | 73 |
| SU 2017 | SE | MRE | −3 | 37 | −13 | −51 | 22 | −26 | 57 |
| SU 2017 | SE | N | 18 | 83 | 57 | 8 | 18 | 92 | 4 |
| SP 2018 | NE | M̅ | 157 | 197 | 235 | 188 | 145 | 237 | 166 |
| SP 2018 | NE | RSE | 95 | 60 | 73 | 78 | 53 | 56 | 30 |
| SP 2018 | NE | MRE | −37 | −3 | 6 | −26 | −9 | 10 | −26 |
| SP 2018 | NE | N | 19 | 59 | 66 | 10 | 31 | 120 | 3 |
| SU 2018 | NW | M̅ | 239 | 162 | 248 | 314 | 158 | 211 | 235 |
| SU 2018 | NW | RSE | 104 | 59 | 91 | 125 | 59 | 72 | 144 |
| SU 2018 | NW | MRE | 54 | 31 | −29 | −17 | 12 | −24 | 144 |
| SU 2018 | NW | N | 9 | 99 | 54 | 16 | 36 | 93 | 1 |
* M̅ = mean of measured values (m3 ha−1); N = number of observations; RSE = residual standard error (m3 ha−1); MRE = mean residual error (m3 ha−1).
** Species codes: HB = European aspen; KS = silver birch; KU = Norway spruce; LM = black alder; LV = grey alder; MA = Scots pine; XK = other. / *M̅: vaatluste aritmeetiline keskmine (m3 ha−1), N: vaatluste arv, RSE: keskmine ruutviga (m3 ha−1), MRE: keskmine viga (m3 ha−1).** Puuliikide koodid on metsakorralduse juhendi järgi.
Table 4
The average difference between predicted forest height Ĥ (m) and standing-wood volume in the case of both evergreen (EGR) and deciduous (DEC) stands, upon comparing ALS springtime (SP) against summer (SU) data.
Tabel 4. Prognoositud kõrguse Ĥ (m) ja esimese rinde tüvemahukeskmine erinevus okaspuupuistutes (EGR) ja lehtpuupuistutes (DEC) kasutades suvised (SU) ja kevadisi (SP) laser-skaneerimise andmeid.
| Block SP Ala SP | Block SU Ala SU | ||||
|---|---|---|---|---|---|
| EGR | DEC | EGR | DEC | ||
| SW | SE | 0.53 | −0.90 | 34.5 | −46.5 |
| NE | NW | 0.13 | −0.71 | 40.4 | −38.0 |
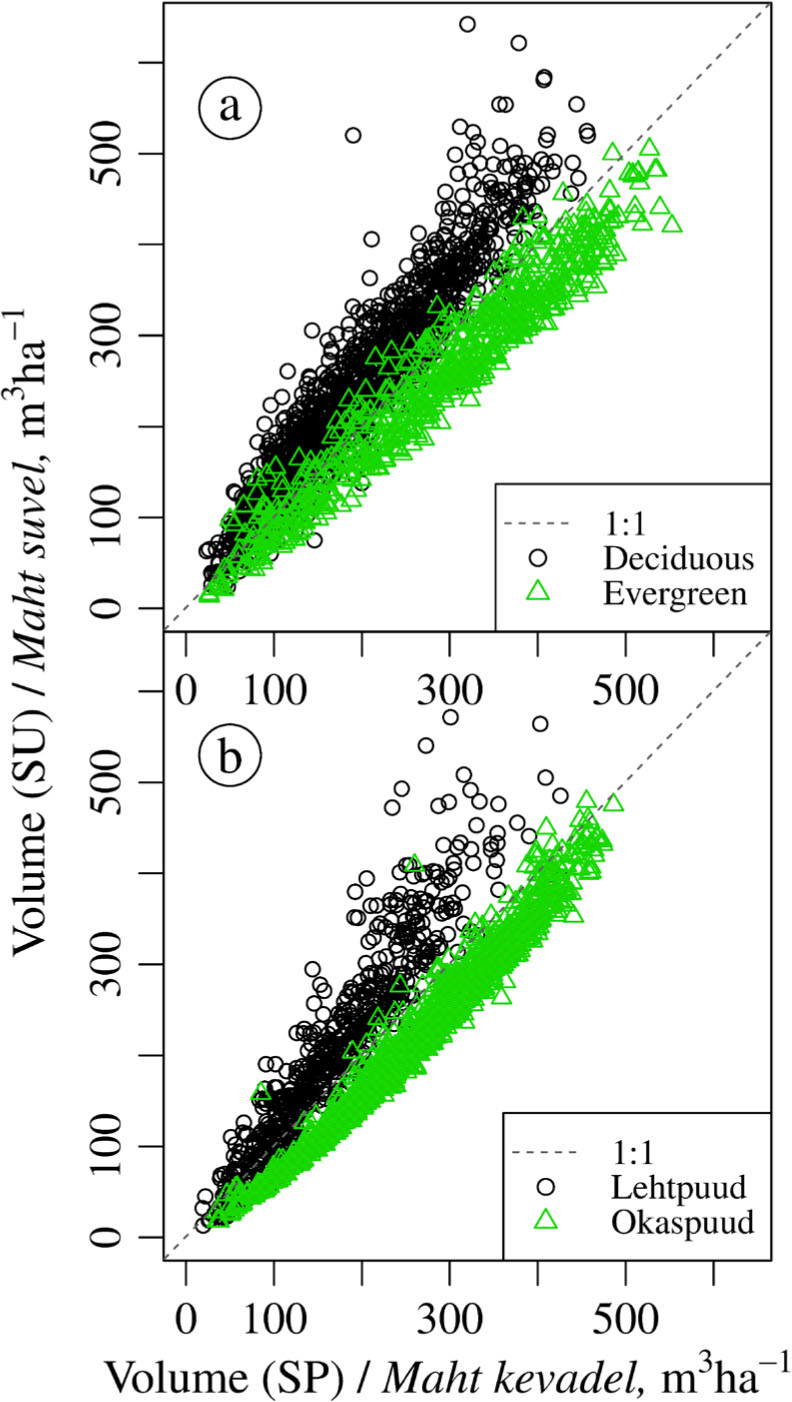
Figure 7
Predicted standing-wood volume on the overlap area of ALS data: (a) blocks SW and SE, (b) blocks NW and NE. The blocks correspond to lidar data from summer (SU) and springtime (SP).
Joonis 7. Prognoositud puistu tüvemaht lidarmõõtmise alade ülekatetel: (a) plokid SW ja SE, (b) plokid NW ja NE.
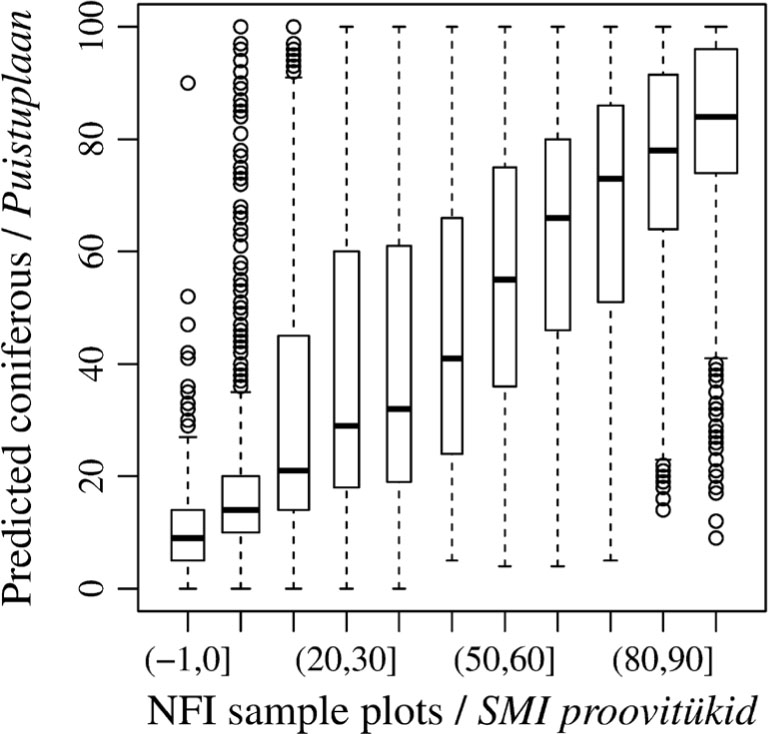
Figure 8
Predicted proportion (%) of evergreen conifers for 5,011 NFI sample plots with stands older than 24 years.
Joonis 8. Prognoositud okaspuude osakaal 5011 SMI proovitükil, kus kasvab 24-aastane või vanem puistu.
Table 5
Predicted dominant species and field observations on 6,239 NFI sample plots.
Tabel 5. Prognoositud enamuspuuliik võrrelduna 6239 SMI proovitüki andmetega.