
Tabel 1
Ozolinši valemi (2) kordajad (Ozolinš, 1988; Ozolinš, 2002).
Table 1. Coefficients of taper curve (2) (Ozolinš, 1988; Ozolinš, 2002).
| Puuliik Tree species | a0 | a1 | a2 | a3 | a4 | a5 | a6 |
|---|---|---|---|---|---|---|---|
| Harilik mänd Pinus sylvestris | 118,981 | −277,578 | 1140,525 | −3037,487 | 4419,682 | −3361,78 | 997,657 |
| Harilik kuusk Picea abies | 113,939 | −203,061 | 827,209 | −2161,251 | 2732,076 | −1699,667 | 390,755 |
| Kask Betula sp. | 120,567 | −312,074 | 1388,288 | −3725,819 | 5197,005 | −3788,858 | 1120,891 |
| Harilik haab Populus tremula | 120,224 | −310,985 | 1450,125 | −4238,703 | 6644,011 | −5408,312 | 1743,64 |
| Sanglepp Alnus glutinosa | 110,428 | −143,288 | 530,481 | −1643,304 | 2606,605 | −2212,94 | 752,018 |
| Hall-lepp Alnus incana | 118,56 | −263,482 | 988,135 | −2376,874 | 3045,214 | −2137,684 | 626,131 |
| Harilik tamm Quercus robur | 120,958 | −354,769 | 2022,206 | −6736,346 | 11231,25 | −9254,632 | 2971,333 |
| Harilik saar Fraxinus excelsior | 117,999 | −282,941 | 1411,064 | −4542,395 | 7964,66 | −7175,007 | 2506,62 |
| Harilik pärn Tilia cordata | 110,428 | −143,287 | 530,477 | −1643,287 | 2606,569 | −2212,906 | 752,006 |
Tabel 2
Perturbatsiooni kordaja valemi kordajate hinnangud (Ozolinš, 1988) ning diameetrite ja kõrguste mõju perturbatsiooni kordaja väärtusele.
Table 2. Estimates of the perturbation coefficient formula coefficients (Ozolinš, 1988) and the effect of diameters and heights on the value of the perturbation coefficient.
| Puuliik Tree species | h0 | d0 | p | q | Perturbatsiooni kordaja y(x) väärtus Perturbation coeficient y(x) value | |||
|---|---|---|---|---|---|---|---|---|
| h < h0 | h < h0 | d < d0 | d < d0 | |||||
| Harilik mänd Pinus sylvestris | 26 | 30 | 0,0070 | −0,0070 | > 1 | < 1 | < 1 | > 1 |
| Harilik kuusk Picea abies | 33 | 36 | 0,0087 | −0,0197 | > 1 | < 1 | < 1 | > 1 |
| Kask Betula sp. | 20 | 28 | 0,0210 | 0,0000 | > 1 | < 1 | = 1 | = 1 |
| Harilik haab Populus tremula | 18 | 20 | 0,0074 | 0,0002 | > 1 | < 1 | > 1 | < 1 |
| Sanglepp Alnus glutinosa | 14 | 12 | 0,0264 | −0,0017 | > 1 | < 1 | < 1 | > 1 |
| Hall-lepp Alnus incana | 16 | 16 | 0,0168 | −0,0103 | > 1 | < 1 | < 1 | > 1 |
| Harilik tamm Quercus robur | 14 | 20 | 0,0263 | 0,0005 | > 1 | < 1 | > 1 | < 1 |
| Harilik saar Fraxinus excelsior | 21 | 20 | −0,0021 | 0,0000 | < 1 | > 1 | = 1 | = 1 |
| Harilik pärn Tilia cordata | 16 | 12 | 0,0061 | 0,0000 | > 1 | < 1 | = 1 | = 1 |
Tabel 3
Pärast integreerimist saadud 17 astme polünoomi (valem 12) kordajate arvutusvalemid.
Table 3. Calculation formulas for the coefficients of the 17 degree polynomial (formula 12) obtained after integration.
| Kordaja tähis Coefficient | Arvutusvalem (b0, b1, …, b8 arvutatud valemitega 10) Equation (b0, b1,…, b8calculated by formulas 10) | Muutuja Variable |
|---|---|---|
| c1 | b0 · b0 | l |
| c2 | b0 · b1 | l2 |
| c3 | l3 | |
| c4 | l4 | |
| c5 | l5 | |
| c6 | l6 | |
| c7 | l7 | |
| c8 | l8 | |
| c9 | l9 | |
| c10 | l10 | |
| c11 | l11 | |
| c12 | l12 | |
| c13 | l13 | |
| c14 | l14 | |
| c15 | l15 | |
| c16 | l16 | |
| c17 | l17 |
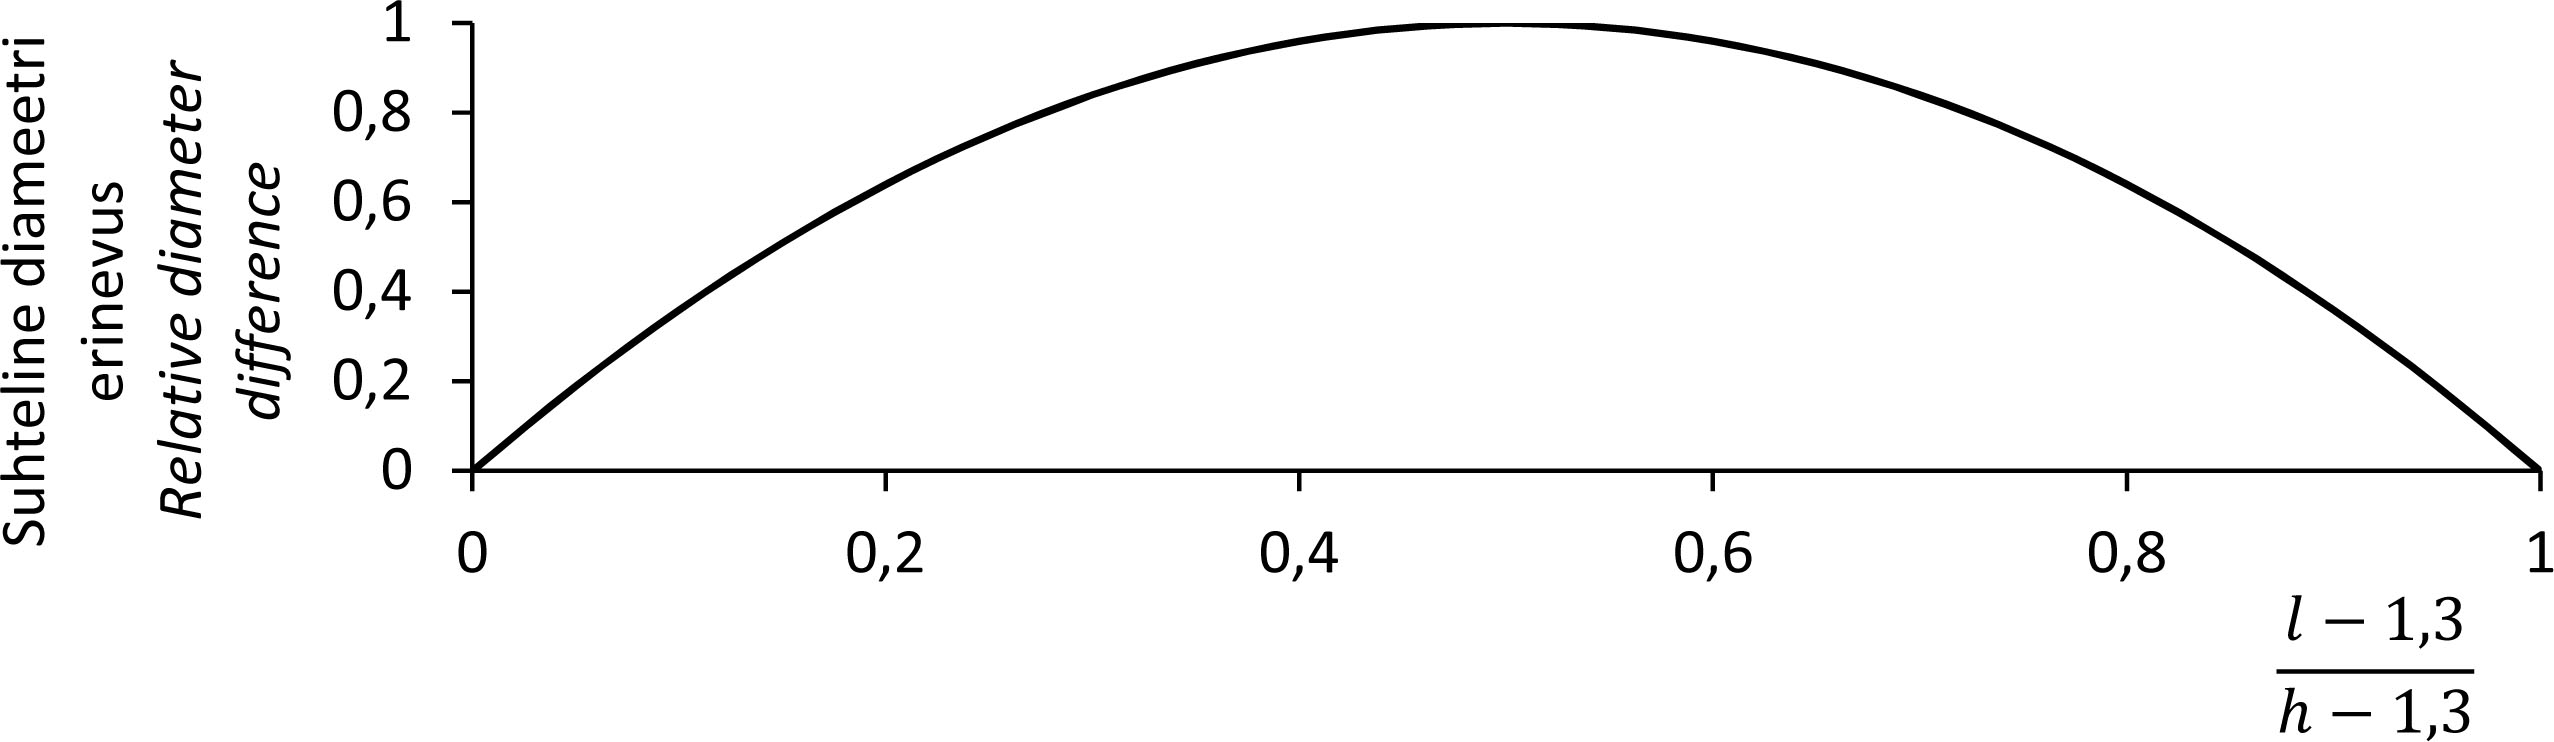
Joonis 1
Puu suhtelisest kõrgusest (0 – 1,3 m ja 1 – puu tipp) sõltuv tegeliku diameetri ja tüvemoodustajaga arvutatud diameetri suhteline erinevus.
Figure 1. Relative difference between the actual diameter and the diameter calculated with the stem curve depending on the relative height of a tree (0 – 1.3 m and 1 – tree top).
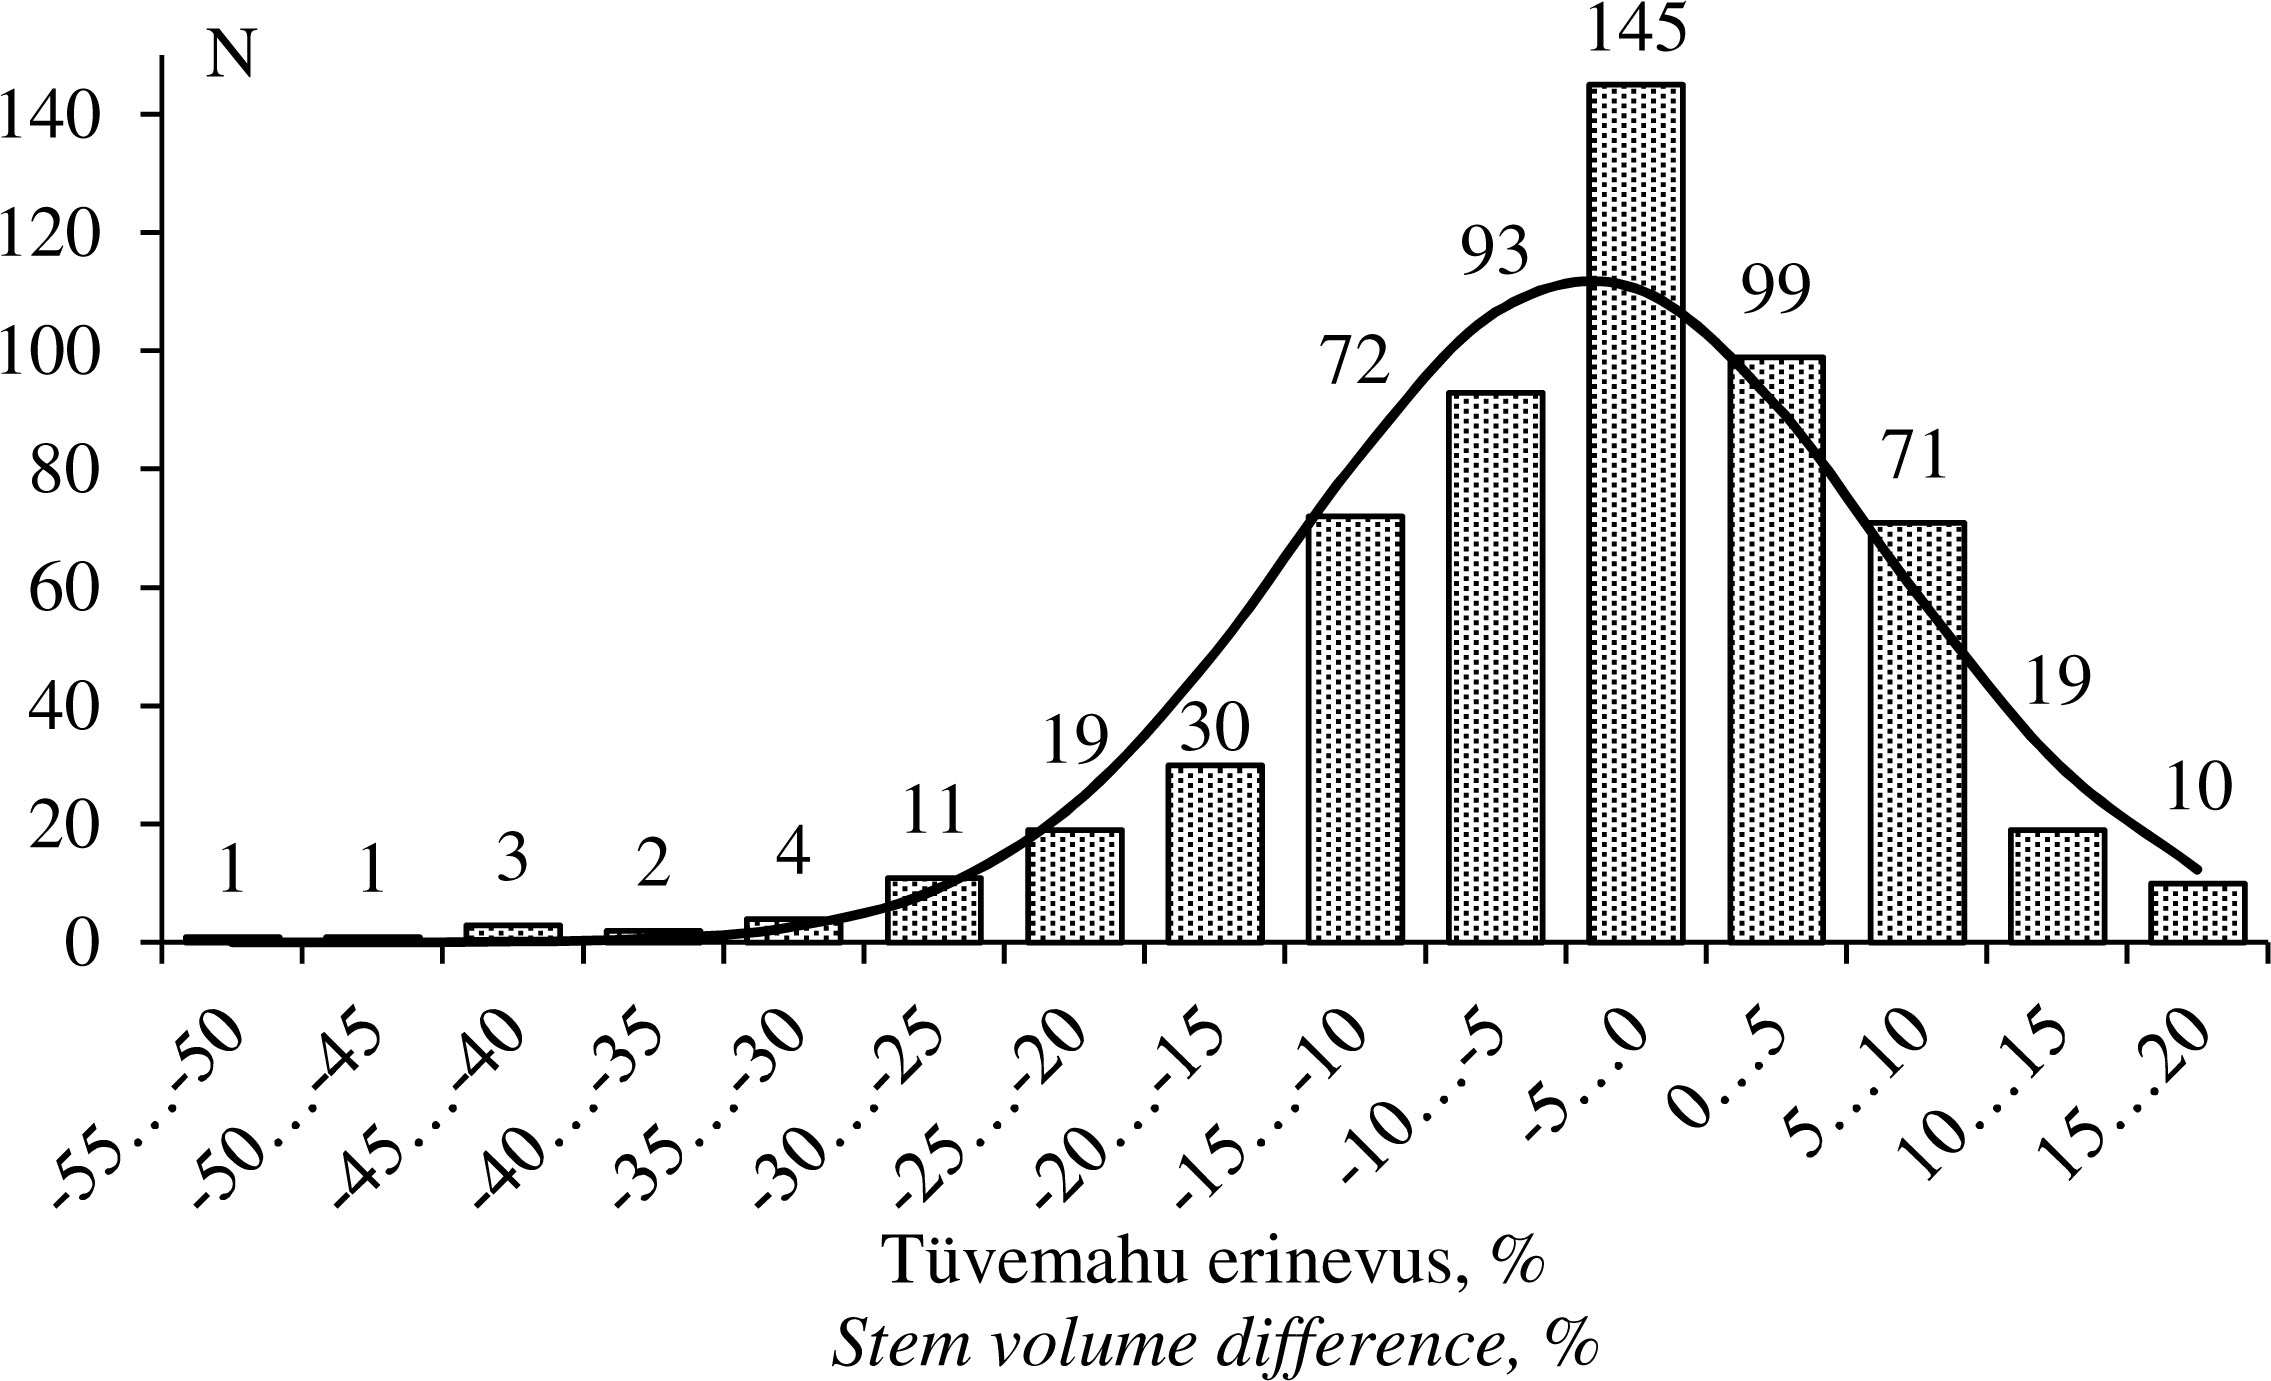
Joonis 2
Lisadiameetriga korrigeeritud ja korrigeerimata Ozolinši tüvemoodustajaga arvutatud mahtude erinevuste jaotumine koos normaaljaotuse tihedusfunktsiooniga.
Figure 2. Histogram showing the volume difference calculated by Ozolinš taper curve with and without additional measured diameter with normal distribution.
Tabel 4
Ozolinši tüvemoodustaja valemi korrigeeritud konstantide näitajad.
Table 4. Statistics of corrected constants of Ozolinš’ taper curve.
| Näitaja Statistic | Tüvemoodustaja konstant Coefficient of taper curve | ||
|---|---|---|---|
| a0 | a1 | a2 | |
| Aritmeetiline keskmine Mean | 119,956 | −290,472 | 1152,444 |
| Standardhälve Standard deviation | 2,507 | 32,547 | 30,180 |
| 95% alumine usalduspiir 95% lower confidence level | 119,752 | −293,127 | 1149,983 |
| 95% ülemine usalduspiir 95% upper confidence level | 120,161 | −287,818 | 1154,905 |
| Minimaalne hinnang Minimum | 112,075 | −417,560 | 1073,181 |
| Maksimaalne hinnang Maximum | 139,511 | −205,963 | 1271,758 |
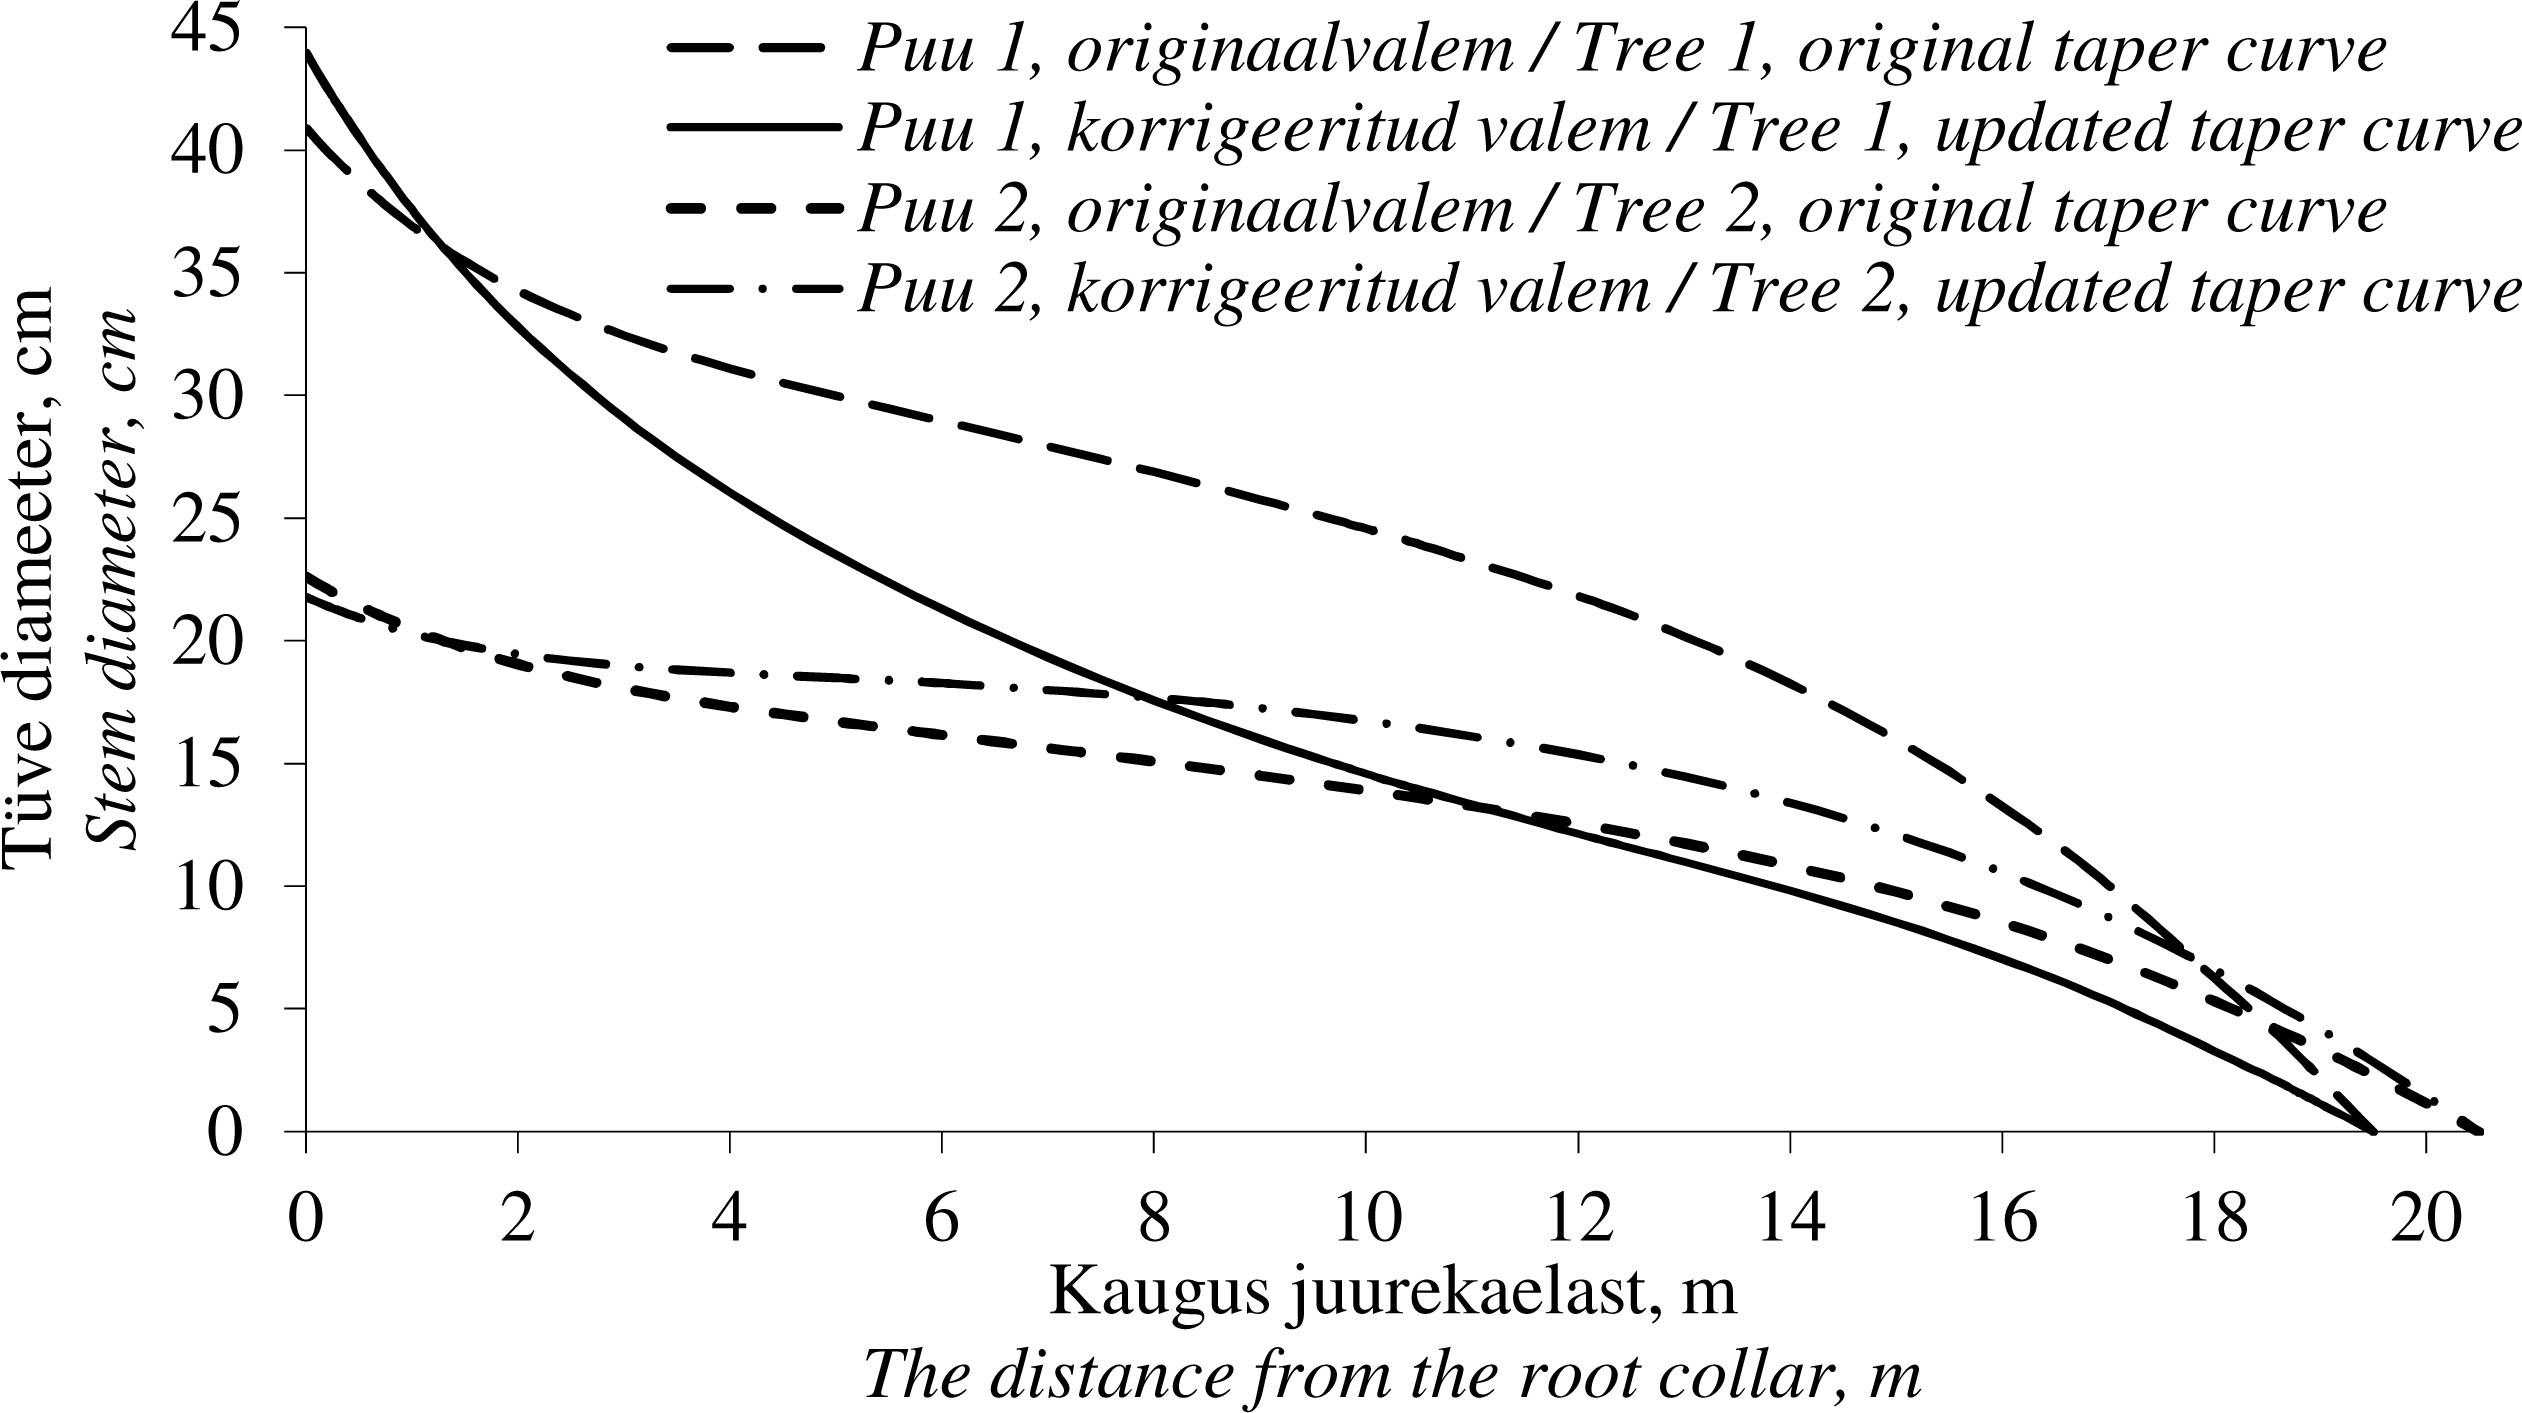
Joonis 3
Näide kahe puu korrigeerimata ja korrigeeritud tüvemoodustajatest.
Figure 3. An example of taper curves of two trees with and without correction.
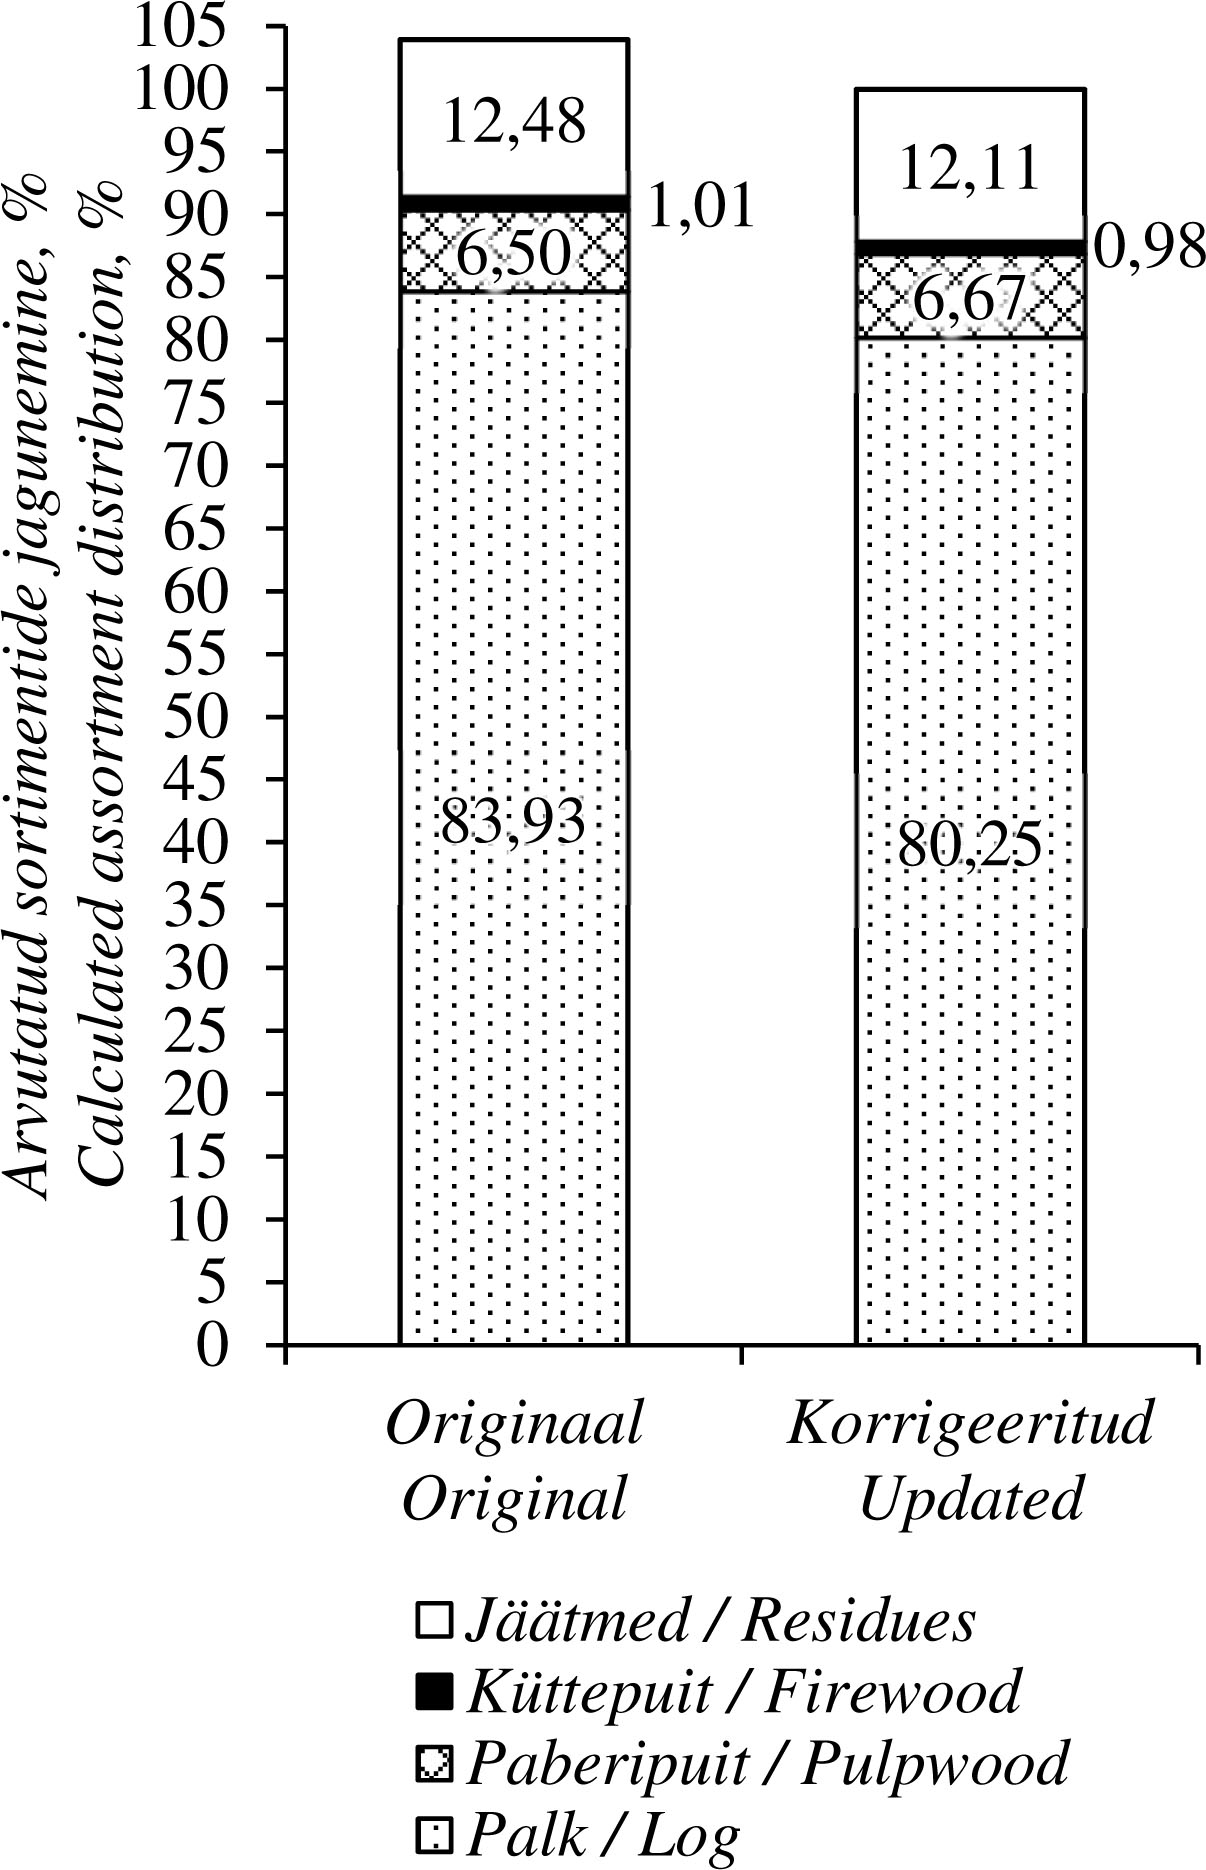
Joonis 4
Lisadiameetriga korrigeeritud ja korrigeerimata Ozolinši tüvemoodustajaga arvutatud sortimentide teoreetilised väljatulekud (100% on korrigeeritud mudeliga arvutatud).
Figure 4. Assortment distribution calculated by Ozolinš’ taper curve with and without additional measured diameter (100% is with additional diameter).
Tabel 5
Kahe erineva tüvemoodustajaga arvutatud mändide sortimentide väljatuleku võrdlemine.
Table 5. Comparison of the yield of pine assortments calculated with two different stem taper curves.
| Sortiment Assortment | Tüvemoodustaja Taper curve | Absoluutne erinevus Absolute difference | Suhteline erinevus Relative difference | |
|---|---|---|---|---|
| Originaal Original | Korrigeeritud Updated | |||
| Palk, % Log, % | 80,77 | 80,25 | −0,52 | −0,65 |
| Paberipuit, % Pulpwood, % | 6,25 | 6,67 | 0,42 | 6,24 |
| Küttepuit, % Firewood, % | 0,97 | 0,98 | 0,00 | 0,40 |
| Jäätmed % Residues % | 12,01 | 12,11 | 0,10 | 0,83 |
| Kokku, % Total, % | 100,00 | 100,00 | 0,00 | 0,00 |