
Introduction
Financial planning is increasingly defined not only by technical expertise and portfolio outcomes, but also by the quality of the service experience clients receive (Anderson et al., 2022). As technological innovations, including robo-advising and artificial intelligence, continue to reshape the delivery of financial services, financial planners are under increasing pressure to demonstrate value in ways that extend beyond investment performance alone (Fortin et al., 2020). In this environment, the planner-client relationship itself becomes more central, particularly as planners seek to retain clients, foster trust, and differentiate their services in a competitive marketplace.
Understanding what clients value in their financial planners is not a peripheral concern, but a critical issue for both practice and research. Client retention is important in financial planning because maintaining existing clients is often more efficient and less costly than acquiring new ones (McCoy et al., 2022). When clients perceive their planning services as a high-quality service, they may be more likely to remain committed to the relationship and recommend their planner to others, making service quality relevant to both relationship maintenance and business development (Adil et al., 2013). Yet, despite the centrality of client satisfaction to the profession, it remains unclear whether planners and clients define high-quality service in the same way.
This question is particularly important because prior research suggests that what clients say they value and what planners believe clients value may not fully align. For example, Murphy et al. (2020) found that investors emphasised traditional adviser functions, such as goal attainment and investment outcomes, while placing less value on behavioural coaching and other interpersonal aspects of advice, even though the benefits investors perceive may center more on security, peace of mind, and understanding their financial situation. This pattern suggests that planners may not always have a precise understanding of the attributes clients use to evaluate service quality. If so, planners may unintentionally rely on their own assumptions when emphasising certain aspects of service delivery, even when those assumptions do not fully reflect the client perspective.
Although service quality has been studied extensively across industries, including retail, hospitality, health, telecommunications, and education, far less is known about how it operates in the context of financial planning. To address this gap, the present study draws on the well-established Service Quality Model, commonly known as SERVQUAL (Parasuraman et al., 1985), to examine whether clients and financial planners assign similar importance to key dimensions of service quality. In the present study, these dimensions include relational characteristics of the planner, such as responsiveness, assurance, empathy, and reliability, as well as the tangible aspect of service delivery through meeting format.
To gain deeper insight into the attributes planners and clients value, our research aims to address the following question: How do planners and clients understand and evaluate the financial planner-client relationship, including valued relational qualities, perceptions of virtual meeting productivity, and preferences for meeting format? This question is important because service quality in financial planning is inherently relational, yet little research has directly compared how clients and planners perceive the attributes that shape that relationship. Drawing on the SERVQUAL framework (Parasuraman et al., 1985), which has been widely used in other service contexts but rarely applied in financial planning, this study examines how key dimensions of service quality are understood within the planner-client relationship. It also compares clients' evaluations with planners' expectations, to assess whether these perspectives align or diverge in meaningful ways. The present study also extends this question to the format through which financial planning services are delivered. While the inherent qualities of a planner's services should, in principle, remain central to client satisfaction regardless of whether meetings occur in person or virtually, prior research suggests that meeting format may shape the nature of the service experience (Rollins-Koons et al., 2025). For example, virtual meetings tend to be more task-focused, whereas in-person meetings tend to allow more space for relationship-building activities (Archuleta et al., 2021). This raises the possibility that preferences for meeting format may be linked to the service qualities clients value most, making meeting delivery an important and timely dimension of perceived service quality.
Literature Review
Dynamics between clients and their financial professionals have been studied quite extensively outside of the U.S., and trust has been consistently identified as an important factor in building strong, sustainable financial planning relationships (Eriksson et al., 2020; Hunt et al., 2011; Van Tonder, 2016). Australian scholars Hunt and colleagues (2011) found that financial planners underestimate the importance of trust for clients while overestimating the level of client trust they believe their clients place in them. Emotional considerations have also been examined. An Italian dyadic study examining relationships between clients and their financial professionals found that professionals were able to understand their clients' emotional associations with money, despite no formal psychological training (Lozza et al., 2022). This ability was also noted to be associated with higher quality client-advisor relationships.
Relationship-oriented service models have been studied in the financial services domain to understand attributes associated with customer loyalty. For example, research focused on the Swedish banking sector found attributes such as trust to be central to revenue generation (Eriksson et al., 2020). Further, Eriksson and his colleagues (2020) argued that this means that an advisor's competence is highly relevant to the likelihood that the client follows the advice given. Zaleskiewicz and Gasiorowska (2021) conducted a cross-cultural study showing that when financial advice aligned with the client's existing beliefs, clients were more likely to assign greater weight to the professional's advice or defer to their judgment. Interestingly, a Canadian study found that non-technical attributes, such as the professional's use of humor, had a positive impact on clients' perceptions of service quality, trust, satisfaction, and likelihood of referrals (Bergeron, 2008).
Although largely based on earlier studies, empirical research using U.S. samples consistently finds that trust and commitment in financial planner–client relationships are primarily driven by communication quality and the advisor's ability to understand clients' values and circumstances (Anderson & Sharpe, 2008; Christiansen & DeVaney, 1998;). Studies using both client and planner data further demonstrate that specific communication behaviours, such as active listening and clarity, are strongly associated with higher levels of trust and relationship commitment (Cheng, 2017; McCoy et al., 2022). Earlier research using U.S. samples has also explored the relationship between communication tasks outlined in the CFP Board's Financial Planning Practice Standards and client outcomes. Anderson and Sharpe (2008) found these practices to be positively related to client trust and commitment, while also promoting client retention and referrals. The current study extends this body of knowledge by examining the relationship between financial planners and their clients in the U.S. through the lens of the SERVQUAL theory.
SERVQUAL Theory
Effective measurement and understanding of service quality are fundamental to enhancing client satisfaction and fostering long-term client commitment in the realm of financial planning as it is closely related to client satisfaction (for a review, please see Oh & Kim, 2017). A widely recognised framework for evaluating clients' perceptions of quality and satisfaction is the SERVQUAL model, developed by Parasuraman et al. (1985). SERVQUAL was built on the idea that service quality could be evaluated by comparing clients' perceptions of service performance with their expectations. SERVQUAL has since become one of the most extensively applied approaches for examining perceived service quality across industries, including retail, hospitality, information technology, telecommunications, travel, healthcare, and education (Lovelock & Patterson, 2015). However, the authors are aware that there is a lack of empirical research investigating the application of SERVQUAL in the financial planning profession, with the exception of a thesis from Singapore (Ben, 2018). This gap persists despite the presence of studies having been conducted in closely related fields such as insurance, banking, accounting, and finance (e.g., Fleischman et al., 2017; Lotko et al., 2017; Siddiqui & Sharma, 2010).
SERVQUAL (Parasuraman et al., 1985) posits that perceived value and perceived quality are important for understanding client satisfaction (Ben, 2018). Perceived value can be defined as clients' assessment of the benefits of seeing a planner compared to the cost, time, and effort involved. Meanwhile, perceived quality refers to the perceptions of service quality based on five areas: responsiveness, assurance, empathy, reliability, and tangibles (Parasuraman et al., 1985). Both perceived value and perceived quality have been found to have a direct relationship with customer satisfaction (Ben, 2018), but our study focuses on perceived quality only, which is a limitation explored later in the study.
As suggested in the SERVQUAL theory, responsiveness is defined as the ability of a practitioner to identify and address the needs and requests of their clients in a timely and efficient manner (Parasuraman et al., 1985). Not only does responsiveness require speed, but also an understanding of the client's perspective, a willingness to be proactive in anticipating potential issues, and a commitment to providing high-quality service. Assurance refers to the level of trust and confidence that clients have in their practitioners (Parasuraman et al., 1985). Clients need to be confident that their practitioners have the necessary technical expertise to help them in achieving their desired outcomes. Empathy is defined as the ability of practitioners to show genuine care and concern during client interactions (Parasuraman et al., 1985). This construct is often measured as both attentive listening skills and their demonstration of genuine care and interest in each client's personal circumstances. Reliability refers to how consistently the organisation delivers its products or services on time, as described, and without errors (Parasuraman et al., 1985). Reliability is the delivery of service as promised (Lassar et al., 2000). Practitioners exhibiting reliability will also make appropriate referrals if something is outside their scope of practice.
The final SERVQUAL construct is slightly different than the first four listed. The first four SERVQUAL attributes predominantly focused on the personal attributes of the practitioner (their reliability, expertise, promptness, listening skills, level of empathy, and so on), while the fifth attribute, tangibles, focuses on aspects outside the planner-client relationship. More specifically, the construct referred to as tangibles was originally defined as the visual aesthetics and physical appearance of the company, including its logo, store design, and equipment (Parasuraman et al., 1985). However, over the past 10 years, there has been a rise in the focus on the tangibility of companies' virtual footprints. This expanded the definition of tangibles to include aspects such as websites, online meeting platforms, and online client meetings (Palese & Usai, 2018; Top & Ali, 2021). In the current study, tangibles are examined by comparing clients' and planners' perspectives on virtual and in-person meetings.
Relational SERVQUAL Characteristics (Responsiveness, Assurance, Empathy, Reliability)
Financial planning research has found some support for the concepts of responsiveness, assurance, empathy, and reliability, which are key to how clients rate their satisfaction with their planner. Keller (2021) highlighted the findings from their annual study of CFP® professionals' clients. The CFP® mark indicates a financial planner has met high standards in education, ethics and experience. In the study, clients reported that responsiveness was a key differential between satisfied and unsatisfied clients. Keller (2021) also found that proactive communication and responsiveness are key to exceptional service and that clients who were satisfied with their planners stated that their planners got back to us quickly and fully answered our questions and concerns. However, Kitces and Richards (2023) argue that too much communication may seem impersonal or increase client stress levels, so it is only through finding the optimal balance between proactive communication and availability that clients will see value.
Assurance refers to the level of trust and confidence clients have in their planner's technical expertise to help them reach their financial goals (Parasuraman et al., 1985). Reiter et al. (2022) explain that trust is essential and that “financial planners may face productivity challenges if fostering trust becomes an issue in initiating and maintaining client relationships, limiting career growth and retention” (p. 1). However, defining trust is rather difficult. Cull and Sloan (2016) provided a thorough review of the diverse definitions of over 35 different definitions of trust due to its multidimensional nature. They integrated that prior literature into the definition of trust as being “the expectation that the adviser (trustee) can be relied on to act honestly, competently and in the best interests of the client (trustor) and thereby reduce the trustor's risk of loss” (Cull, 2015, p. 10). In this study, we posited that in the context of financial planning services, assurance could be established through financial planners' knowledge, expertise, and professionalism. Nonetheless, the degree to which this attribute is valued may not be consistent among clients and planners.
Empathy also appears to be a term of rising popularity within the financial planning profession. The Psychology of Financial Planning book by the CFP Board lists empathy numerous times in the index (Chatterjee et al., 2022). Perhaps empathy is a key factor in service quality and client satisfaction in the financial planning profession. A handful of studies suggest that empathy plays a key role in planner-client relationships (Grable et al., 2021; Tharp et al., 2021). Financial planners who exhibit empathy, listening skills, and an understanding of the client's fears and desires are better positioned to develop committed relationships with their clients (Grable & Goetz, 2017). However, it is important to note that empathy is not without its challenges. Financial planners who are highly empathetic may be more at risk of burnout, thus a balanced approach may be needed (Miller & Koesten, 2008; Tharp et al., 2021).
Finally, reliability in the financial planner-client relationship is key. Murphy et al. (2020) found that the planning client's ability to get a hold of their advisor was an important variable that they valued, but that clients rated this characteristic as less important than their planners rated it. Interestingly, a financial research platform surveyed 650 financial planning clients and discovered that they felt like their planner did not reach out to them enough, that the communication was not personalised enough, and most astoundingly they reported that the timing and personalisation of their advisors' communication directly impacted their confidence in their financial plan, their likelihood of retaining their advisor, and their willingness to refer their advisor to family and friends (Ycharts.com, 2019).
Drawing on the SERVQUAL framework, this study examines whether the importance assigned to service provider attributes differs between clients and financial planners. Particular attention is given to whether planners may overestimate the importance of certain attributes relative to clients, which has implications for how service improvements are prioritised. Consistent with this perspective, the analysis focuses on the relational dimensions of service quality and how these vary between clients and planners.
H1: Individuals in the client group exhibit lower perceived importance of relational SERVQUAL characteristics.
Virtual versus In-Person Meetings in Planning (Tangibles)
Financial planning is inherently a people-focused service, yet the tangible elements of both virtual and in-person meetings, along with their perceived productivity, may affect client perceptions and satisfaction with the service. Prior research suggests that the delivery format of financial planning could influence the effectiveness of client engagement and satisfaction (Collier et al., 2024; Fox & Bartholomae, 2020; Hanna, 2012). This is because the mode of interaction may either enhance or hinder the development of trust and understanding, which are crucial in the financial planner-client relationship. For example, some studies posited that virtual financial planning can be beneficial for clients as it can decrease costs, reduce dropout, and allow planners to meet with clients who are not in their geographic vicinity (Fox & Bartholomae, 2020; Sensenig et al., 2020). However, McCoy et al. (2024) found that some planners reported challenges with reading non-verbal cues in virtual client meetings and another study found that some planners had client attrition and difficulty connecting with their clients online (Fox & Bartholomae, 2020). Furthermore, both clients and planners may have a heightened focus on tasks while utilising videoconferencing in these virtual client meetings, reducing the focus on relationship building that has been found to facilitate trust (Archuleta et al., 2021; McCoy et al., 2022). Research also suggests that providing clients the choice of meeting in-person or virtually may be an important component in determining whether clients experience satisfaction with their planners (Hanna, 2012). Despite both planners and clients often favoring in-person meetings, a surprising study by McCoy et al. (2024) revealed that less than half of clients are even given the choice of meeting venue. Taken together, clients may evaluate virtual meeting productivity differently than planners relative to in-person interactions, while the strength of relational service attributes may shape preferences for virtual, hybrid, or in-person engagement.
H2: Individuals in the client group exhibit a lower level of agreement that virtual financial planning meetings are as productive as in-person meetings.
H3: Higher levels of relational SERVQUAL attributes are associated with a lower likelihood of preferring hybrid meetings or virtual meetings over in-person meetings.
Methodology
Data
The study used 2021 Developing and Maintaining Client Trust and Commitment in a Rapidly Changing Environments survey data. The dataset was initiated by MQ Research & Education™, a nonprofit focused on providing an evidence-based approach to financial planning. MQ Research and EducationTM partnered with the faculty of Kansas State University's Personal Financial Planning department and received sponsorship from the Financial Planning Association® (FPA), with generous support provided by Allianz Life Insurance Company of North America (Allianz Life). The data included detailed information from distinct survey questions covering areas such as virtual meeting navigation, client financial anxiety levels, and matters related to diversity, inclusion, and cultural awareness, and were collected from June 26 to July 20, 2021. The dataset for this survey comprises both planner data and client data. The study was designed to maintain anonymity by refraining from collecting any personally identifiable information. The collection of planner data involved sending an email to a randomly selected group of FPA members, containing a link to an internet-based survey. The collection of client data was made possible by requesting planners who completed the planner survey to invite at least 5 but up to 15 of their clients to participate in this research's client component. Incentives were only provided to the initial 340 clients who completed the survey, resulting in a convenience sample of 429 clients. Two-sample tests of proportions were conducted using data from 424 clients and 313 planners who provided valid responses on both relational and tangible SERVQUAL factors. For the seemingly unrelated regression (SUR) analysis, the sample consisted of 749 observations. The number of observations used in the seemingly unrelated regression analysis was larger than that in descriptive or bivariate analyses. This difference arises because the seemingly unrelated regression model included only the relational SERVQUAL factors and their associated predictors, and no additional restrictions were imposed. The tangible SERVQUAL factor was excluded from the seemingly unrelated regression model due to its differing response format, which was not directly comparable to the relational factors.
Sample
The sample demographics showed that clients had an average age of 36.554, while planners had a substantially older average age of 45.636 (t = −10.769, p = 0.001). The proportion of males was significantly higher in the planner group than in the client group (z = −2.870, p = 0.002), as 46.46% of clients were female compared to only 35.90% of planners. A significantly higher percentage of planners (91.37%) have a postsecondary degree compared to clients (70.28%, z = 6.978, p = 0.001). Additionally, a greater proportion of planners (40.13%) earn over $250,000 annually compared to clients (3.30%, z = −12.595, p = 0.001). There were no statistically significant differences between clients and planners in terms of marital status (83.25% of clients and 80.13% of planners were married) or race (84.67% of clients and 86.58% of planners were White). The number of observations varies slightly across variables due to item nonresponse or missing data, particularly for sensitive questions such as income. This variation is expected in survey-based research and was handled using pairwise deletion for descriptive comparisons. See Table 1.
Table 1.
Descriptive statistics
| Obs. | %/Mean | Std. dev. | Min | Max | Obs. | %/Mean | Std. dev. | Min | Max | Diff Sig. | |
|---|---|---|---|---|---|---|---|---|---|---|---|
| Responsiveness | |||||||||||
| Personability | 424 | 45.99% | 313 | 74.44% | *** | ||||||
| Personability | 424 | 3.373 | 0.858 | 1 | 5 | 313 | 3.962 | 0.850 | 1 | 5 | *** |
| Friendly services | 424 | 52.83% | 313 | 84.66% | *** | ||||||
| Friendly services | 424 | 3.415 | 0.998 | 1 | 5 | 313 | 4.339 | 0.851 | 1 | 5 | *** |
| Promptness in responding | 424 | 40.80% | 313 | 84.66% | *** | ||||||
| Promptness in responding | 424 | 3.285 | 0.987 | 1 | 5 | 313 | 4.351 | 0.791 | 1 | 5 | *** |
| Assurance | |||||||||||
| Knowledge and expertise | 424 | 42.22% | 313 | 78.91% | *** | ||||||
| Knowledge and expertise | 424 | 3.182 | 1.118 | 1 | 5 | 313 | 4.089 | 0.831 | 1 | 5 | *** |
| Empathy | |||||||||||
| Attentive listening | 424 | 27.59% | 313 | 84.03% | *** | ||||||
| Attentive listening | 424 | 2.974 | 1.062 | 1 | 5 | 313 | 4.406 | 0.967 | 1 | 5 | *** |
| Care and interest | 424 | 41.27% | 313 | 85.94% | *** | ||||||
| Care and interest | 424 | 3.113 | 1.116 | 1 | 5 | 313 | 4.447 | 0.835 | 1 | 5 | *** |
| Reliability | |||||||||||
| Help decision-making | 424 | 61.08% | 313 | 87.86% | *** | ||||||
| Help decision-making | 424 | 3.594 | 0.923 | 1 | 5 | 313 | 4.358 | 0.788 | 1 | 5 | *** |
| Quality investment | 424 | 39.39% | 313 | 65.81% | *** | ||||||
| Quality investment | 424 | 3.200 | 1.034 | 1 | 5 | 313 | 3.840 | 0.913 | 1 | 5 | *** |
| Tangible | |||||||||||
| Virtual meeting productivity | 424 | 53.07% | 313 | 73.80% | *** | ||||||
| 424 | 3.481 | 0.833 | 1 | 5 | 313 | 3.859 | 1.031 | 1 | 5 | *** | |
| Demographic | |||||||||||
| Age | 424 | 36.554 | 9.118 | 22 | 74 | 313 | 45.636 | 13.762 | 21 | 81 | *** |
| Age categories | 313 | ||||||||||
| Age 21 to 30 | 424 | 26.42% | 313 | 13.74% | *** | ||||||
| Age 31 to 40 | 424 | 51.65% | 313 | 30.35% | *** | ||||||
| Age 41 to 50 | 424 | 15.09% | 313 | 20.77% | * | ||||||
| Age 50 and above | 424 | 6.84% | 313 | 35.14% | *** | ||||||
| Female | 424 | 46.46% | 312 | 35.90% | ** | ||||||
| Married | 424 | 83.25% | 312 | 80.13% | |||||||
| White | 424 | 84.67% | 313 | 86.58% | |||||||
| Degree holder | 424 | 70.28% | 313 | 91.37% | *** | ||||||
| Income level | |||||||||||
| less than $100,000 | 424 | 27.12% | 309 | 13.59% | *** | ||||||
| $100,000 – $150,000 | 424 | 50.24% | 309 | 23.95% | *** | ||||||
| $150,000 – $250,000 | 424 | 19.34% | 309 | 22.33% | *** | ||||||
| higher than $250,000 | 424 | 3.30% | 309 | 40.13% | *** |
Variables
Relational SERVQUAL factors
The participants of the client and planner survey were asked to rate the level of importance of factors in committing to a long-term financial planning relationship with the planner. Specifically, the clients provided ratings regarding the significance of certain factors they valued in their financial planners. Meanwhile, the financial planners offered evaluations about the factors they believed to be important to their clients. Possible responses included Not at all important, Slightly important, Moderately important, Very important, and Extremely important. The eight-factor statements used in this study concentrated on the personal qualities and communication skills of financial planners in addition to their financial expertise and assistance. Specifically, in relation to the SERVQUAL factors, the responsiveness factor was assessed through financial planners' personability, courteous and friendly service delivery, and promptness in responding to requests. The assurance factor was measured by financial planners' high level of financial knowledge and expertise. The empathy factor focused on attentive listening and demonstration of genuine care and interest in clients' personal circumstances. Lastly, the reliability factor was evaluated through financial planners' assistance in making sound financial decisions and the provision of quality investment advice. Responses were coded using two approaches: the binary scale and the Likert scale. For the binary coding, responses were coded as 1 if the client answered, Very important or Extremely important and 0 otherwise. In addition to the internal (responsiveness, assurance, empathy, and reliability) qualities appreciated by clients, the external tangible aspects through the productivity of virtual meetings were assessed. Additionally, the SERVQUAL factors were assigned Likert scale values for regression analysis, ranging from 1, indicating Not at all important, to 5, indicating Extremely important.
Tangible SERVQUAL factor - Virtual meeting productivity
A binary coded variable was created to measure the level of agreement among clients and financial planners regarding the statement: Virtual financial planning meetings can be as productive as in-person meetings. The response options provided were Strongly agree, Somewhat agree, Neither disagree nor agree, Somewhat disagree and Strongly disagree. The variable was coded as 1 to indicate a clearly positive view towards the effectiveness of virtual meetings, and as 0 for all neutral or negative responses. In the regression analysis, responses regarding the productivity of virtual meetings were quantified using a Likert scale, where 1 corresponded to Strongly disagree and 5 to Strongly agree.
Meeting format preference
Only the client's survey included a specific question regarding their preferred method of meeting with their financial planner after any restrictions on in-person meetings are completely lifted. The available options were: A combination of both in-person and virtual, In-person meetings, and Virtual meetings.
Analysis
To answer H1, we began by preparing a descriptive summary of clients and planners to demonstrate the sample's characteristics (please see Table 1), followed by identifying significant differences between the clients' and planners' samples. Given the dichotomous coding of the SERVQUAL factors, two-sample tests of proportions were conducted as an exploratory step in this study, with a two-sample t-test used to verify robustness. Our goal was to identify differences in the ratings of the eight relational attribute factors within both the client and planner groups.
Next, a seemingly unrelated regression (SUR) analysis of the SERVQUAL factors was conducted to thoroughly explore how group distinctions (clients versus financial planners) and various socio-demographic variables impact perceptions of importance attributed to relational SERVQUAL factors. SUR can be understood as a method that estimates multiple related regression models simultaneously rather than separately. Each SERVQUAL factor is treated as a distinct outcome, but these outcomes are likely interconnected. For instance, individuals who place high importance on one relational attribute may also value others, leading to correlations across the unobserved components of these models. By estimating the equations jointly, SUR accounts for these correlations in the error terms, which improves the efficiency and reliability of the estimates compared to running separate regressions. In addition, this approach allows the same set of explanatory variables, including the client group indicator and socio-demographic factors, to be evaluated consistently across all SERVQUAL factors. This makes SUR particularly well-suited for this study, as it captures the multidimensional nature of relationship quality while providing a more comprehensive assessment of how different groups perceive its key attributes.
Where Yki denotes the relational SERVQUAL factors, Zi is the vector of demographic controls, and the error terms are allowed to be correlated across equations.Then, a separate OLS regression was performed on the tangible SERVQUAL factor to validate H2, examining whether clients who view virtual meetings as equally productive as in-person meetings differ from the perspective of financial planners.
Where Zi is a vector of control variablesFinally, for a comprehensive understanding of how SERVQUAL factors influence the choice of delivery format to test H3, a multinomial logistic regression analysis was conducted, examining the significance of these factors in determining preferences for the meeting format among clients, with the base outcome of in-person meeting setting.
Where Si is the vector of relational SERVQUAL factors, and Zi is a vector of control variables.Results
Table 1 summarises the demographic characteristics of both groups, including only respondents with valid SERVQUAL responses. In addition, the table reports the proportion of respondents who consider each SERVQUAL factor (responsiveness, assurance, empathy, and reliability) to be very or extremely important. It also presents the SERVQUAL factors separately for clients and financial planners, with mean values on a Likert scale from 1 to 5, providing a robustness check for the mean-based results.
Based on Table 1, clients and planners differed significantly across all relational SERVQUAL factors, as indicated by the two-sample tests of proportions and the two-sample t-test. Specifically, regarding the responsiveness components of the SERVQUAL model, it was found that approximately 45.99% of clients rated that their financial planner being personable was of high importance for them to commit to a long-term financial planning relationship, compared to a significantly higher 74.44% of planners assessed from the perspective of their clients. Using the z-test for proportions, the statistical significance of this observed difference was identified. The result of the test had a z-statistic of −7.737. Critically, the associated p-value for there is a disparity was less than 0.001, indicating that the proportional difference between clients and planners is statistically significant. Additionally, there was a significant disparity between the views of clients and planners regarding providing courteous and friendly services (52.83% clients, 84.66% planners, z = −9.041, p = 0.001), and responding promptly to clients' requests (40.80% clients, 84.67% planners, z = −11.987, p = 0.001) in responsiveness components. Following the same procedure, there is a statistically significant difference between clients (42.22%) and planners (78.91%) in the assurance component regarding the importance placed on being knowledgeable (z = −9.971, p = 0.001), with financial planners perceived a higher proportion of their clients valued it more. Similarly, significant proportional differences existed in the perceived importance of the empathy and reliability components of SERVQUAL model between clients and planners perceived importance on helping to make good financial decisions (61.08% clients, 87.86% planners, z = −8.043, p = 0.001), offering good investment advice (39.39% clients, 65.81% planners, z = −7.093, p = 0.001), listening to clients (27.59% clients, 84.03% planners, z = −15.152, p = 0.001), and showing genuine care and interest in each client's personal circumstance (41.27% clients, 85.94% planners, z = −12.248, p = 0.001). All two-sample t-tests based on the Likert-scale measures consistently indicate statistically significant differences between clients and planners, reinforcing the robustness of the observed group differences.
Preliminary proportion tests and t-tests listed above indicated significant differences, leading to more in-depth regression analyses. The SUR analysis was refined to include adjustments for control and group-indicating variables. This enhancement allowed for a more robust validation of whether the client's group rates relational SERVQUAL attributes significantly lower compared to the planner's group. Results are listed in Table 2. Clients consistently gave lower ratings to relational SERVQUAL attributes. More importantly, the largest negative coefficient for the client group variable was found in the empathy factor, which was assessed by the importance placed on planners showing genuine care and interest in each client's personal circumstances and attentively listening to them. Therefore, H1 was supported, as the client group was negatively associated with the perceived importance of relational SERVQUAL characteristics.
Table 2.
Results of seemingly unrelated regressions on SERVQUAL attributes
| Coefficient | Std. err. | z | P>z | ||
|---|---|---|---|---|---|
| Personability | |||||
| Client group | −0.383 | 0.070 | −5.46 | *** | |
| Age categories (ref: Age 50 and above) | |||||
| Age 21 to 30 | −0.445 | 0.107 | −4.18 | *** | |
| Age 31 to 40 | −0.114 | 0.093 | −1.23 | ||
| Age 41 to 50 | 0.010 | 0.102 | 0.09 | ||
| Female | 0.033 | 0.060 | 0.56 | ||
| Married | −0.120 | 0.082 | −1.47 | ||
| Whites | −0.185 | 0.086 | −2.14 | * | |
| No college degree | −0.352 | 0.076 | −4.62 | *** | |
| Income categories (ref: Income >$250,000) | |||||
| Less than $100K | 0.016 | 0.108 | 0.15 | ||
| Income $100K to $150K | −0.231 | 0.100 | −2.32 | * | |
| Income $150K to $250K | −0.178 | 0.103 | −1.73 | ||
| Intercept | 4.423 | 0.132 | 33.52 | *** | |
| R-squared = .192 | |||||
| Friendly services | |||||
| Client group | −0.633 | 0.077 | −8.26 | *** | |
| Age categories (ref: Age 50 and above) | |||||
| Age 21 to 30 | −0.605 | 0.116 | −5.20 | *** | |
| Age 31 to 40 | −0.569 | 0.101 | −5.62 | *** | |
| Age 41 to 50 | −0.165 | 0.112 | −1.48 | ||
| Female | −0.090 | 0.065 | −1.37 | ||
| Married | −0.207 | 0.089 | −2.33 | * | |
| Whites | −0.206 | 0.094 | −2.19 | * | |
| No college degree | −0.246 | 0.083 | −2.96 | ** | |
| Income categories (ref: Income >$250,000) | |||||
| Less than $100K | 0.068 | 0.117 | 0.58 | ||
| Income $100K to $150K | −0.161 | 0.109 | −1.48 | ||
| Income $150K to $250K | −0.061 | 0.112 | −0.54 | ||
| Intercept | 5.064 | 0.144 | 35.15 | *** | |
| R-squared = .274 | |||||
| Promptness in responding | |||||
| Client group | −0.670 | 0.076 | −8.79 | *** | |
| Age categories (ref: Age 50 and above) | |||||
| Age 21 to 30 | −0.567 | 0.116 | −4.90 | *** | |
| Age 31 to 40 | −0.624 | 0.101 | −6.19 | *** | |
| Age 41 to 50 | −0.339 | 0.111 | −3.05 | ** | |
| Female | −0.049 | 0.065 | −0.76 | ||
| Married | −0.125 | 0.089 | −1.41 | ||
| Whites | −0.104 | 0.094 | −1.11 | ||
| No college degree | −0.066 | 0.083 | −0.80 | ||
| Income categories (ref: Income >$250,000) | |||||
| Less than $100K | −0.283 | 0.117 | −2.43 | * | |
| Income $100K to $150K | −0.407 | 0.108 | −3.76 | *** | |
| Income $150K to $250K | −0.232 | 0.112 | −2.08 | * | |
| Intercept | 5.046 | 0.143 | 35.22 | *** | |
| R-squared = .301 | |||||
| Knowledge and expertise | |||||
| Client group | −0.668 | 0.085 | −7.90 | *** | |
| Age categories (ref: Age 50 and above) | |||||
| Age 21 to 30 | −0.546 | 0.128 | −4.26 | *** | |
| Age 31 to 40 | −0.565 | 0.112 | −5.06 | *** | |
| Age 41 to 50 | −0.251 | 0.123 | −2.04 | * | |
| Female | 0.049 | 0.072 | 0.67 | ||
| Married | −0.077 | 0.098 | −0.79 | ||
| Whites | −0.150 | 0.104 | −1.44 | ||
| No college degree | −0.161 | 0.092 | −1.76 | ||
| Income categories (ref: Income >$250,000) | |||||
| Less than $100K | 0.014 | 0.130 | 0.10 | ||
| Income $100K to $150K | −0.281 | 0.120 | −2.34 | * | |
| Income $150K to $250K | −0.066 | 0.124 | −0.53 | ||
| Intercept | 4.697 | 0.159 | 29.56 | *** | |
| R-squared = .236 | |||||
| Help decision-making | |||||
| Client group | −0.388 | 0.069 | −5.62 | *** | |
| Age categories (ref: Age 50 and above) | |||||
| Age 21 to 30 | −0.743 | 0.105 | −7.09 | *** | |
| Age 31 to 40 | −0.460 | 0.091 | −5.03 | *** | |
| Age 41 to 50 | −0.156 | 0.101 | −1.55 | ||
| Female | −0.058 | 0.059 | −0.98 | ||
| Married | −0.173 | 0.080 | −2.16 | * | |
| Whites | −0.203 | 0.085 | −2.39 | * | |
| No college degree | −0.206 | 0.075 | −2.75 | ** | |
| Income categories (ref: Income >$250,000) | |||||
| Less than $100K | −0.236 | 0.106 | −2.23 | * | |
| Income $100K to $150K | −0.415 | 0.098 | −4.23 | *** | |
| Income $150K to $250K | −0.128 | 0.101 | −1.27 | ||
| Intercept | 5.142 | 0.130 | 39.58 | *** | |
| R-squared = .280 | |||||
| Quality investment | |||||
| Client group | −0.378 | 0.082 | −4.61 | *** | |
| Age categories (ref: Age 50 and above) | |||||
| Age 21 to 30 | −0.893 | 0.125 | −7.16 | *** | |
| Age 31 to 40 | −0.584 | 0.108 | −5.38 | *** | |
| Age 41 to 50 | −0.356 | 0.120 | −2.97 | ** | |
| Female | −0.058 | 0.070 | −0.82 | ||
| Married | −0.128 | 0.095 | −1.34 | ||
| Whites | −0.252 | 0.101 | −2.49 | * | |
| No college degree | 0.041 | 0.089 | 0.46 | ||
| Income categories (ref: Income >$250,000) | |||||
| Less than $100K | 0.090 | 0.126 | 0.72 | ||
| Income $100K to $150K | −0.088 | 0.117 | −0.75 | ||
| Income $150K to $250K | 0.043 | 0.120 | 0.36 | ||
| Intercept | 4.521 | 0.154 | 29.31 | *** | |
| R-squared = .161 | |||||
| Attentive listening | |||||
| Client group | −0.786 | 0.079 | −9.92 | *** | |
| Age categories (ref: Age 50 and above) | |||||
| Age 21 to 30 | −1.016 | 0.120 | −8.45 | *** | |
| Age 31 to 40 | −0.866 | 0.105 | −8.27 | *** | |
| Age 41 to 50 | −0.423 | 0.116 | −3.67 | *** | |
| Female | −0.077 | 0.068 | −1.13 | ||
| Married | −0.288 | 0.092 | −3.13 | ** | |
| Whites | −0.179 | 0.097 | −1.84 | ||
| No college degree | −0.394 | 0.086 | −4.58 | *** | |
| Income categories (ref: Income >$250,000) | |||||
| Less than $100K | −0.435 | 0.121 | −3.58 | *** | |
| Income $100K to $150K | −0.640 | 0.113 | −5.69 | *** | |
| Income $150K to $250K | −0.361 | 0.116 | −3.11 | ** | |
| Intercept | 5.594 | 0.149 | 37.56 | *** | |
| R-squared = .459 | |||||
| Care and interest | |||||
| Client group | −0.973 | 0.080 | −12.21 | *** | |
| Age categories (ref: Age 50 and above) | |||||
| Age 21 to 30 | −0.894 | 0.121 | −7.39 | *** | |
| Age 31 to 40 | −0.749 | 0.105 | −7.11 | *** | |
| Age 41 to 50 | −0.254 | 0.116 | −2.19 | * | |
| Female | −0.004 | 0.068 | −0.05 | ||
| Married | −0.180 | 0.093 | −1.94 | ||
| Whites | −0.159 | 0.098 | −1.62 | ||
| No college degree | −0.320 | 0.087 | −3.70 | *** | |
| Income categories (ref: Income >$250,000) | |||||
| Less than $100K | 0.070 | 0.122 | 0.57 | ||
| Income $100K to $150K | −0.314 | 0.113 | −2.77 | ** | |
| Income $150K to $250K | −0.093 | 0.117 | −0.79 | ||
| Intercept | 5.281 | 0.150 | 35.24 | *** | |
| R-squared = .425 | |||||
The responsiveness factor encompasses personability, friendly services, and promptness in responding. The assurance factor covers knowledge and expertise, while the reliability factor involves help with decision-making and quality investment. The empathy factor includes attentive listening, as well as care and interest.
As for socio-demographic factors, younger individuals, particularly those under 50, also rated all relational SERVQUAL attributes lower than those aged 50 and above. White respondents, individuals without a college degree, and those earning between $100,000 and $150,000 rated the importance of a financial planner being personable, lower. Married individuals, White respondents, and those without a college degree also gave lower ratings to the importance of financial planners being friendly. Those earning less than $250,000 assigned lower importance to financial planners responding promptly to clients' requests. Specifically, individuals earning between $100,000 and $150,000, compared to those earning over $250,000, rated the importance of financial planners being knowledgeable, lower. Married individuals, those without a college degree, and those earning less than $150,000, compared to those earning $250,000 or more, rated the importance of financial planners helping to make good financial decisions, lower. White respondents rated the importance of offering good investment advice lower, while White respondents, those without a college degree, and those earning less than $250,000 also rated the importance of listening to clients lower. Finally, individuals without a college degree and those earning between $100,000 and $150,000, compared to their reference group, rated the importance of financial planners showing genuine care and interest in each client's personal circumstances lower. These findings highlight significant demographic variations in the perceived importance of key relational SERVQUAL attributes in financial planning services.
As for tangible components, a substantial majority of planners (73.80%) consider virtual meetings to be as productive as in-person meetings. However, only half of the clients (53.07%) share this belief (z = −5.729, p = 0.001). After adjusting for control and group-indicating variables in the OLS regression analysis, it emerged that clients consistently rated virtual meetings as significantly less productive than in-person meetings compared to financial planners. Further analysis also revealed that individuals without a postsecondary degree were less likely than degree holders to perceive virtual meetings as equally productive as in-person meetings.
Therefore, H2 is supported, as client status is negatively associated with agreement that virtual meetings can be as productive as in-person meetings.
Regarding the delivery method for financial planning, as shown in Table 4, the variables of personability (RRR = .304, p = 0.000), friendly services (RRR = 2.312, p = 0.004), knowledge and expertise (RRR = 1.928, p = 0.029), and attentive listening (RRR = 2.274, p = 0.024) had significant effects on the preference for hybrid meetings over in-person meetings among clients. Conversely, no significant factors emerged when examining preferences for exclusively virtual meetings over strictly in-person engagement. Surprisingly, the absence of a degree among clients shows a significant association with a preference for hybrid (RRR = 2.810, p = 0.001) and virtual (RRR = 3.404, p = 0.000) meeting formats over in-person meetings. Clients with an income ranging from $100,000 to $150,000 (RRR = 0.080, p = 0.025) showed a lower likelihood of favoring virtual meetings as opposed to in-person meetings when compared to those earning over $250,000. Therefore, H3 was partially supported, with higher levels of assurance (knowledge and expertise) and empathy (attentive listening) SERVQUAL attributes are associated with a lower likelihood of preferring hybrid meetings over in-person meetings. Responsiveness (personability and friendly services) SERVQUAL attributes yield mixed results on the preferred delivery method for financial planning.
Table 3.
Results of OLS regression on viewing virtual meetings being equally productive as in-person meetings
| Coefficient | Std. err. | t | P>t | |
|---|---|---|---|---|
| Client group | −0.248 | 0.081 | −3.05 | *** |
| Age categories (ref: Age 50 and above) | ||||
| Age 21 to 30 | −0.159 | 0.119 | −1.33 | |
| Age 31 to 40 | −0.182 | 0.104 | −1.75 | |
| Age 41 to 50 | −0.035 | 0.115 | −0.31 | |
| Female | 0.087 | 0.069 | 1.27 | |
| Married | −0.041 | 0.092 | −0.45 | |
| Whites | −0.168 | 0.098 | −1.73 | |
| No college degree | −0.208 | 0.087 | −2.38 | * |
| Income categories (ref: Income >$250,000) | ||||
| Less than $100K | 0.001 | 0.125 | 0.01 | |
| Income $100K to $150K | −0.063 | 0.112 | −0.56 | |
| Income $150K to $250K | 0.112 | 0.115 | 0.97 | |
| Intercept | 4.084 | 0.148 | 27.66 | *** |
Table 4.
Results of Multinomial Regression Analysis on Meeting Format Preferences.
| RRR | Std. err. | z | Sig | RRR | Std. err. | z | Sig | |
|---|---|---|---|---|---|---|---|---|
| Attributes | ||||||||
| Personability | 0.304 | 0.093 | −3.91 | *** | 0.665 | 0.187 | −1.45 | |
| Friendly services | 2.312 | 0.676 | 2.87 | ** | 0.938 | 0.260 | −0.23 | |
| Promptness in responding | 1.284 | 0.385 | 0.83 | 1.226 | 0.339 | 0.74 | ||
| Knowledge and expertise | 1.928 | 0.579 | 2.19 | * | 1.530 | 0.443 | 1.47 | |
| Help decision-making | 1.487 | 0.447 | 1.32 | 1.148 | 0.327 | 0.48 | ||
| Quality investment | 1.520 | 0.461 | 1.38 | 0.950 | 0.281 | −0.17 | ||
| Attentive listening | 2.274 | 0.828 | 2.26 | * | 1.799 | 0.632 | 1.67 | |
| Care and interest | 1.183 | 0.364 | 0.55 | 1.137 | 0.328 | 0.45 | ||
| Age categories (ref: Age 50 and above) | ||||||||
| Age 21 to 30 | 1.362 | 0.840 | 0.50 | 1.173 | 0.719 | 0.26 | ||
| Age 31 to 40 | 2.756 | 1.612 | 1.73 | 1.671 | 0.986 | 0.87 | ||
| Age 41 to 50 | 2.051 | 1.273 | 1.16 | 1.703 | 1.071 | 0.85 | ||
| Female | 0.944 | 0.250 | −0.22 | 1.143 | 0.289 | 0.53 | ||
| Married | 2.007 | 0.846 | 1.65 | 0.533 | 0.176 | −1.90 | ||
| Whites | 0.885 | 0.334 | −0.32 | 0.711 | 0.249 | −0.97 | ||
| No college degree | 2.810 | 0.852 | 3.41 | ** | 3.404 | 0.995 | 4.19 | *** |
| Income categories (ref: Income >$250,000) | ||||||||
| Less than $100K | 0.259 | 0.306 | −1.14 | 0.129 | 0.147 | −1.80 | ||
| Income $100K to $150K | 0.180 | 0.211 | −1.46 | 0.080 | 0.090 | −2.24 | * | |
| Income $150K to $250K | 0.254 | 0.301 | −1.15 | 0.130 | 0.148 | −1.79 | ||
| Intercept | 0.238 | 0.342 | −1.00 | 4.701 | 6.389 | 1.14 | ||
Discussion
Financial planners have shown a growing interest in understanding the primary skills that clients prioritise (Fortin et al., 2020; Lim & Gray, 2022; McCoy & Van Zutphen, 2022), as they position themselves to effectively make a case for their value. Guided by the SERVQUAL theoretical framework (Parasuraman et al., 1985), we identified factors that may contribute to a client's satisfaction with their long-term client-planner relationship. We also sought to determine whether a consistent pattern of preferred characteristics and meeting formats exists between clients and planners.
Interestingly, in our examination of H1, we found that a smaller proportion of clients valued the eight planner attributes as highly as their planners across the responsiveness, assurance, empathy, and reliability components of the SERVQUAL model (Parasuraman et al., 1985). While planners consistently report higher levels of importance across all SERVQUAL dimensions, the relative ordering of these attributes differs between clients and planners. This suggests that the two groups differ not only in overall rating levels but also in how they prioritise specific aspects of the planner–client relationship (see Figure 1). These results show that planners and clients differ in how they value the SERVQUAL dimensions of the financial planner-client relationship, both in terms of the level of importance assigned and the relative priority ranking of responsiveness, assurance, empathy, and reliability.
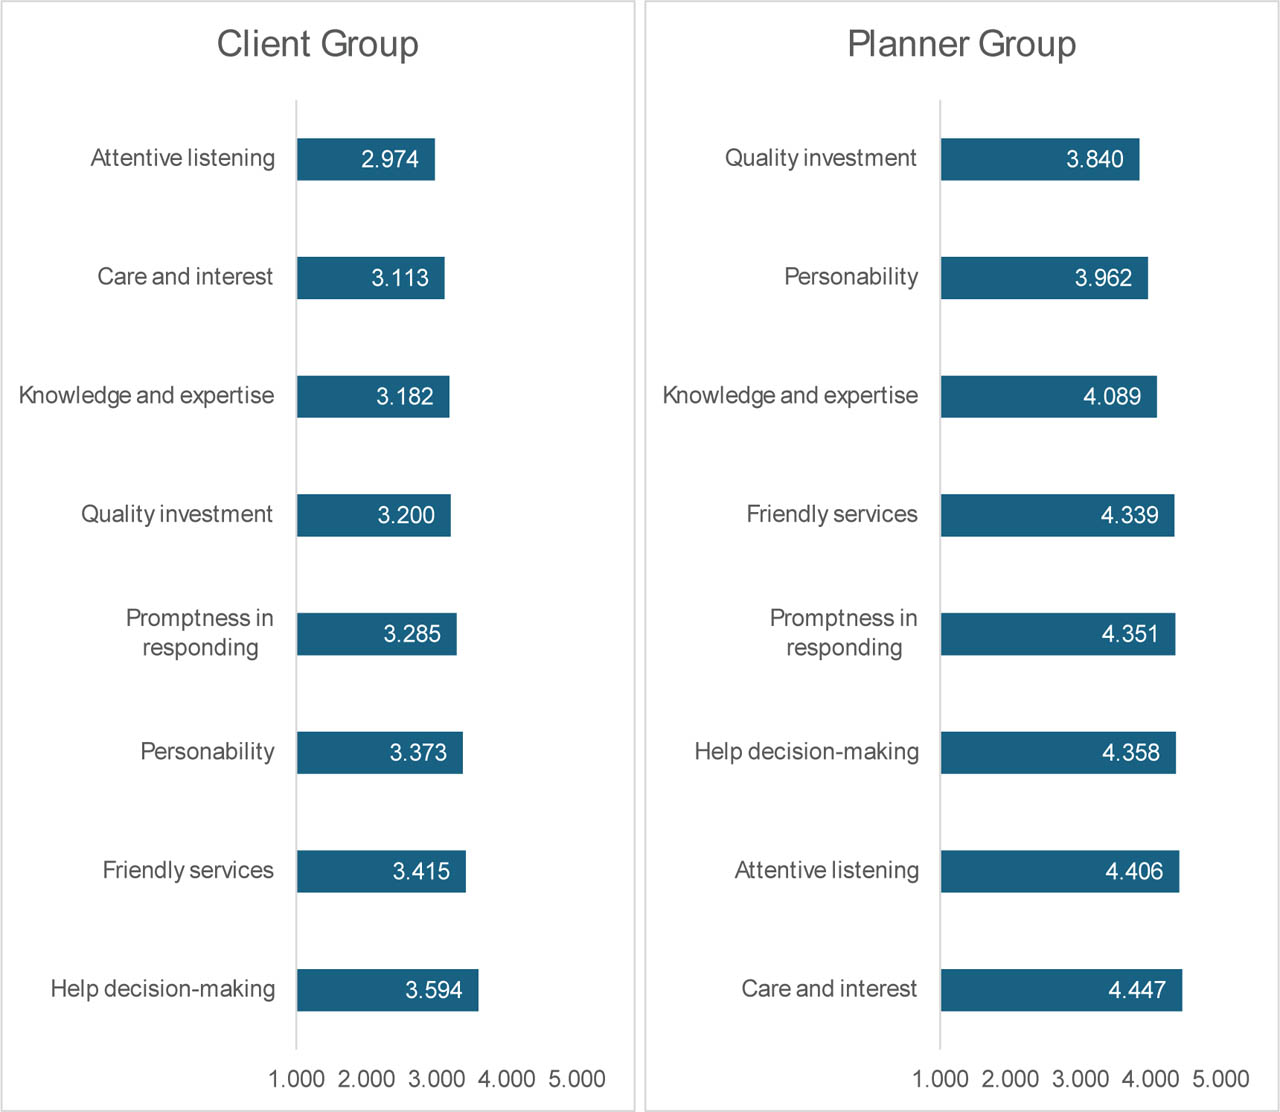
Figure 1.
Ranking of SERVQUAL Attributes among Clients and Planners.
The SUR analysis further supported these findings, showing that clients consistently assigned lower importance to these attributes compared to the levels planners anticipated. Based on the size of the coefficients for the client group, the empathy factor showed the highest disparity between clients' and planners' perspectives, and the disparities in the responsiveness and assurance factors were of similar magnitude, while the gap in the reliability factor showed a relatively small difference between clients' perceptions and planners' expectations. These results collectively suggest that present-day financial planners overestimate the significance of these relational SERVQUAL factors compared to how their clients view them. Hence, the findings of our study answer the H1 and indicate a notable discrepancy in the valuation of factors between financial planners and their clients within the planner-client relationship. This appears to be in line with similar studies conducted in other financial disciplines, such as management accounting (Fleishman et al., 2017) and insurance (Siddiqui & Sharma, 2010), which indicates that there is a disconnect between what financial service providers offer and what clients value. Perhaps clients have come to expect these factors as inherent when engaging with financial planners, so those attributes are not ranked as differentiators when asked to identify what is important to their satisfaction levels. Nevertheless, this is an important finding because the SERVQUAL theory posits that the gap between expected value and actual value received is an integral component in how clients determine their satisfaction level.
These findings suggest that financial planners may be relying in part on their own professional assumptions when judging what clients find most valuable in the planner-client relationship. Although planners appear to place particularly strong importance on responsiveness, assurance, empathy, and reliability, clients may not evaluate the relationship through these same priorities or with the same intensity. This distinction matters because service quality is not determined solely by what planners intend to deliver, but by how clients interpret and evaluate that experience. As such, planners need to be aware that their own training, experiences, and beliefs about what constitutes high-quality planning may shape the way they anticipate client preferences. Greater awareness of this potential bias may help planners avoid projecting their own values onto clients and instead build service models that are more responsive to how clients actually define quality (Ben, 2018; Parasuraman et al., 1985).
Our findings also suggest that planners have raised their awareness of the importance of soft skills when differentiating themselves in a competitive market. The increased awareness could imply that the mandate for the inclusion of the Psychology of Personal Financial Planning competency by the CFP Board has been effective (Powell, 2020). This could explain the high value planners placed on many of the planner characteristics ranked as important, such as the empathy factor, which includes demonstrating genuine care and interest for the client, as well as attentive listening skills. While past surveys have found responsiveness and proactive communication to be important to clients who are satisfied with their planner relationship (Keller, 2021), our findings show that planners appear to place more importance on that attribute than their clients. Another notable finding related to the attentive listening construct, showed the second-largest disparity in perspectives between planners and clients according to the seemingly unrelated regression results. This measure also had the lowest proportion (27.59%) of clients rating it as important. However, clients may not fully understand the meaning behind the statement “my planner listens to me” because it is vague, ambiguous, and open to interpretation. The term “listens” can refer to paying attention, but the statement may fail to capture the depth of comprehension which could account for the unexpected result.
Interestingly, quality investments had the lowest proportion (65.81%) of planners ranking it as important. This characteristic also showed the smallest negative coefficient for the client group in the seemingly unrelated regression results, indicating the least disparity between planners and clients in their views on the importance of this attribute. This is surprising because it was ranked as one of the most important factors in the earlier study by Murphy et al. (2020). Perhaps the intensity of the market volatility experienced in the post-COVID economy would explain why planners would change their view and value quality investments as less important than other attributes they offer to their clients. Planners may have discovered that they can still add value in environments as volatile as the one we experienced during that period by assisting in areas they can influence or demonstrate some degree of control, e.g., help with decisions that need to be made or lend an ear to client concerns, and, now identify these attributes as most important. This rationale would align with what was found to be the most important attribute for both planners and clients which is the help with decision-making attribute.
Our findings regarding H2 showed that financial planners appear to have successfully adapted to leveraging virtual meeting technology to sustain productivity. A significantly higher proportion of financial planners (73.80%) compared to clients (53.07%) acknowledged this efficiency. The lack of subtle signals, such as body language, which are crucial for fostering trust and rapport, might be more apparent to clients (Fox & Bartholomae, 2020; McCoy et al., 2024). Alternatively, this variation could be due to clients' differing levels of comfort and skill with technology. The client sample had an average age of approximately 37, placing them in the Millennial generation. They were matched with a planner sample whose average age was approximately 46, placing them in the Generation X demographic. This generational difference may be reflected in our findings. While Millennials are assumed to build their social networks on digital platforms, some researchers have identified specific usage preferences between the generations which may be a factor contributing to the misalignment found in our study. For example, one study found that Generation X engages with technology for business or practical usage, whereas Millennials engage for mostly entertainment (Calvo-Porral & Pesqueira-Sanchez, 2020). The higher value planners attach to virtual meetings may reflect a professional preference for efficiency when serving their clients.
Finally, the investigation of H3 found that clients' meeting format preferences were influenced by the attributes they value in their financial planners. Based on the multinomial logistic regression results, relative to a preference for a traditional in-person meeting format, clients who valued personability showed a lower likelihood of choosing hybrid meetings and no significance in preference for virtual meetings. This preference for an in-person meeting modality would position the client to experience their planner's more affable nature and align with what appears to be most desirable to the client. Conversely, clients who prioritised the planner's level of knowledge and expertise, as well as attentive listening were more likely to opt for hybrid meetings over the in-person option. Clients who placed importance on friendly service were also significantly more likely to select hybrid meetings as their preferred format. This finding may reflect the flexibility hybrid modalities offer in delivering objective content and gathering information and its widespread use within the planning profession. Therefore, specific preferences on meeting format were related to SERVQUAL attributes rather than no preference so planners should recognise that meeting format matters. In summary, the diversity of client preferences underscores the complexity of their demands and the value of an individualised approach to financial planning.
The findings of this study contribute to broader conversations about the identity of financial planning as a helping profession (Fortin et al., 2020; McCoy & Van Zutphen, 2022). If planners increasingly position themselves as trusted counsellors rather than solely technical experts, then the profession must continue refining how it conceptualises and delivers relational value (McCoy & Van Zutphen, 2022). Some attributes planners view as especially important may be interpreted by clients as baseline expectations rather than distinguishing features of exceptional service. This does not diminish the importance of those attributes. Instead, it suggests that the profession may benefit from moving beyond assuming that professional norms alone are sufficient indicators of client-perceived quality (Parasuraman et al., 1985). Greater attention to the client's evaluative perspective may help the profession better define what meaningful, client-centered service looks like in contemporary financial advice (McCoy et al., 2022; Parasuraman et al., 1985).
Limitations and Future Directions
While the study provides valuable insights into the perspectives of planners and clients, several limitations must be noted. The use of a convenience-based client sample and voluntary participation may limit the generalisability of the findings. Future research using more representative sampling approaches would help validate these results. Additionally, since clients were provided an incentive to participate in the study, planners may have been biased toward their younger clients to participate in the study. Younger clients would be earlier in the accumulation stage of life and could be perceived as benefiting more from the incentive than older, more financially established clients. Another possible dynamic that may have influenced the client sample, would be that younger participants are more likely to participate in online surveys than older participants, according to some studies (Kelfve et al., 2020). Future studies should find ways to decrease sampling bias.
The clarity and precision of the statement used to assess the characteristics of planners that align with the SERVQUAL framework could be refined in future studies. Further, incorporating more specifics around aspects related to the construct of tangibles from this theory would improve measurements of this framework (Parasuraman et al., 1985). For example, questions asking clients to value the importance of the layout of their planner's physical office or the planner's virtual background during online meetings, along with things like the ease of navigating the planner's website or client portal would allow scholars to examine the relationship these tangibles have to other constructs of interest. These factors have been found to impact client satisfaction greatly in prior research (e.g., Britt & Grable, 2012). The SERVQUAL framework has also received the critique that the approach assesses the overall quality of service in a one-dimensional view that may be better suited for product sales rather than holistic care found in areas such as medical care, social services, or in our case financial planning (Jonkisz et al., 2021). The final limitation of note is that we focused on the relationship between perceived quality and client satisfaction. However, SERVQUAL (Parasuraman et al., 1985) also has a perceived value concept that was not incorporated into this study due to dataset limitations.
The perceived value concept states that clients' assessment of the benefits of seeing a planner compared to the cost, time, and effort in seeing a planner. Prior research by Ben (2018) found that perceived value has a direct relationship with client satisfaction (similarly to perceived quality), but that there was also a mediating relationship, with perceived value appearing to mediate the relationship between perceived quality and client satisfaction. So, future studies would benefit from incorporating both aspects of the theory.
Implications
The present study has important implications for the financial planning profession. A disconnect between the importance clients assign to planner attributes and the importance planners believe clients assign to those same characteristics. More specifically, the results suggest that planners may be relying on their own professional perspectives when estimating what clients value most in the planner-client relationship. Planners' assumptions may shape how they communicate value, structure meetings, and prioritise aspects of service delivery. If those assumptions do not align with the client's perspective, planners may unintentionally emphasise characteristics that clients view as expected, secondary, or less central to their overall evaluation of service quality. From a practical standpoint, these findings suggest that planners should not assume their own understanding of high-quality service mirrors clients' definition of it. The findings also suggest a need for greater self-awareness in planner education and professional development. Training should not only emphasise technical competence and relational skills but also help planners reflect on how their own beliefs, professional socialisation, and prior experiences may shape what they perceive as most valuable to clients. Encouraging planners to recognise these assumptions may reduce bias in service delivery and improve their ability to adapt their approach across clients with differing expectations, preferences, and meeting format needs. Planners have committed significant amounts of time and effort to educate themselves on technical aspects of the financial services industry (Anderson et al., 2022), but market dynamics such as technological advances and generational shifts have driven changes in client preferences. The planning profession has responded with a more client-centered focus to their service model (Powell, 2020), but we must not lose sight of what's important to the client and trust what they tell us.
Our research supports a distinction between what is expected when a planner engages with their client in person and what a client expects when they meet with their planner virtually. It is critical for financial planners to comprehend the perceptual gap that exists between them and their clients regarding the efficiency of virtual meetings. This implies that there is a requirement for strategies to improve the virtual meeting experience for clients. Implementing easy to understand technology and providing training on how to utilise virtual platforms could potentially help. Planners should be aware that clients who value certain planners' attributes can show preferences for a hybrid model over traditional in-person meetings. Clients without a college degree prefer to meet their planners through hybrid or virtual meetings rather than traditional in-person meetings, while clients earning between $100,000 and $150,000 strongly prefer in-person meetings over virtual ones. Acknowledging the significance of meeting format to their clients, financial planners can optimise the delivery format of their interactions with clients to accommodate their diverse preferences, therefore boosting the overall quality of their professional relationships.
Future investigation should further explore the underlying factors contributing to the perception gaps between financial planners and their clients. Qualitative research methods, like interviews or focus groups, which involve the participation of both clients and planners, have the potential to provide more comprehensive and in-depth insights. Exploring the motivations behind client preferences would also provide insight into why clients value certain attributes over others and potentially help planners anticipate the future needs of their clients. In order to further investigate the discrepancy between clients' and planners' perspectives on the productivity of virtual meetings compared to in-person meetings, future studies could continue this line of research by integrating questions regarding participants' familiarity with digital tools and platforms. Additionally, examining the features of various platforms used in virtual meetings could provide further insights into how these aspects influence perceptions of productivity.
Conclusion
This study extends the financial planning literature by applying the SERVQUAL framework to examine how clients and planners evaluate service quality within the planner-client relationship (Parasuraman et al., 1985). The findings indicate that clients consistently assign lower importance to key relational attributes than planners expect and are also less likely than planners to view virtual meetings as equally productive as in-person meetings. In addition, client preferences for meeting format appear to be associated with how they value particular service characteristics.
These findings contribute to the literature in three important ways. First, they bring a well-established service quality framework into a financial planning context where it has received limited empirical attention (Ben, 2018; Parasuraman et al., 1985). Second, they compare client and planner perspectives directly, allowing for the identification of meaningful gaps between what planners believe clients value and what clients actually report valuing. Third, they demonstrate that the tangible dimension of service delivery, particularly meeting format, remains relevant to how service quality is experienced and interpreted (Archuleta et al., 2021; Palese & Usai, 2018; Top & Ali, 2021).
Overall, the study suggests that improving service quality in financial planning may require more than strengthening technical competence or relational skills alone. It may also require planners, educators, and the profession more broadly to pay closer attention to how clients define value and satisfaction in the planning relationship (McCoy & Van Zutphen, 2022; Parasuraman et al., 1985). Doing so may strengthen both the client experience and the continued development of financial planning as a client-centered profession (Fortin et al., 2020; McCoy et al., 2022).