Figure 1.
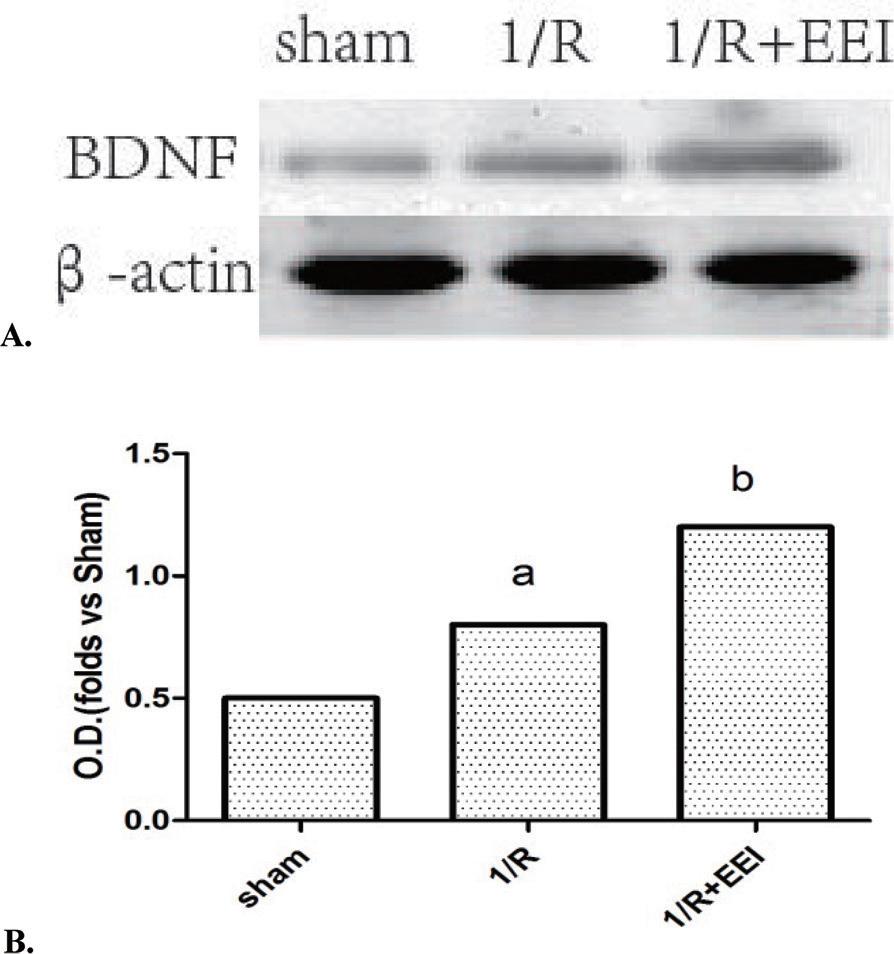
Figure 2.

Comparison of platform crossings, swim speed, time ratio, and distance ratio among different treatment groups in SD rats_
| Group | Platform crossings (60 s) | Swim speed (cm/s) | Time ratio (%) | Distance ratio (%) |
|---|---|---|---|---|
| Sham | 5.32 ± 1.76 | 40 ± 2.87 | 42.34 ± 3.23 | 42.56 ± 3.53 |
| 1/R | 2.32 ± 1.21 | 36 ± 2.01 | 24.67 ± 3.97 | 23.78 ± 2.65 |
| 1/R + EEI | 3.99 ± 1.53 | 38 ± 2.54 | 37.36 ± 3.01 | 37.84 ± 3.23 |