
Figure 1.
Medical history and family history of the studied stroke high-risk patients (study and control groups) (N = 80)_
| Variables | Study group (n = 40) | Control group (n = 40) | χ2 | P | ||
|---|---|---|---|---|---|---|
| n | % | n | % | |||
| Patients’ medical history | ||||||
| Hypertension | 15 | 37.5 | 11 | 27.5 | 15.215 | 0.009* |
| Diabetes | 4 | 10 | 0 | 0 | ||
| Cardiac disease | 8 | 20 | 2 | 5 | ||
| Hypertension and diabetes | 6 | 15 | 15 | 37.5 | ||
| Hypertension and heart disease | 4 | 10 | 3 | 7.5 | ||
| Multiple diseases | 3 | 7.5 | 9 | 22.5 | ||
| Family medical history | ||||||
| No | 2 | 5 | 1 | 2.5 | 13.511 | 0.061 |
| Hypertension | 8 | 20 | 7 | 17.5 | ||
| Diabetes | 4 | 10 | 4 | 10 | ||
| Heart diseases | 7 | 17.5 | 2 | 5 | ||
| Obesity | 7 | 17.5 | 2 | 5 | ||
| Hypercholesterolemia | 4 | 10 | 2 | 5 | ||
| Hypertension and diabetes | 4 | 10 | 14 | 35 | ||
| Multiple diseases | 4 | 10 | 8 | 20 | ||
| Family history of stroke | ||||||
| No | 36 | 90 | 35 | 87.5 | 0.125 | 0.723 |
| Yes (one of parents) | 4 | 10 | 5 | 12.5 | ||
| Patient history of stroke | ||||||
| No | 35 | 87.5 | 39 | 97.5 | 2.883 | 0.090 |
| Yes | 5 | 12.5 | 1 | 2.5 | ||
| Using blood clotting drugs | ||||||
| No | 30 | 75 | 35 | 87.5 | 2.051 | 0.152 |
| Yes | 10 | 25 | 5 | 12.5 | ||
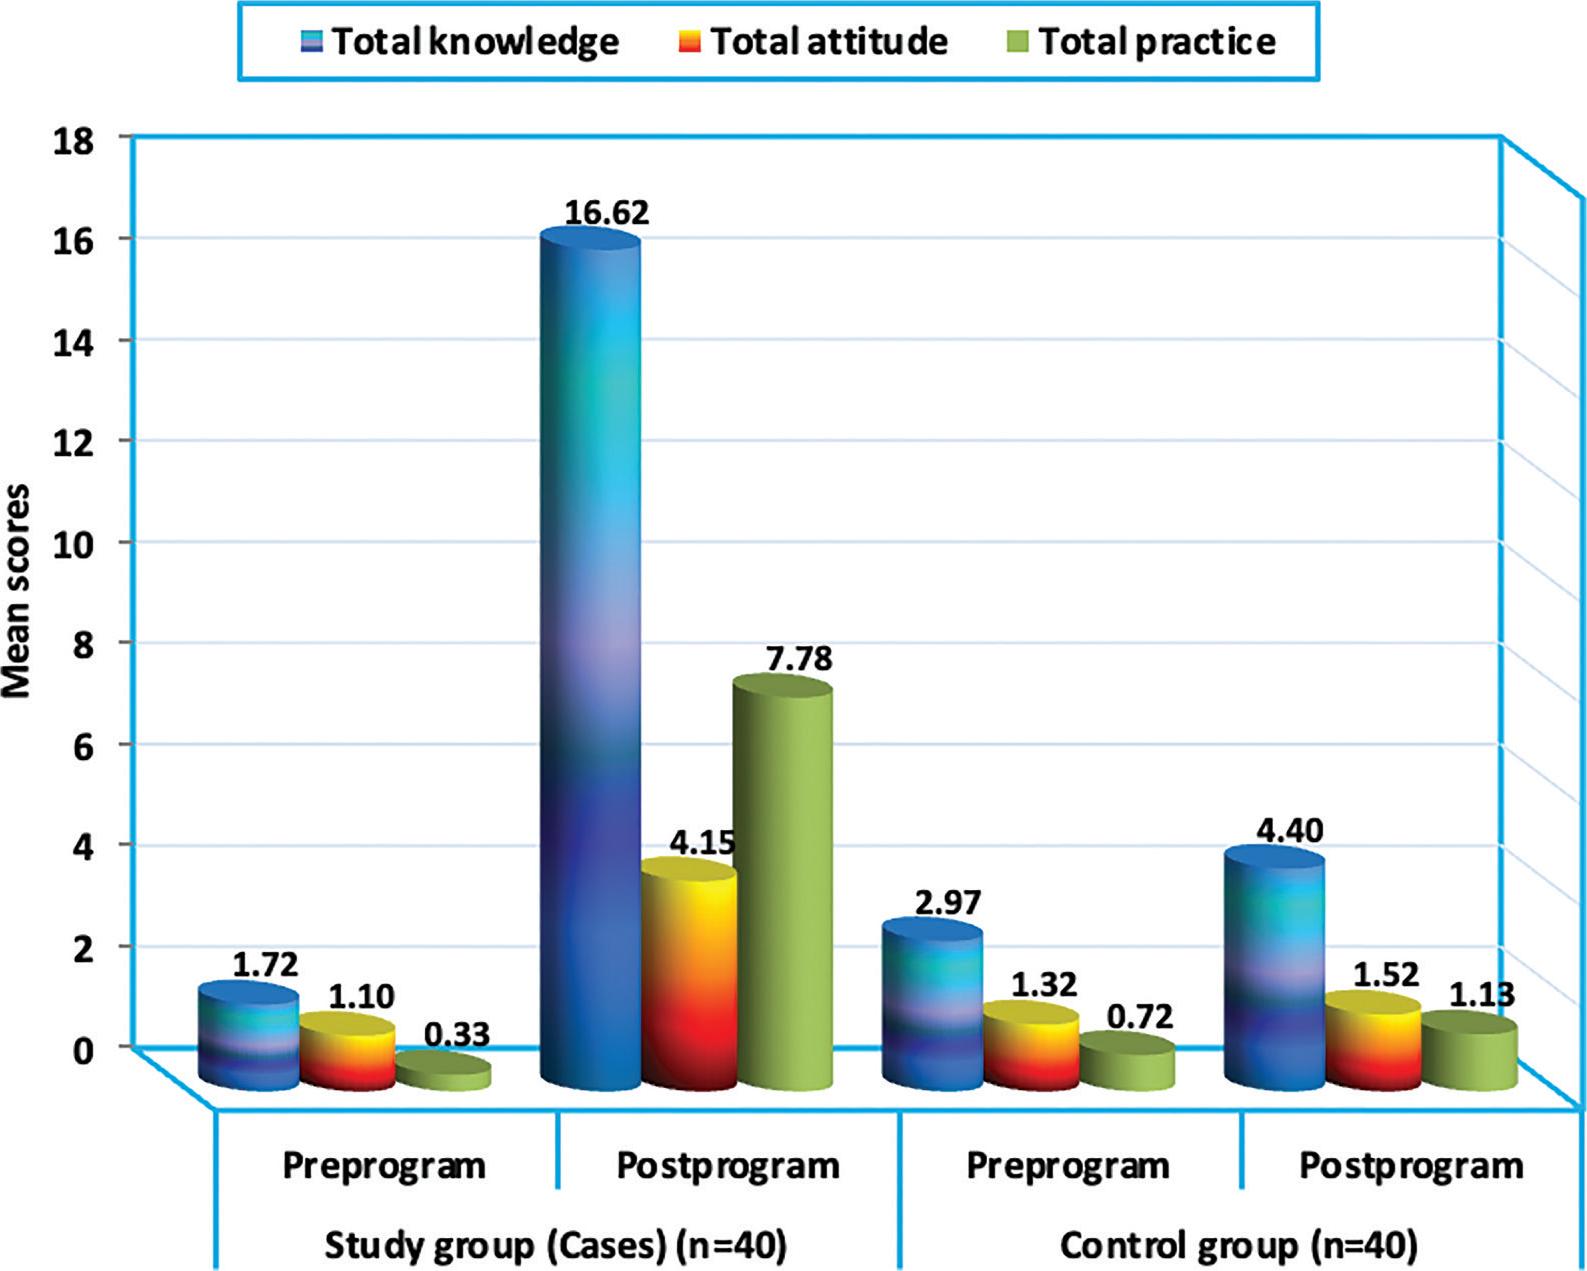
Mean changes of scores of total KAP regarding stroke among the studied stroke high-risk patients (study and control groups) post-program (N = 80)_
| Variables | Study group (n = 40) | Control group (n = 40) | Z value | P |
|---|---|---|---|---|
| Total knowledge | 5.435 | 0.0001* | ||
| Range | -4.00 to 25.00 | -1.00 to 6.00 | ||
| Mean ± SD | 14.90 ± 6.13 | 1.42 ± 1.82 | ||
| Total attitude | 5.199 | 0.0001* | ||
| Range | 0–6.00 | -3.00 to 3.00 | ||
| Mean ± SD | 3.05 ± 1.81 | 0.20 ± 0.97 | ||
| Total practice | 5.295 | 0.0001* | ||
| Range | 0–14 | 0–3 | ||
| Mean ± SD | 7.45 ± 3.65 | 0.40 ± 0.81 |
Levels of total KAP regarding stroke among the studied stroke high-risk patients (study and control groups) pre- and post-program (N = 80)_
| Variables | Study group (n = 40) | Control group (n = 40) | χ2/P | |||||||
|---|---|---|---|---|---|---|---|---|---|---|
| Pre-program | Post-program | Pre-program | Post-program | Pre-program | Post-program | |||||
| n | % | n | % | n | % | n | % | |||
| Levels of total knowledge | ||||||||||
| Poor | 39 | 97.5 | 7 | 17.5 | 40 | 100 | 40 | 100 | ||
| Fair | 1 | 2.5 | 32 | 80 | 0 | 0 | 0 | 0 | ||
| Good | 0 | 0 | 1 | 2.5 | 0 | 0 | 0 | 0 | ||
| χ2 | 52.382 | - | 1.013 | 53.333 | ||||||
| P | 0.0001* | - | 0.314 | 0.0001* | ||||||
| Levels of total attitude | ||||||||||
| Negative | 38 | 95 | 9 | 22.5 | 39 | 97.5 | 35 | 87.5 | ||
| Positive | 2 | 5 | 31 | 77.5 | 1 | 2.5 | 5 | 12.5 | ||
| χ2 | 43.378 | 2.883 | 0.346 | 34.141 | ||||||
| P | 0.0001* | 0.09 | 0.556 | 0.0001* | ||||||
| Levels of total practice for prevention | ||||||||||
| Bad | 39 | 97.5 | 9 | 22.5 | 40 | 100 | 40 | 100 | ||
| Moderate | 1 | 2.5 | 24 | 60 | 0 | 0 | 0 | 0 | ||
| Good | 0 | 0 | 7 | 17.5 | 0 | 0 | 0 | 0 | ||
| χ2 | 46.910 | - | 1.013 | 50.612 | ||||||
| P | 0.0001* | - | 0.314 | 0.0001* | ||||||
Smoking and physical activity practicing of the studied stroke high-risk patients (study and control groups) pre- and post-program (N = 80)_
| Variables | Study group (n = 40) | Control group (n = 40) | χ2/P | |||||||
|---|---|---|---|---|---|---|---|---|---|---|
| Pre-program | Post-program | Pre-program | Post-program | Pre-program | Post-program | |||||
| n | % | n | % | n | % | n | % | |||
| Smoking | ||||||||||
| No smoking | 8 | 20 | 6 | 15 | 14 | 35 | 15 | 37.5 | ||
| Ex-smoker | 4 | 10 | 1 | 2.5 | 11 | 27.5 | 11 | 27.5 | ||
| Active smoker | 23 | 57.5 | 28 | 70 | 12 | 30 | 11 | 27.5 | ||
| Passive smoker | 5 | 12.5 | 5 | 12.5 | 3 | 7.5 | 3 | 7.5 | ||
| χ2 | 2.58 | 0.08 | 8.86 | 20.10 | ||||||
| P | 0.461 | 0.994 | 0.031* | 0.0002* | ||||||
| Physical activity practicing | ||||||||||
| No | 34 | 85 | 18 | 45 | 27 | 67.5 | 24 | 61.5 | ||
| Sometimes | 2 | 5 | 10 | 25 | 5 | 12.5 | 4 | 10.3 | ||
| Yes | 4 | 10 | 12 | 30 | 8 | 20 | 11 | 28.2 | ||
| χ2 | 14.26 | 0.75 | 3.42 | 3.46 | ||||||
| P | 0.0001* | 0.688 | 0.181 | 0.177 | ||||||
Sociodemographic data and BMI of the studied stroke high-risk patients (study and control groups) (N = 80)_
| Variables | Study group (n = 40) | Control group (n = 40) | χ2 | P | ||
|---|---|---|---|---|---|---|
| n | % | n | % | |||
| Age (years) | t-test = 0.056, P = 0.955 | |||||
| Range | 25–90 | 32–74 | ||||
| Mean ± SD | 53.15 ± 16.28 | 52.98 ± 10.92 | ||||
| Sex | ||||||
| Females | 27 | 67.5 | 25 | 62.5 | 0.22 | 0.639 |
| Males | 13 | 32.5 | 15 | 37.5 | ||
| Residence | ||||||
| Rural | 22 | 55 | 29 | 72.5 | 2.650 | 0.104 |
| Urban | 18 | 45 | 11 | 27.5 | ||
| Educational level | ||||||
| Illiterate | 9 | 22.5 | 11 | 27.5 | 20.189 | 0.0001* |
| Read and write | 16 | 40 | 3 | 7.5 | ||
| Elementary | 3 | 7.5 | 13 | 32.5 | ||
| Secondary | 4 | 10 | 10 | 25 | ||
| University | 8 | 20 | 3 | 7.5 | ||
| Marital status | ||||||
| Single | 8 | 20 | 1 | 2.5 | 6.193 | 0.045* |
| Married | 23 | 57.5 | 27 | 67.5 | ||
| Widow/Divorced | 9 | 22.5 | 12 | 30 | ||
| Work | ||||||
| Not working | 28 | 70 | 30 | 75 | 2.355 | 0.308 |
| Retired | 6 | 15 | 2 | 5 | ||
| Working | 6 | 15 | 8 | 20 | ||
| Live with | ||||||
| Alone | 6 | 15 | 3 | 7.5 | 1.127 | 0.288 |
| With family | 34 | 85 | 37 | 92.5 | ||
| Income | ||||||
| Not enough | 24 | 60 | 25 | 62.5 | 3.163 | 0.206 |
| Enough | 13 | 32.5 | 15 | 37.5 | ||
| Enough and spare | 3 | 7.5 | 0 | 0 | ||
| BMI | t-test = 0.764, P = 0.447 | |||||
| Range | 21.6-48.4 | 25.0-46.6 | ||||
| Mean ± SD | 33.08 ± 6.31 | 34.05 ± 4.96 | ||||
Correlation between changes of scores of total KAP regarding stroke among the studied stroke high-risk patients (study and control groups) post-program (N = 80)_
| Variables | Study group (n = 40) | Control group (n = 40) | ||
|---|---|---|---|---|
| Total knowledge | Total attitude | Total knowledge | Total attitude | |
| Total attitude | ||||
| r | 0.502 | - | 0.416 | - |
| P | 0.001* | - | 0.008* | - |
| Total practice | ||||
| r | 0.684 | 0.427 | 0.264 | 0.288 |
| P | 0.0001* | 0.006* | 0.1 | 0.071 |