
Figure 1.
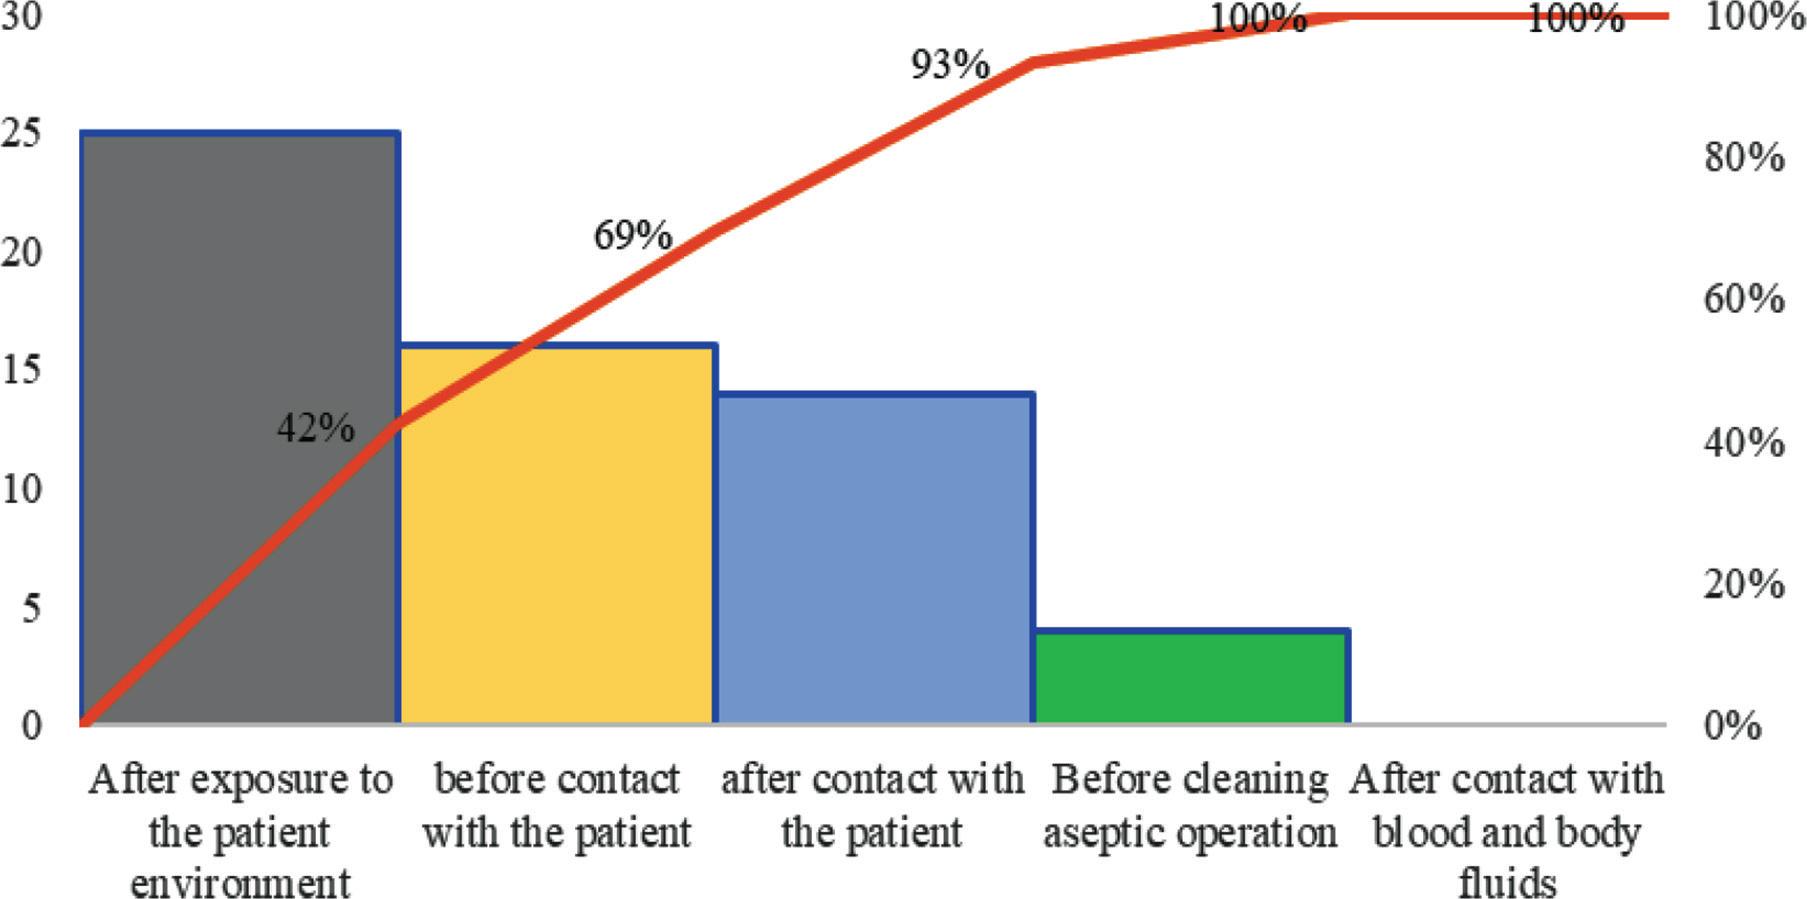
Figure 2.
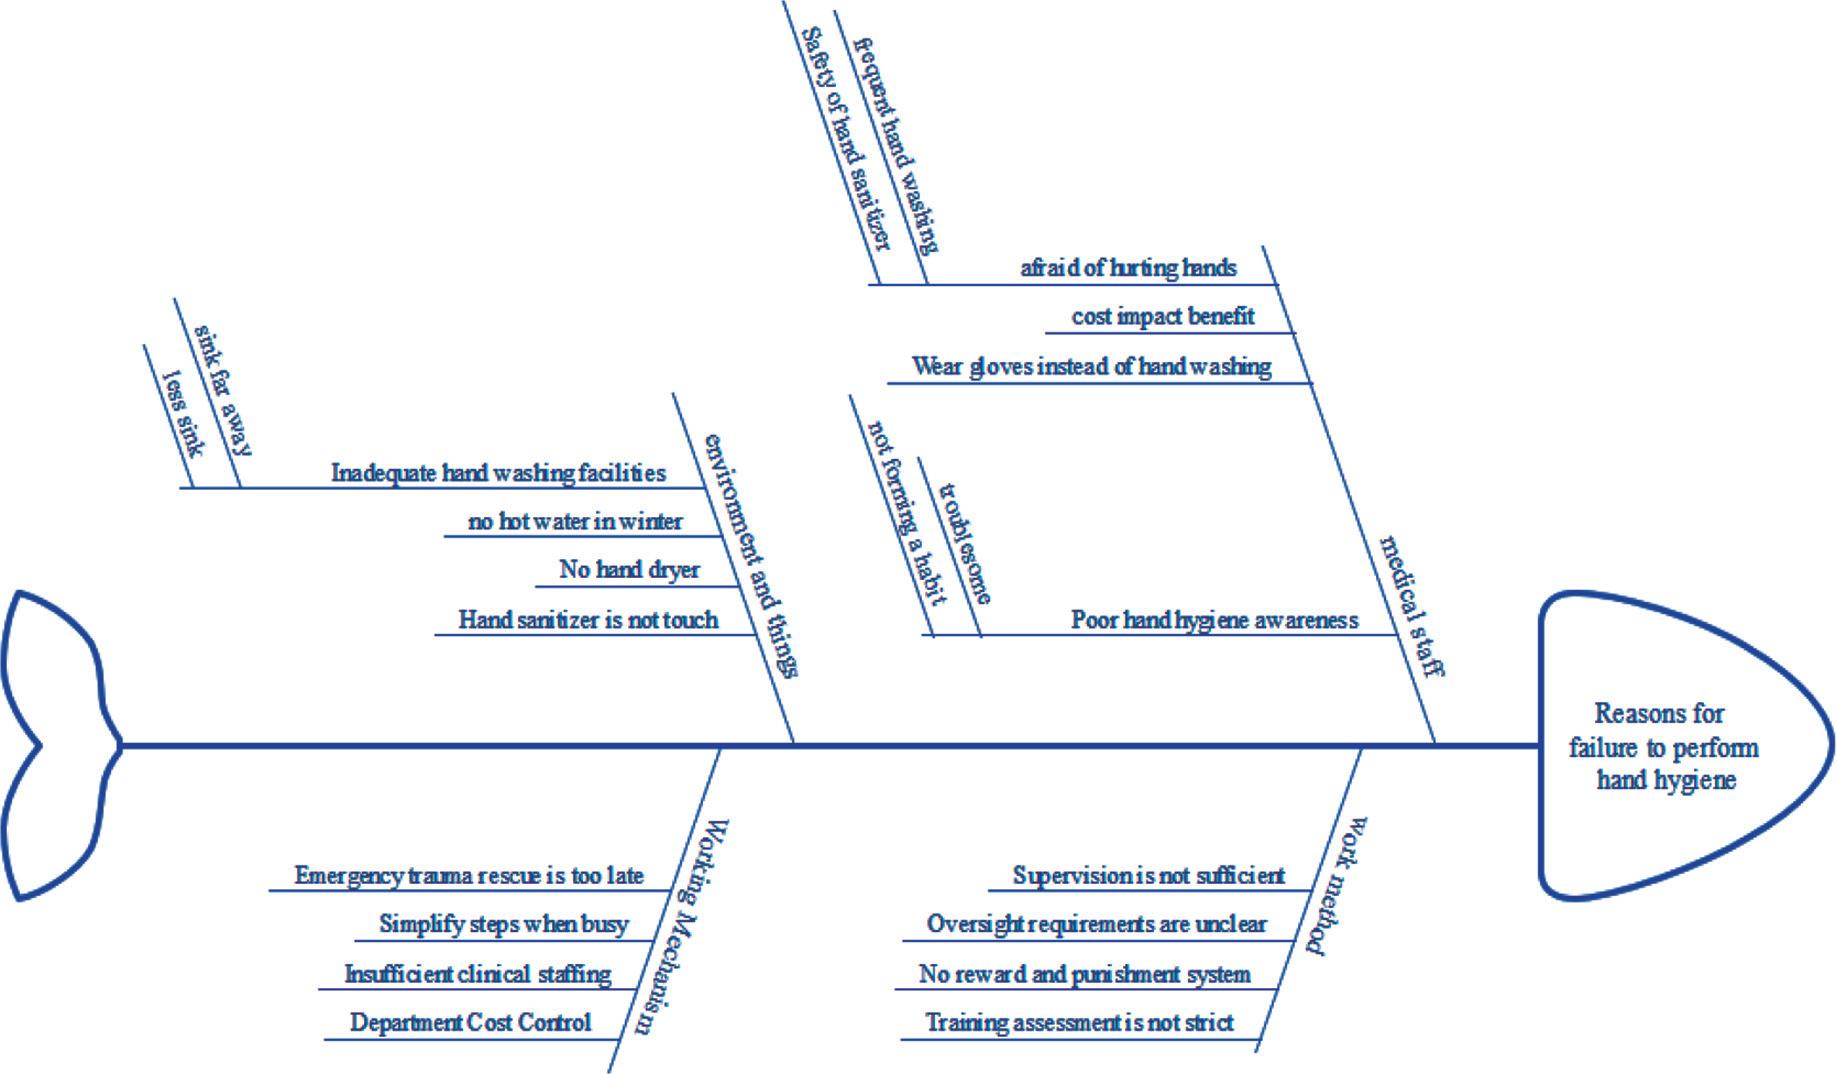
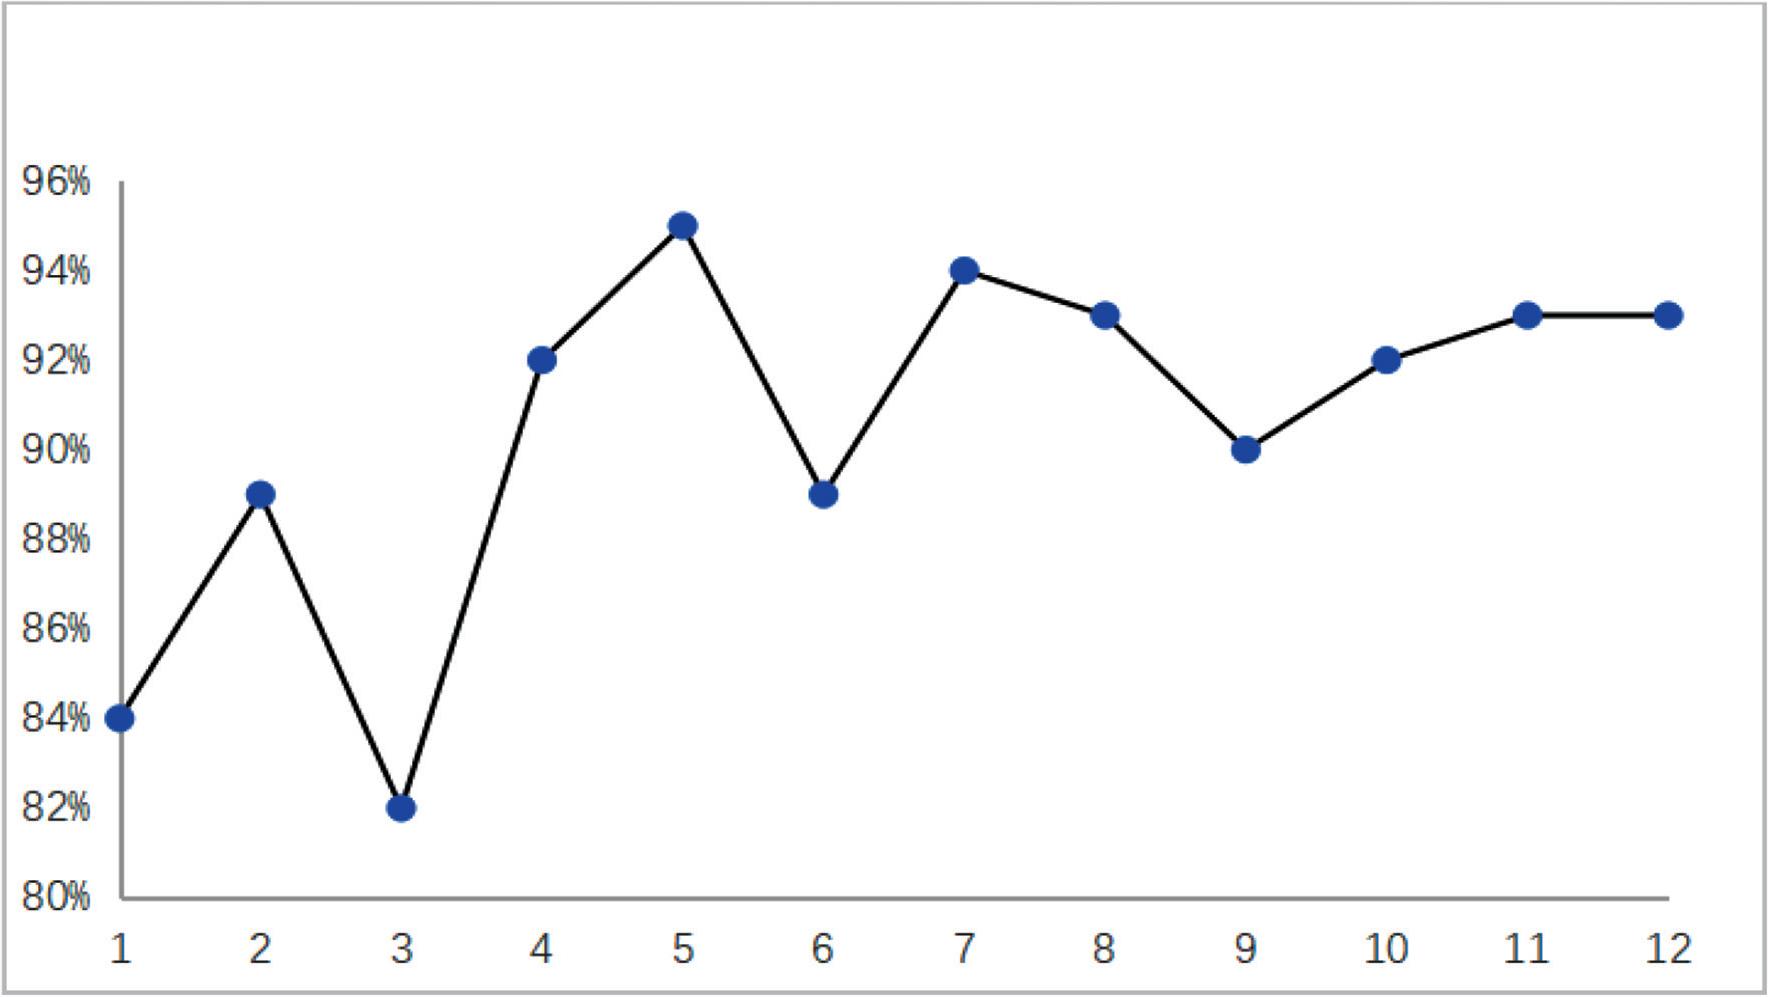
Figure 3.
Comparison of hand hygiene compliance of orthopedic medical staff in the first quarter_
| Medical staff | Total monitoring time | Actual execution time | Compliance | χ2 value | P-value |
|---|---|---|---|---|---|
| Physician | 125 | 102 | 82% | 17.308 | <0.001 |
| Nurse | 200 | 164 | 82% |
Comparison of hand hygiene compliance in the first and second quarters_
| Medical staff | Total monitoring time | Actual execution time | Compliance | t value | P-value |
|---|---|---|---|---|---|
| Before implementation | 325 | 266 | 82% | 4.070 | 0.000 |
| After implementation | 440 | 407 | 93% |