
Table 1.
Strategy used to search the Web of Science.
| No. | Search strategy | No. of documents |
|---|---|---|
| #1 | ((TS = (“adolescent*” OR “teen*” OR “youth*” OR “child*” OR “infant*” OR “preschool” OR “minor*”)) OR Tl = (“adolescent*” OR “teen*” OR “youth*” OR “child*” OR “infant*” OR “preschool” OR “minor*”)) OR AB = (“adolescent*” OR “teen*” OR “youth*” OR “child*” OR “infant*” OR “preschool” OR “minor*”) | 1,778,196 |
| #2 | ((TS = (“neoplasm*” OR “cancer*” OR “tumour*” OR “leukaemia”)) OR Tl = (“neoplasm*” OR “cancer*” OR “tumour*” OR “leukaemia”)) OR AB = (“neoplasm*” OR “cancer*” OR “tumour*” OR “leukaemia”) | 3,171,886 |
| #3 | ((TS = (“family intervention” OR “family-based intervention” OR “family-centred intervention” OR “family psychosocial intervention” OR “family psychoeducation” OR “family therapy”)) OR Tl = (“family intervention” OR “family-based intervention” OR “family-centred intervention” OR “family psychosocial intervention” OR “family psychoeducation” OR “family therapy”)) OR AB=(“family intervention” OR “family-based intervention” OR “family-centred intervention” OR “family psychosocial intervention” OR “family psychoeducation” OR “family therapy”) | 2363 |
| #4 | #1 AND #2 AND #3 | 39 |
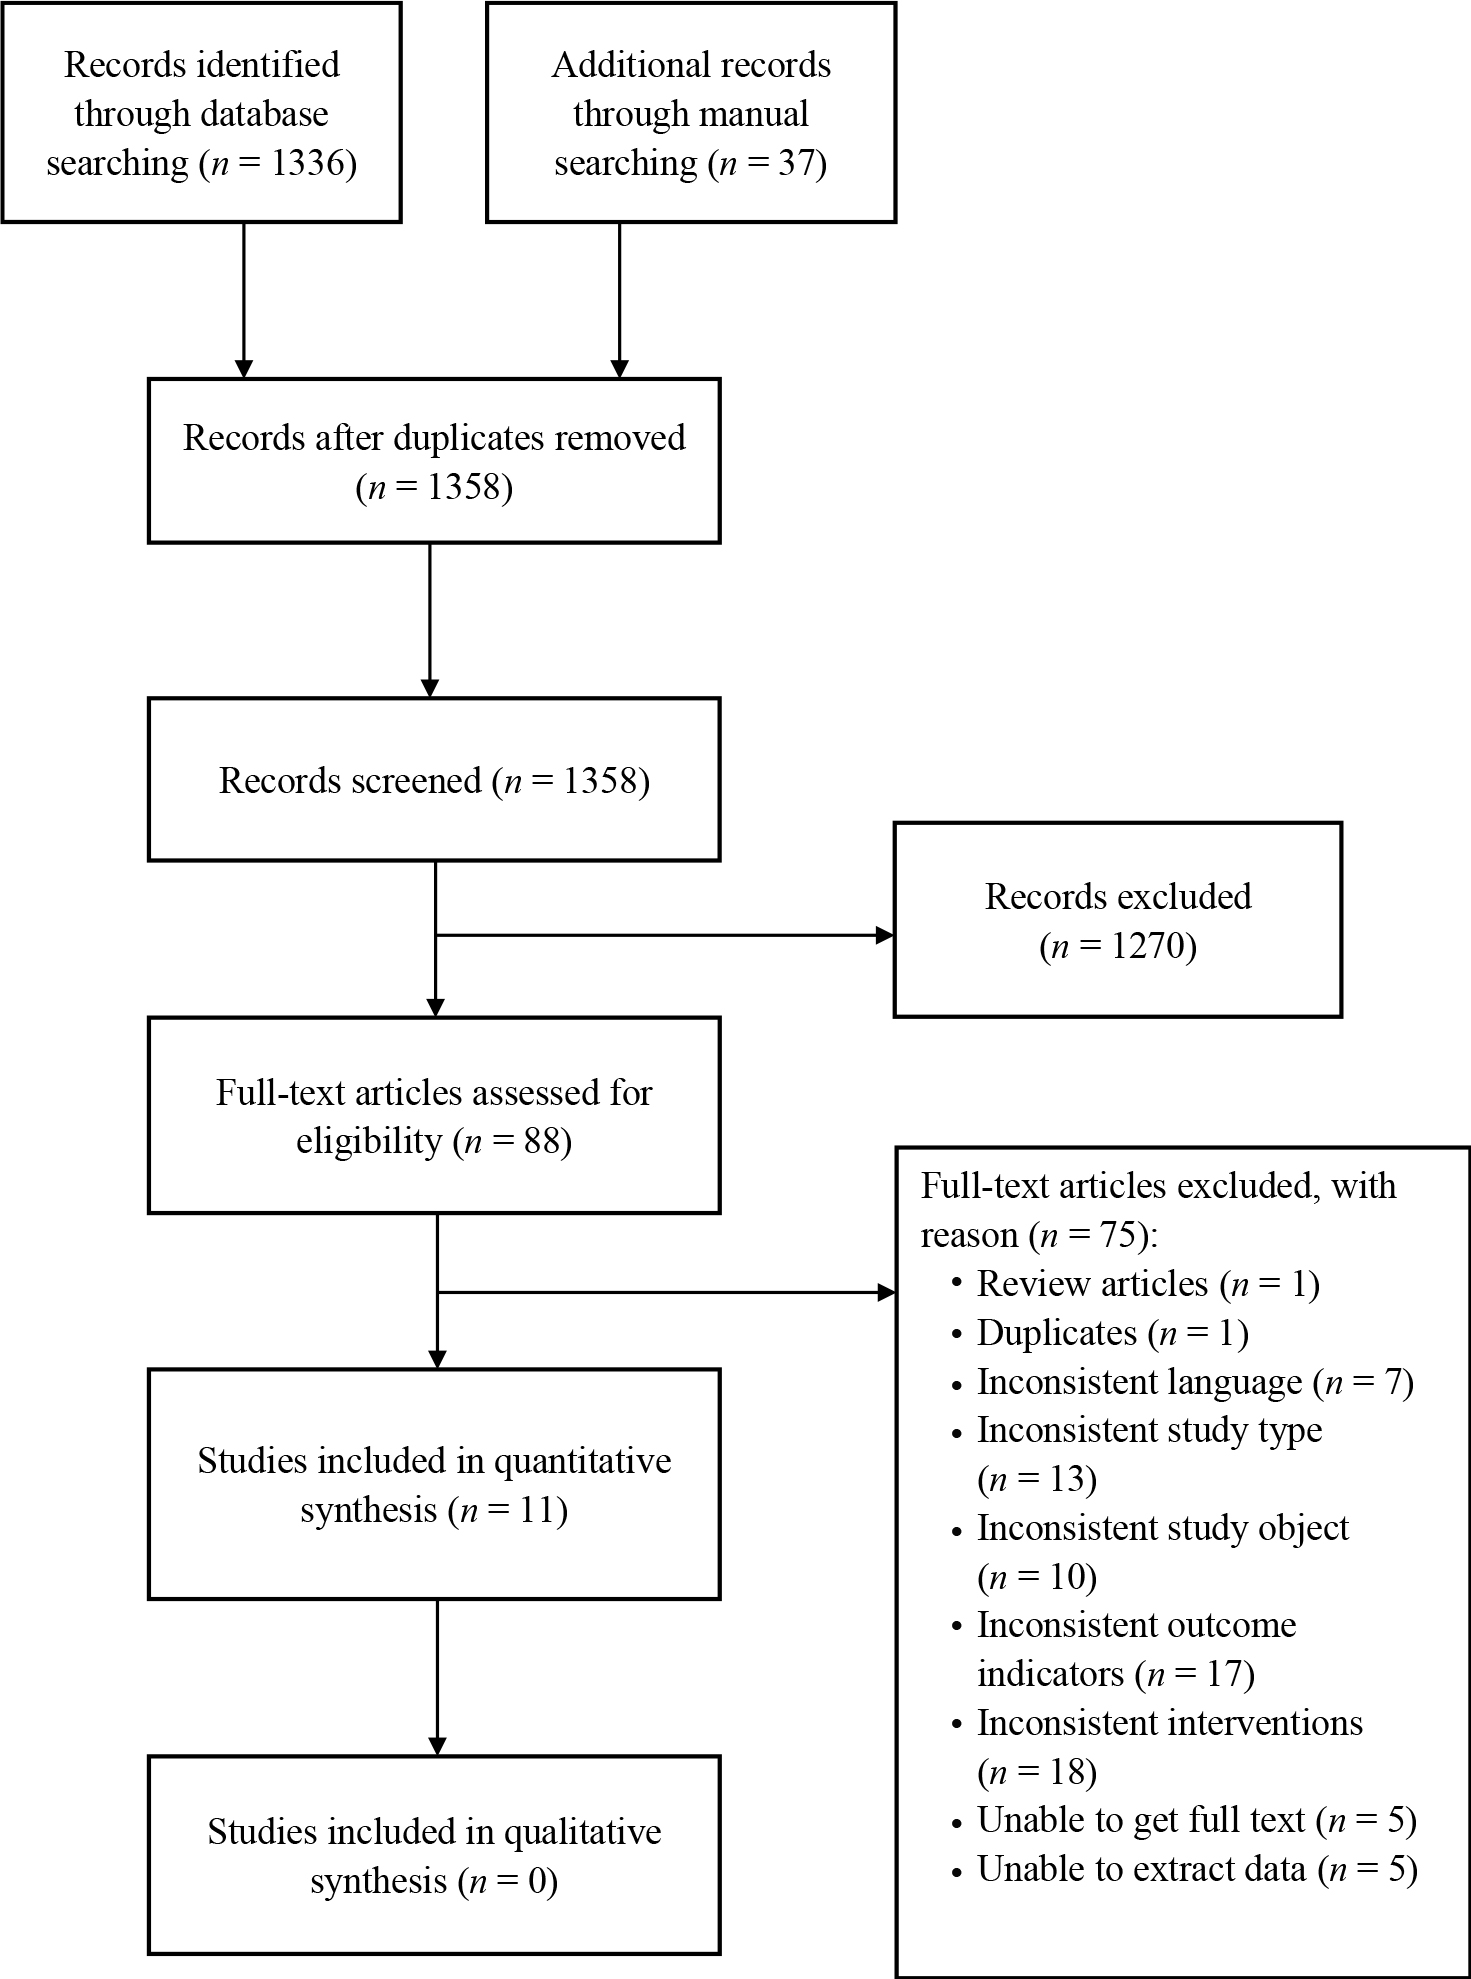
Figure 1.
PRISMA flow diagram for the study selection process.
Table 2.
Characteristics of the included RCT studies.
| Study/country | Cancer type | Sample size | Intervention type | Duration of intervention | No. of sections | Section length | Frequency of intervention | Follow-up | Measurement tools | Outcome indicators | |
|---|---|---|---|---|---|---|---|---|---|---|---|
| Experimental group | Control group | ||||||||||
| Liu et al,14/ China | Unlimited | 30 | 28 | Family task intervention | 4 weeks | 8 | 45 | Twice a week | Immediately after intervention | FFFS | ① |
| Fu et al.9/ China | Hematological tumors | 20 | 20 | Structural family therapy | 8 weeks | 4 | 60 | Every 2 weeks | 1 month after intervention | FAD | ① |
| Hoekstra-Weebers et al,15/ Netherlands | Unlimited | 20 | 21 | Family cognitive behavior intervention | 21 weeks | 7 | 90 | Every 3 weeks | 6 months after intervention | STAI | ② |
| Kazak et al.16/ USA | Unlimited | 129 | 115 | Family cognitive behavior intervention | 1 d | 4 | 60-90 | — | Intervention group: 3-5 months after intervention Control group: 8-10 months after intervention | STAI, PTSD-RI, IES-R | ②④ |
| Kazak et al.17/ USA | Unlimited | 11 | 18 | Family cognitive behavior intervention | 3 weeks | 3 | 45 | Once a week | 2 months after intervention | STAI, ASDS, IES-R | ②④ |
| Stehl et al.18/ USA | Unlimited | 76 | 76 | Family cognitive behavior intervention | 6 weeks | 6 | 45 | Once a week | 1 month after intervention | STAI, ASDS, IES-R | ②④ |
| Shekarabi-Ahari et al,19/ Iran | Unlimited | 10 | 10 | Family cognitive behavior intervention | 8 weeks | 8 | 120 | Once a week | 2 months after intervention | BYI | ③ |
| Marsland et al,20/ USA | Unlimited | 23 | 14 | Family cognitive behavior intervention | 12-18 weeks | 6 | 30-60 | Every 2-3 weeks | 2 weeks after intervention | STAI, BYI, IES | ②③④ |
| Cernvall et al.6/ Sweden | Unlimited | 31 | 27 | Family cognitive behavior intervention | 10 weeks | 10 | 240 | Once a week | 12 months after intervention | BYI, PCL-C | ②③④ |
| Tsitsi et al,21/ Cyprus | Unlimited | 29 | 25 | Family relaxation therapy | 3 weeks | 3 | 25 | Once a week 25 min each time | 3 weeks after intervention | HAM-A POMS | ②③ |
| Salem et al.22/ Denmark | Unlimited | 82 | 79 | Family cognitive behavior intervention | ≤24 weeks | 7 | 60-90 | Unclear | 12 months after intervention | SCL-92-R Harvard Trauma Questionnaire | ②③ |
1 Note1. ASDS, Acute Stress Disorder Scale; BYI, Beck Youth Inventory; FAD, Family Assessment Device; FFFS, Feetham Family Functioning Survey; HAM-A, Hamilton’s Anxiety Scale; IES, Impact of Events Scale; IES-R, Impact of Events Scale-Revised; PCL-C, PTSD Checklist-Civilian Version; POMS, Profile of Mood States Brief Scale; PTSD-RI, Post-Traumatic Stress Disorder Reaction Index; RCT, randomized control trial; SCL-92-R, Symptom Checklist-92-Revised; STAI, State-Trait Anxiety Inventory,; ①, family function; ②, anxiety; ③, depression; ④, PTSD.
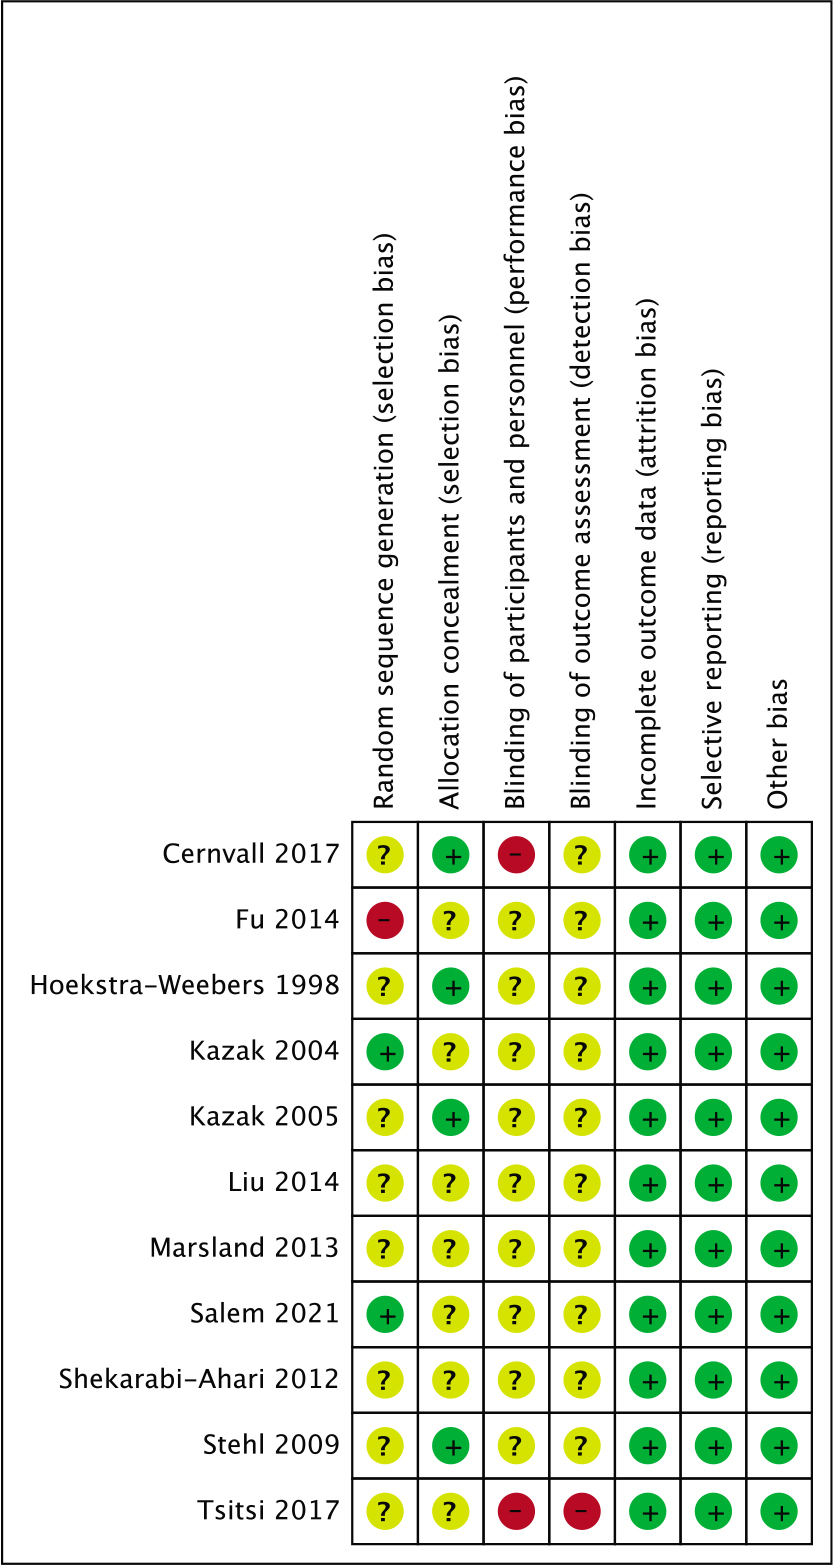
Figure 2.
Risk of bias summary: assessment of each risk bias item for the individual studies.
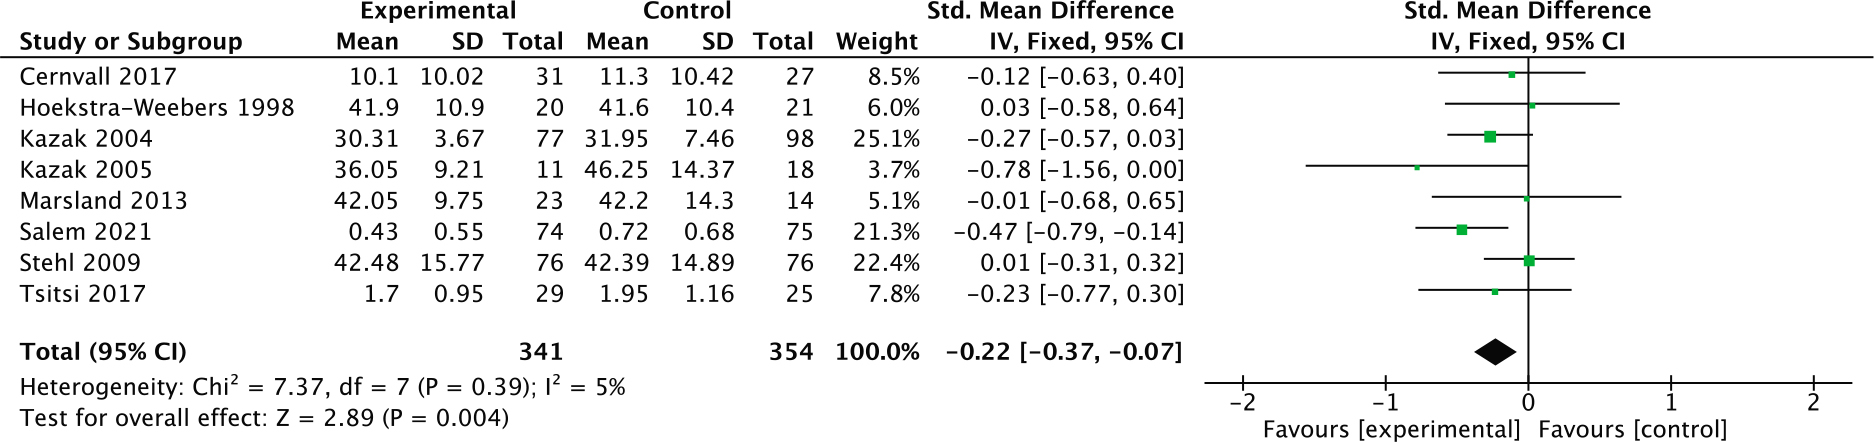
Figure 3.
Forest plot: effect of family psychosocial intervention on caregiver anxiety level.

Figure 4.
Forest plot: effect of family psychosocial intervention on caregiver depression level.
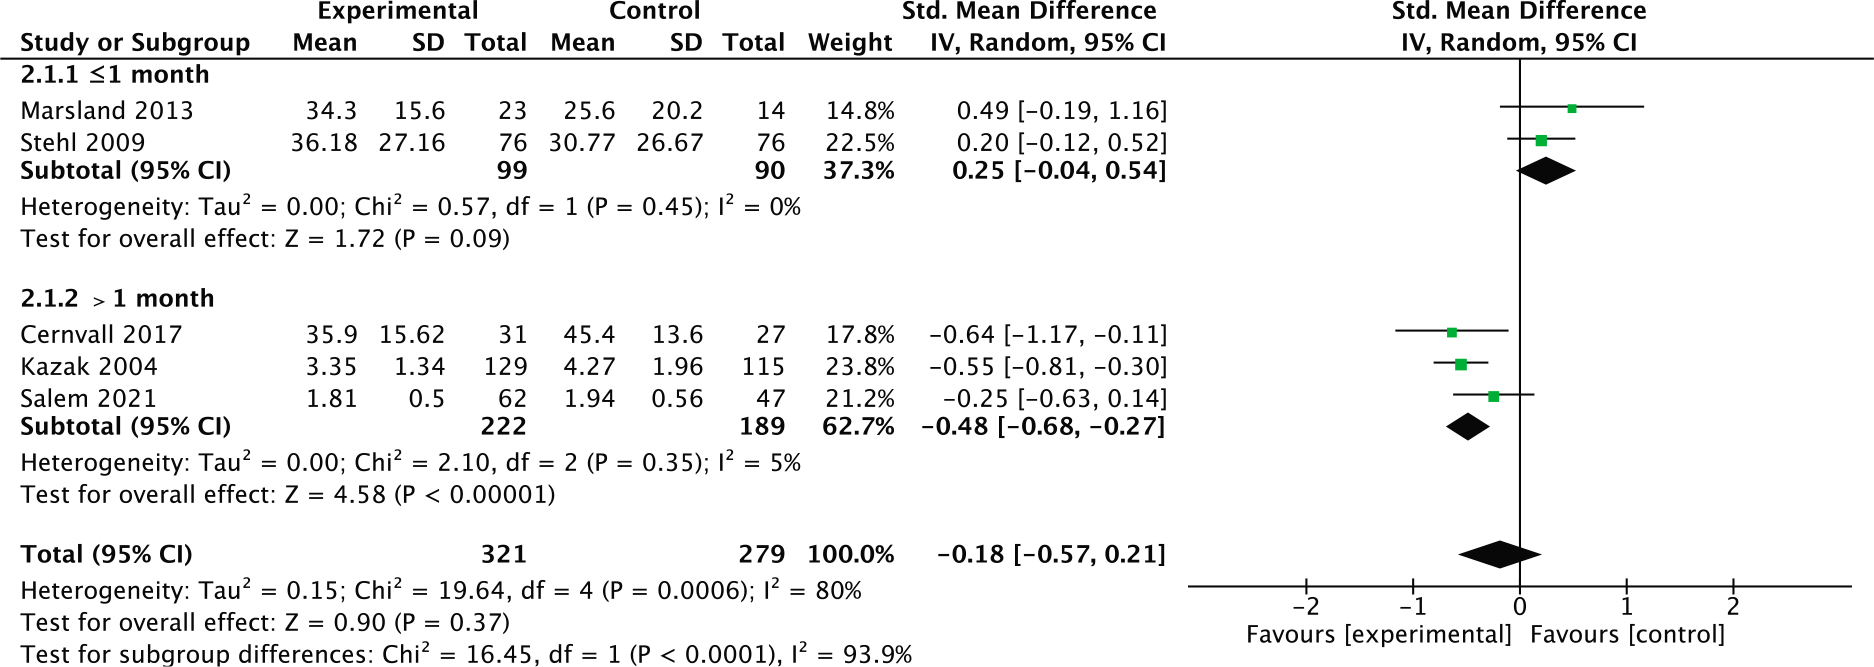
Figure 5.
Forest plot: subgroup analysis of the effects of family psychosocial intervention on caregiver PTSD symptoms.

Figure 6.
Forest plot: effect of family psychosocial intervention on family function.