

Figure 1
Flowchart of the studies selection process.
Table 1
Baseline characteristics of included studies.
| Study | Country | Design | Intervention group (Rigmen) | Control group (Rigmen) | Prep score | Main outcomes |
|---|---|---|---|---|---|---|
| Kim et al. 200510 | Korea | RCT | Drink 250 mL of PEG solution and then walk at least for 5 min at intervals of 10 min (n = 182) | Routine care (n = 174) | Grade score |
|
| Fang et al. 201711 | China | RCT | Walk 30 min after each meal 3 days before the colons copy and walk for 1 h after taking the medicine on the day of colonoscopy (n = 34) | Routine care (n = 34) | Grade score |
|
| Chen et al. 201812 | China | RCT | Drink 250 mL of PEG solution and then walk at least for 200 steps (n = 60) | Routine care (n = 60) | BBPS |
|
| Zhang et al. 201713 | China | CCT | Drink 600 mL of PEG solution and then walk for 15 min (n = 110) | Routine care (n = 110) | OBPS |
|
| Qin et al. 201616 | China | RCT | Walk more than 10 min after ingesting each liter of PEG solution (n = 110) | Routine care (n = 110) | BBPS |
|
[i] Notes: OBPS, Ottawa bowel preparation score; BBPS, Boston bowel preparation score; RCT, Randomized controlled trial; CCT, Controlled clinical trial.

Figure 2
Risk of bias graph: reviewers’ judgments about each risk of bias item presented as percentages across all included studies.
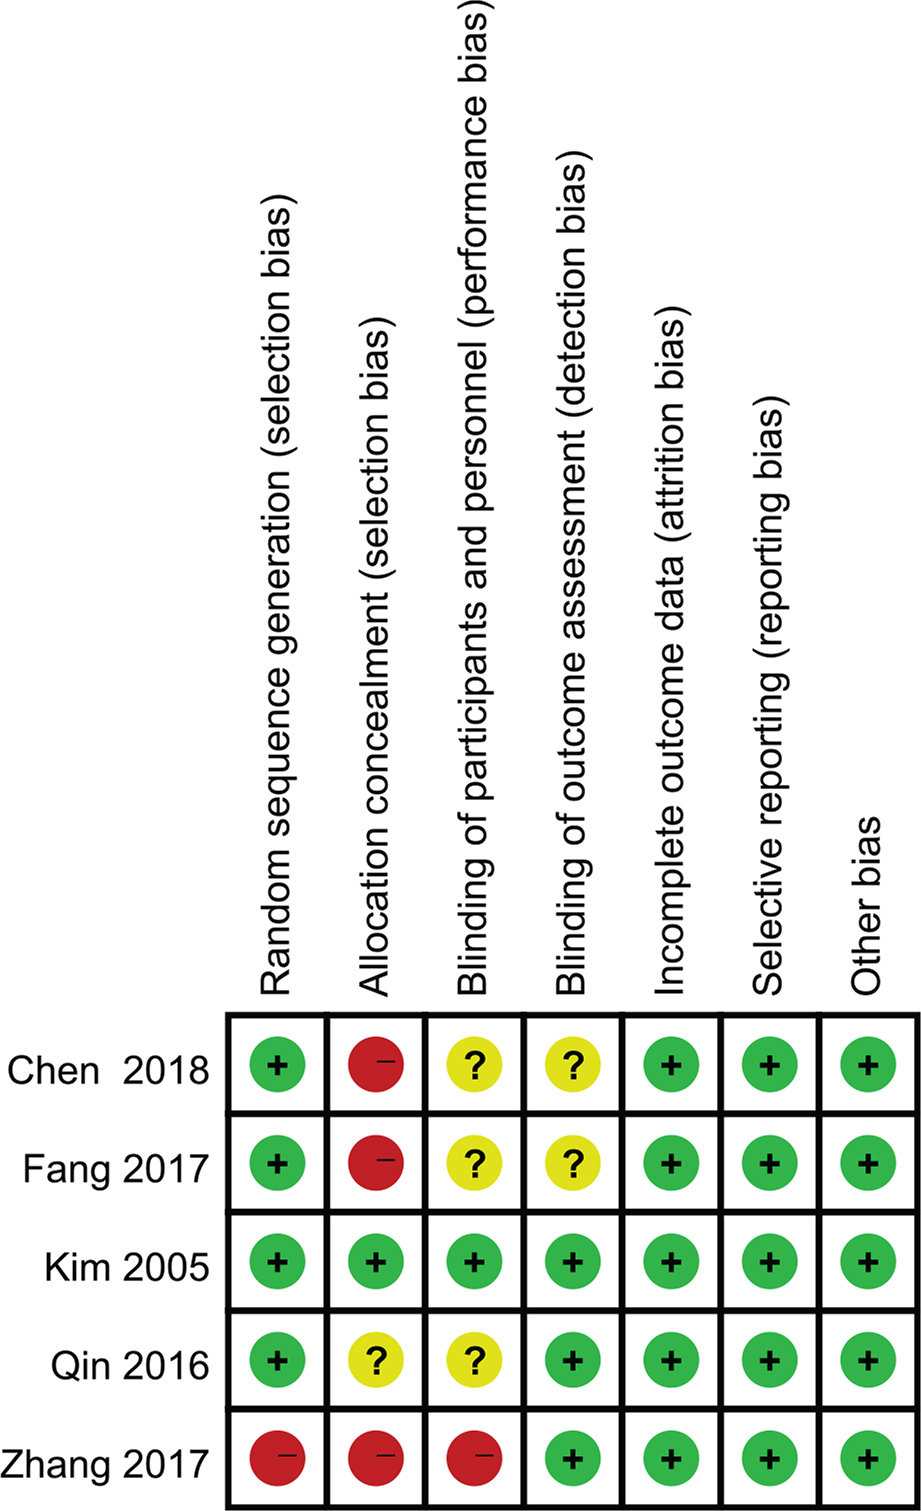
Figure 3
Risk of bias summary: reviewers’ judgments about each risk of bias item for each included study.

Figure 4
The rate of adequate bowel preparation.
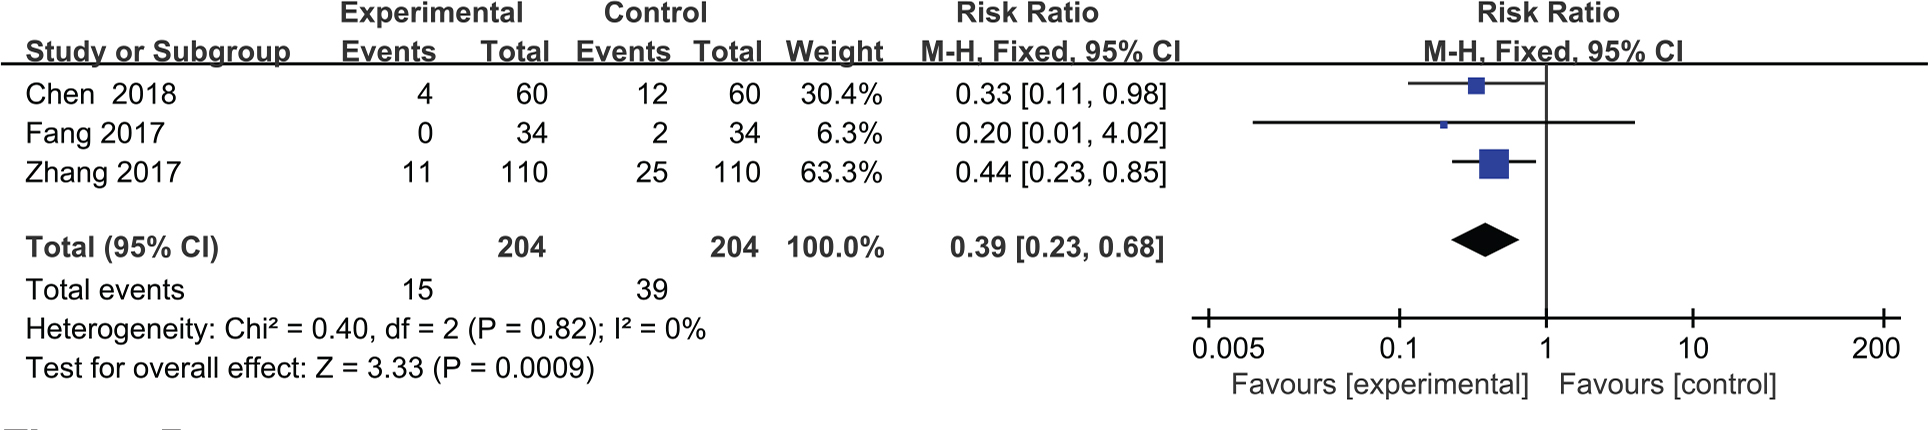
Figure 5
The incidence of vomiting.

Figure 6
The incidence of abdominal pain.