

Figure 1.

Figure 2.

Figure 3.

Figure 4.

Figure 5.

Figure 6.

Figure 7.
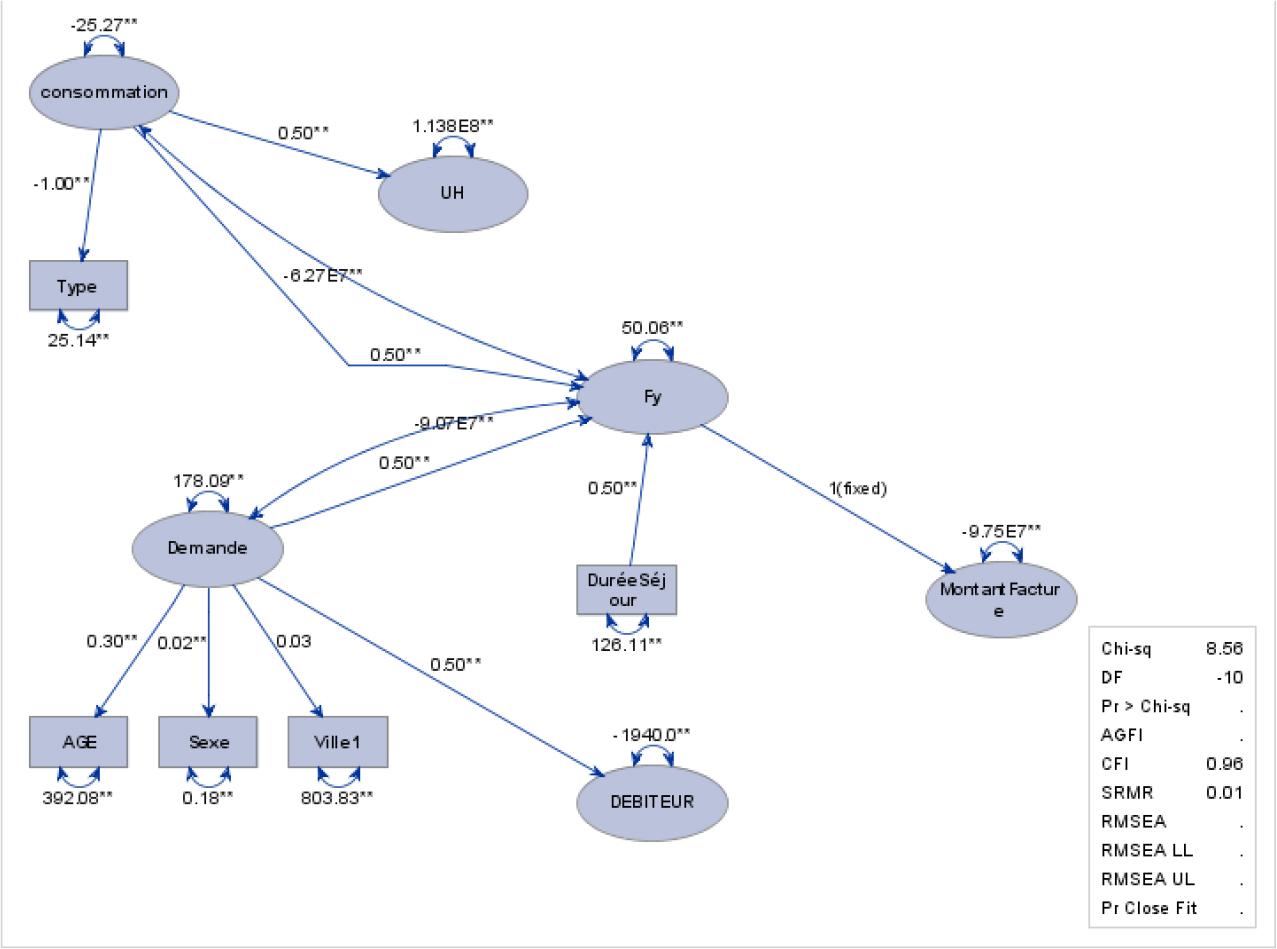
Figure 8.
Gender analysis of beneficiaries (Source: Author’s own research)
| Gender | Number | Percentage | Cumulative number | Cumulative % |
|---|---|---|---|---|
| Man | 8227 | 45.80 | 8227 | 45.80 |
| Women | 9736 | 54.20 | 17,963 | 100.00 |
| Total | 17,963 | 100.00 | 17,963 | 100.00 |
Type of coverage (Source: Author’s own research)
| Coverage | Number | Percentage |
|---|---|---|
| Far | 12,530 | 69.75 |
| CNOPS | 2705 | 15.06 |
| DIRECT PAYMENT | 2000 | 11.13 |
| DNA | 331 | 1.84 |
Descriptive statistics (amount invoiced) (Source: Author’s own research)
| Average | Median | Maximum | Minimum | Typical deviation | Jarque–Bera |
|---|---|---|---|---|---|
| 6284 | 3000 | 320,000 | 32 | 13,000 | Prob (0.00) |
Presentation of SEM structure (Source: Author’s own research)
| Variable | Estimate | Standard error | Value of the t-test | Pr > |t| |
|---|---|---|---|---|
| Age | 392.07850 | 5.11595 | 76.6384 | <0.0001 |
| City1 | 803.83147 | 8.72375 | 92.1429 | <0.0001 |
| Sex | 0.18436 | 0.01172 | 15.7296 | <0.0001 |
| DEBTOR | -1940 | 0 | - | . |
| Fy | 50.05812 | 0 | - | . |
| Length of stay | 126.11341 | 1.36793 | 92.1928 | <0.0001 |
| Request | 178.08767 | 0.20671 | 861.5 | <0.0001 |
| Consummation | -25.27073 | 0.0001509 | -167412 | <0.0001 |
| Type | 25.14150 | 0.0001524 | 165011 | <0.0001 |
| Uh | 113834419 | 0 | - | . |
| Invoice amount | -97497550 | 0 | - | . |