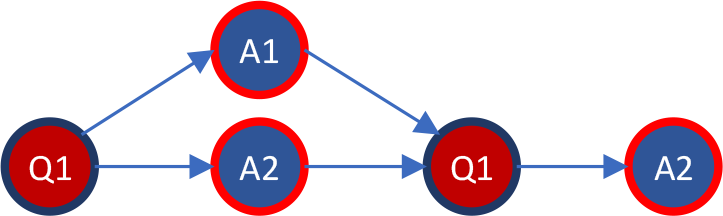
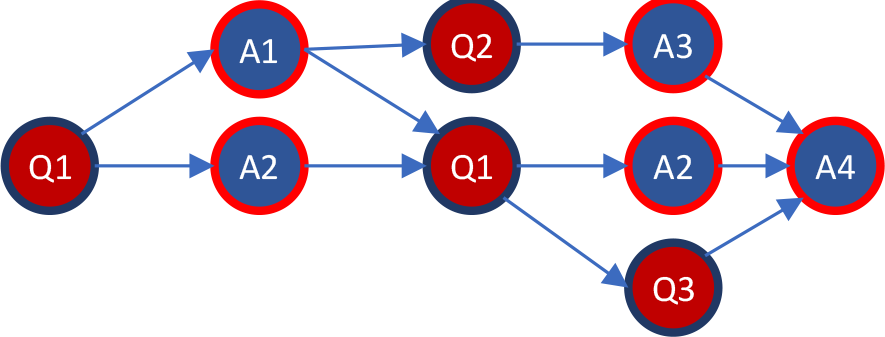
Figure 1.
An outside view of conversations
(Source: Own elaboration)
Table 1.
Conversation measures
(Source: Authors’ own research)
| Measure | Description | Modified from |
|---|---|---|
| Initiator rank in order of previous experience/participation | The initiator’s rank with respect to others based on the total number of messages posted in a network | Wasko and Faraj, 2005 |
| Initiator role | The initiator’s role in a network, i.e., admin or member | Hafeez, et al., 2019 |
| Initiator total no. of messages | The total number of messages the initiator has sent | Pudipeddi, Akoglu and Tong, 2014 |
| Initiator total no. of conversations | The total number of conversations in which the initiator has been involved | |
| Initiator gender | --- | Dror, et al., 2012 |
| Time from the first message in the network | The time interval between an initiator’s first message in a network and the last | Hafeez, et al., 2019 |
| Date and time of the first message of the conversation | Date and time of the initiator’s first message in a conversation | Dror, et al., 2012 |
| Topic | The topic of conversation | Hafeez, et al., 2019 |
| Question or statement? | Indicates whether the first message in a conversation is stated as a question or not | Campbell and Mayer, 2009 |
| Question word | Indicates the type of question posted in the first message in a conversation | Zaib, et al., 2021 |
| Completeness and clearance | The extent to which the information provided by the initiator to explain the question is clear and complete (based on text, references, attachments, and/or pictures) | Arguello, et al., 2006 |
| Formal or informal | The formality of the first message of a conversation | Joyce and Kraut, 2006 |
| Calling-out | Indicates whether the initiator specifically invites or names individuals to participate in a conversation | Wilen, 1991 |
| Acknowledgment and feedback | Indicates acknowledgments and feedback in conversation messages, e.g., “like,” “thank you,” emoji | Bornfeld and Rafaeli, 2019 |
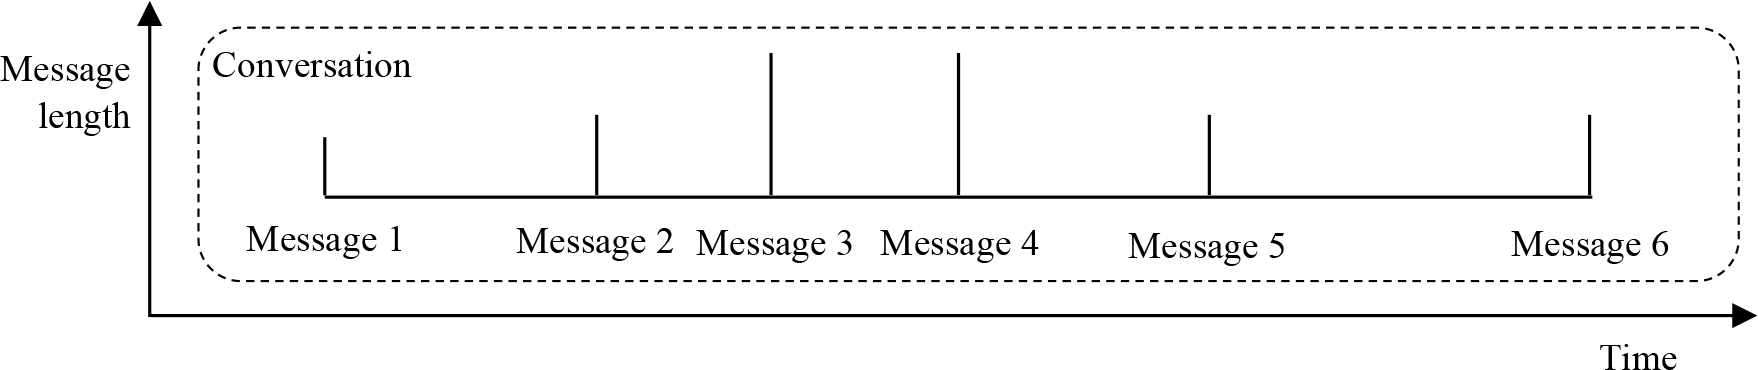
Figure 2.
An inside view of conversations
(Source: Own elaboration)
Table 2.
Participation measures
(Source: Authors’ own research)
| Measure | Description | Modified from |
|---|---|---|
| No. of messages | The number of messages in a conversation | Guan, et al., 2018 |
| No. of participants | The number of users (specialists) who participate in a conversation | de Laat, 2002 |
| Average message length | The average number of characters in a message per conversation | Hafeez, et al., 2019 |
| Messaging average time interval | The average time interval between messages per conversation | Anderson, et al., 2012 |
| Duration of a conversation | The time difference between the first and last message of a conversation | Hafeez, et al., 2019 |
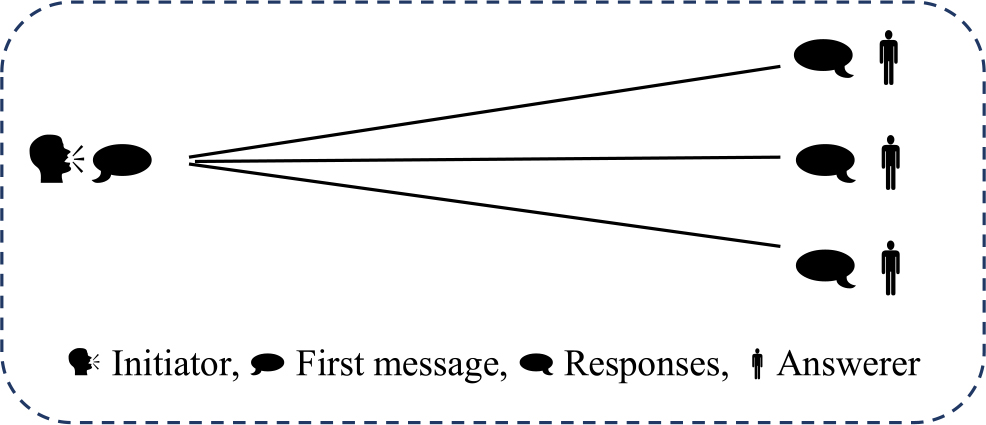
Figure 3.
Social network elements in a conversation
(Source: Own elaboration)
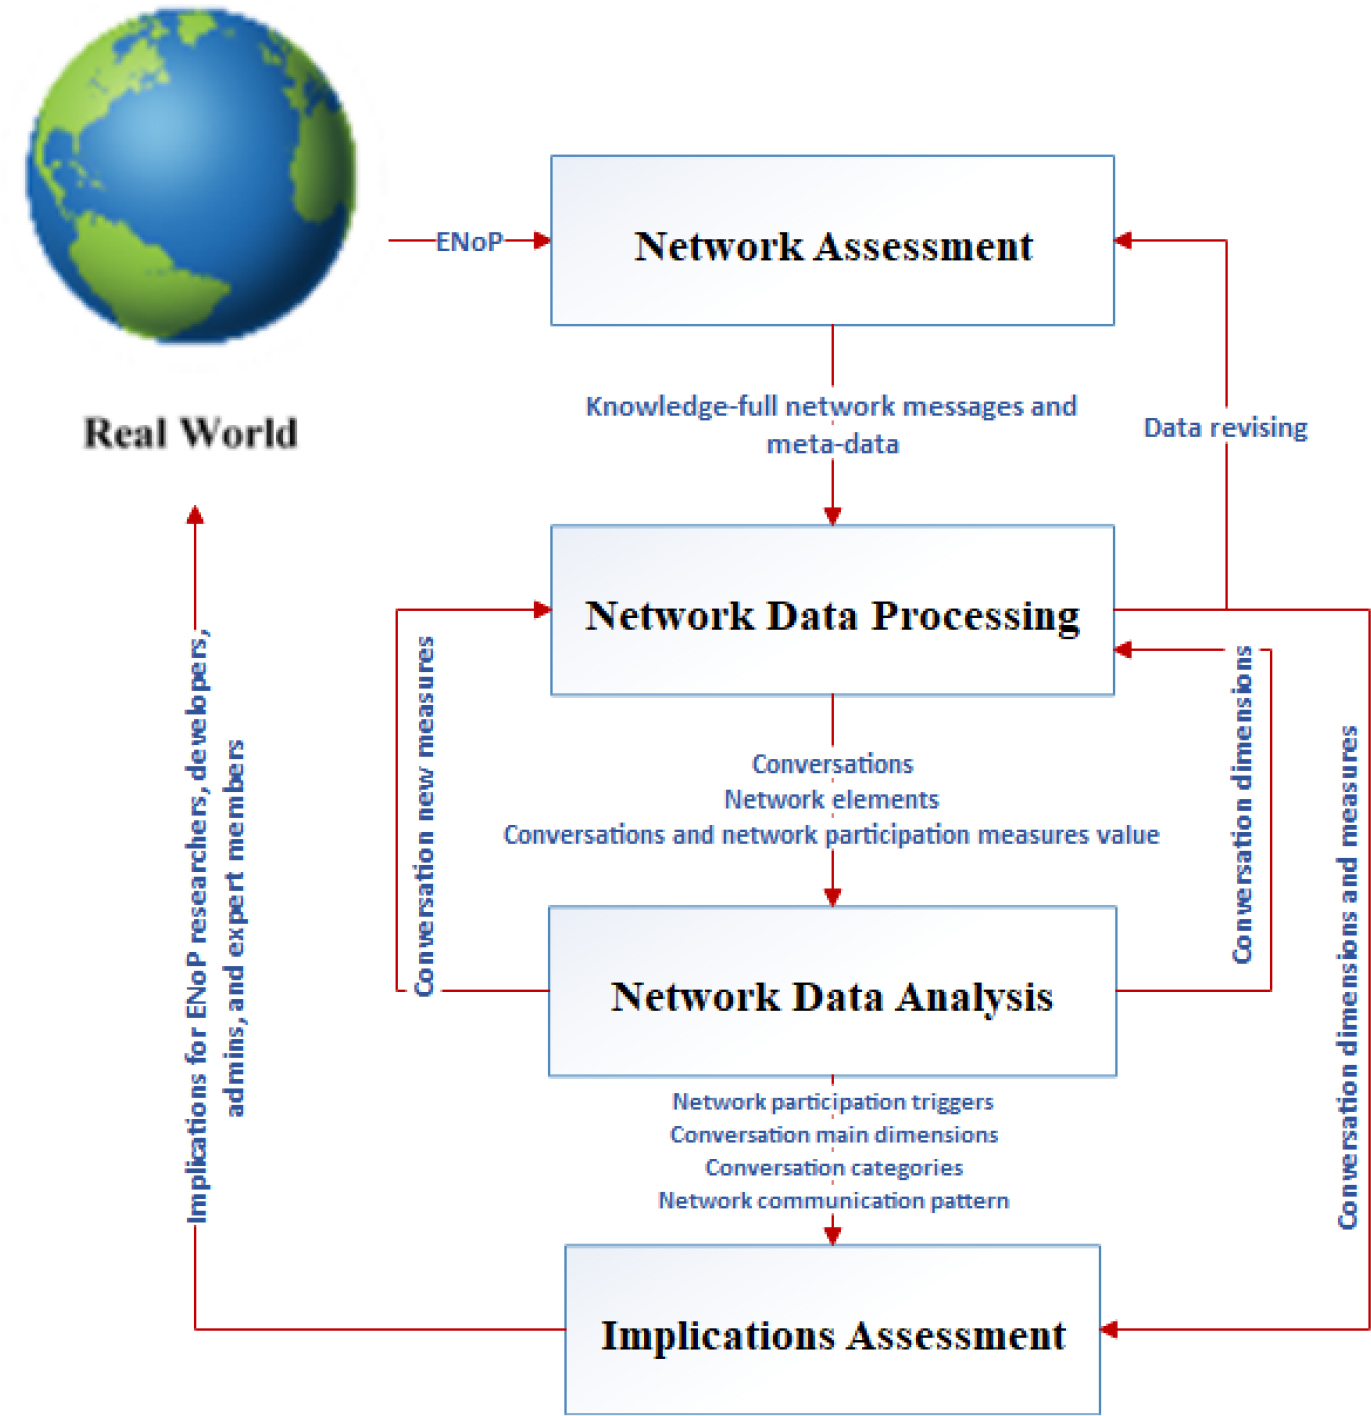
Figure 4.
Data analysis methodology for participation in ENoPs
(Source: Own elaboration)
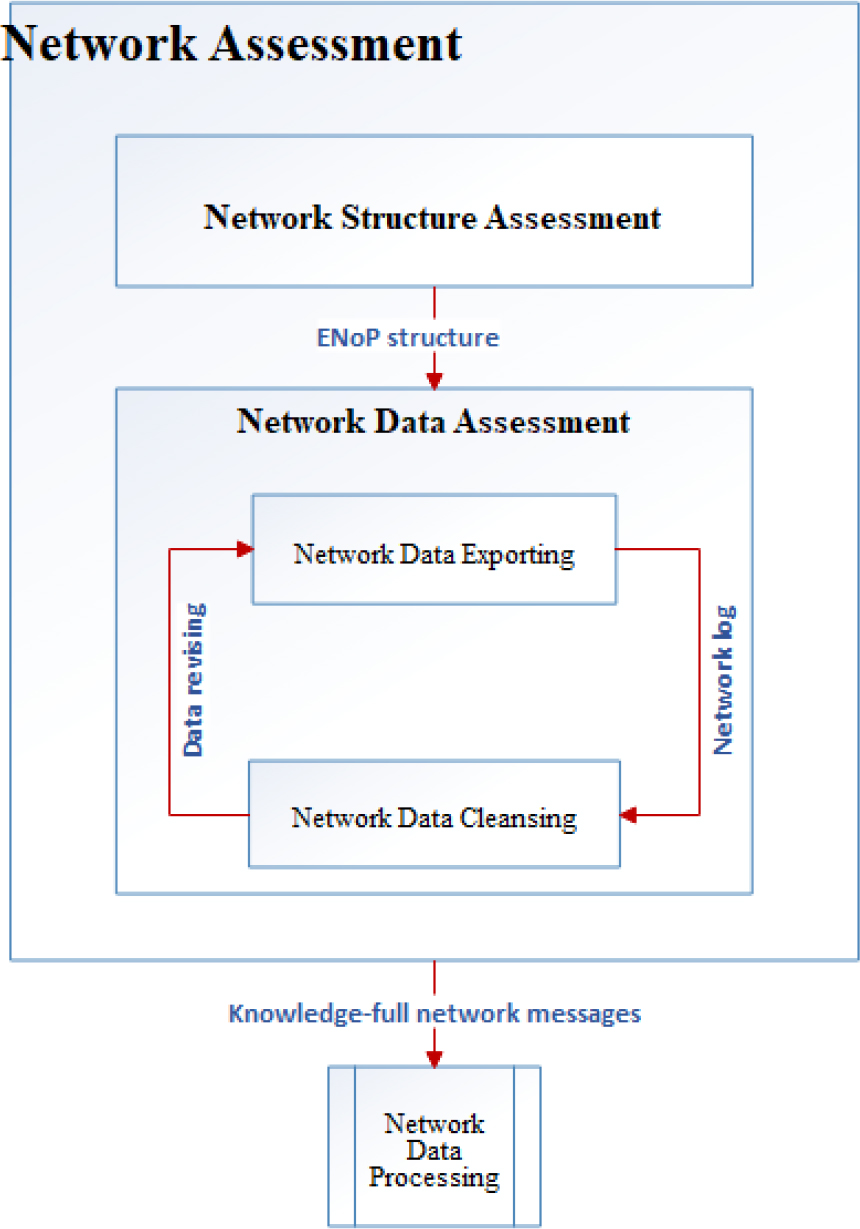
Figure 5.
Network assessment process
(Source: Own elaboration)
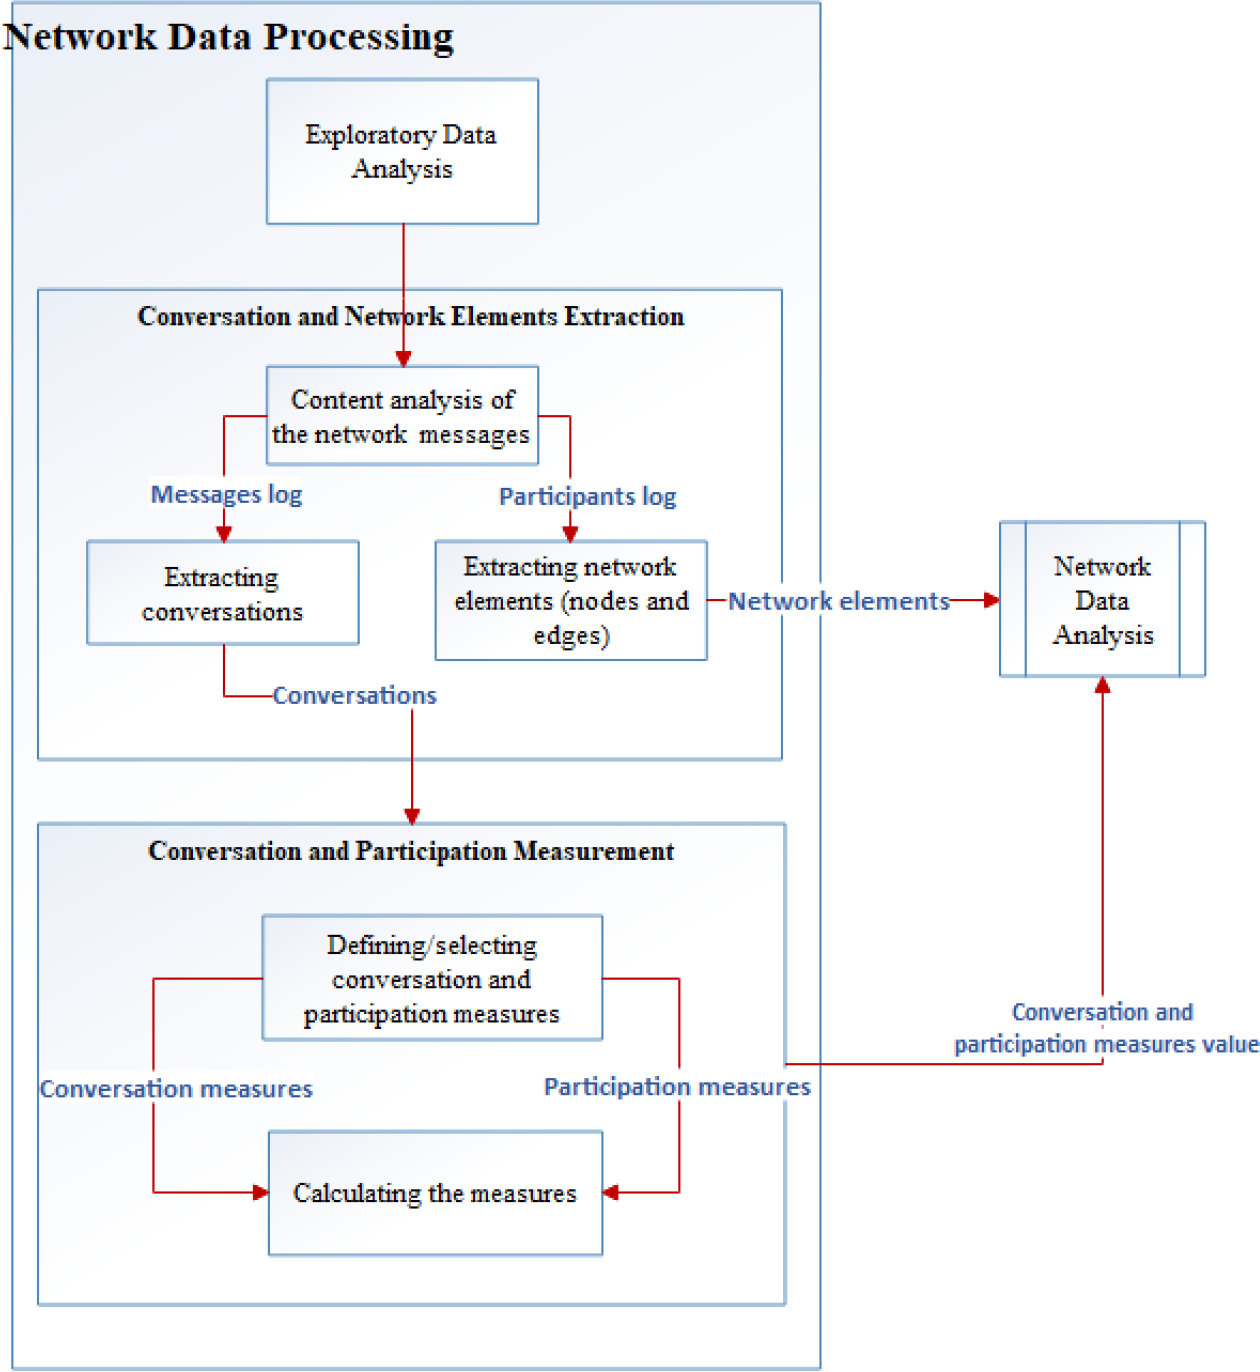
Figure 6.
Process of network data processing
(Source: Own elaboration)
Table 3.
Conversation possible border signs
(Source: Authors’ own research)
| Conversation Border signs | Explanation | Sample |
|---|---|---|
| Initiation words | Words with which a conversation begins | “Hello,” “Dear,” “Please look at the files,” “Good day” |
| Files | The inclusion of files can indicate a new topic | --- |
| Content | Changing the topic | --- |
| Messages’ connections | Replies and references to previous messages in another conversation (It shows this message is a part of the other conversation and in the border of that conversation.) | The connection between the first message of participant III and the second message of participant V in Figure 7. |
| Closure words | Acknowledgment and feedback | “like,” “thank you,” emoji |
Table 4.
Proposed conversation measures
(Source: Authors’ own research)
| Measure | Description |
|---|---|
| Initiator field | Professional field of the initiator |
| Initiator city | --- |
| Initiator country | --- |
| Holiday? | If the start date of the conversation is a weekend/holiday or not |
| Date and time of the last message of the conversation | Data and time of the last message in a conversation |
| The time interval from the previous conversation | The difference between the start dates/times of one conversation and the previous one |
| The time interval from the next conversation | The difference between the start dates/times of one conversation and the next |
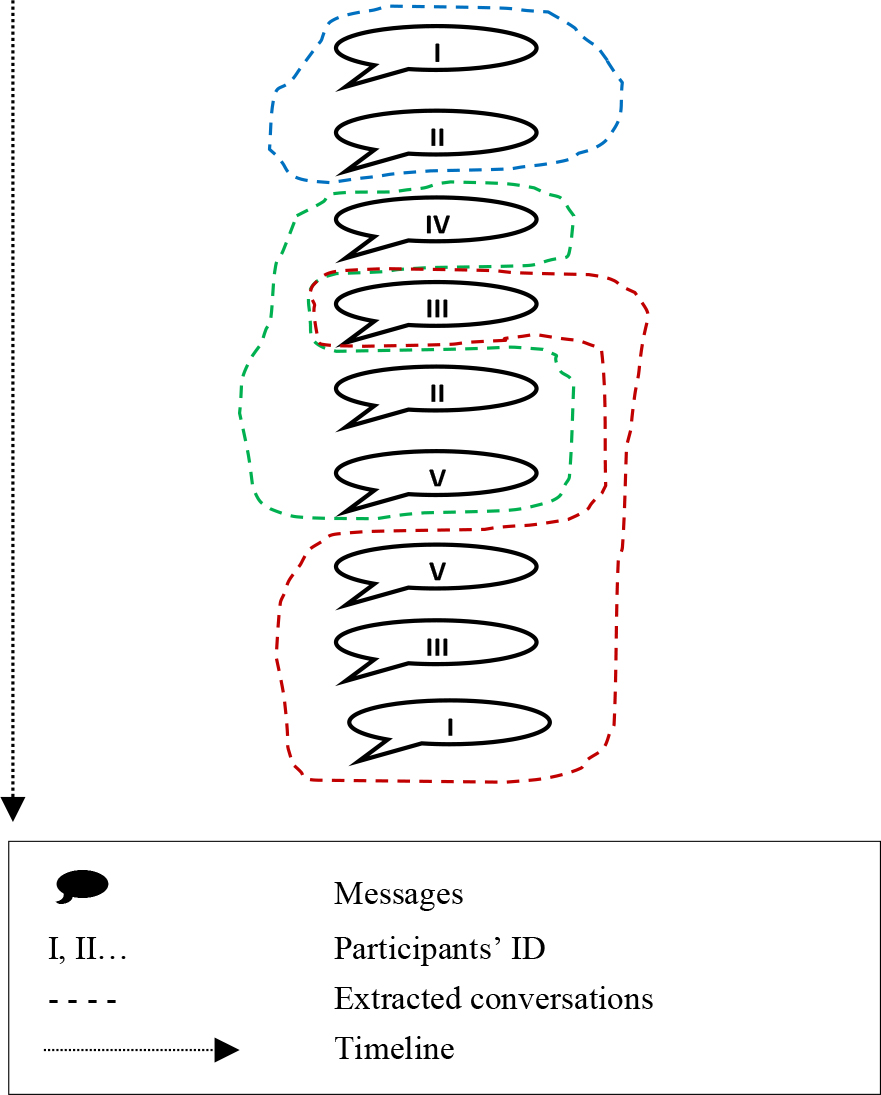
Figure 7.
A sample structure of message-based conversations
(Source: Own elaboration)
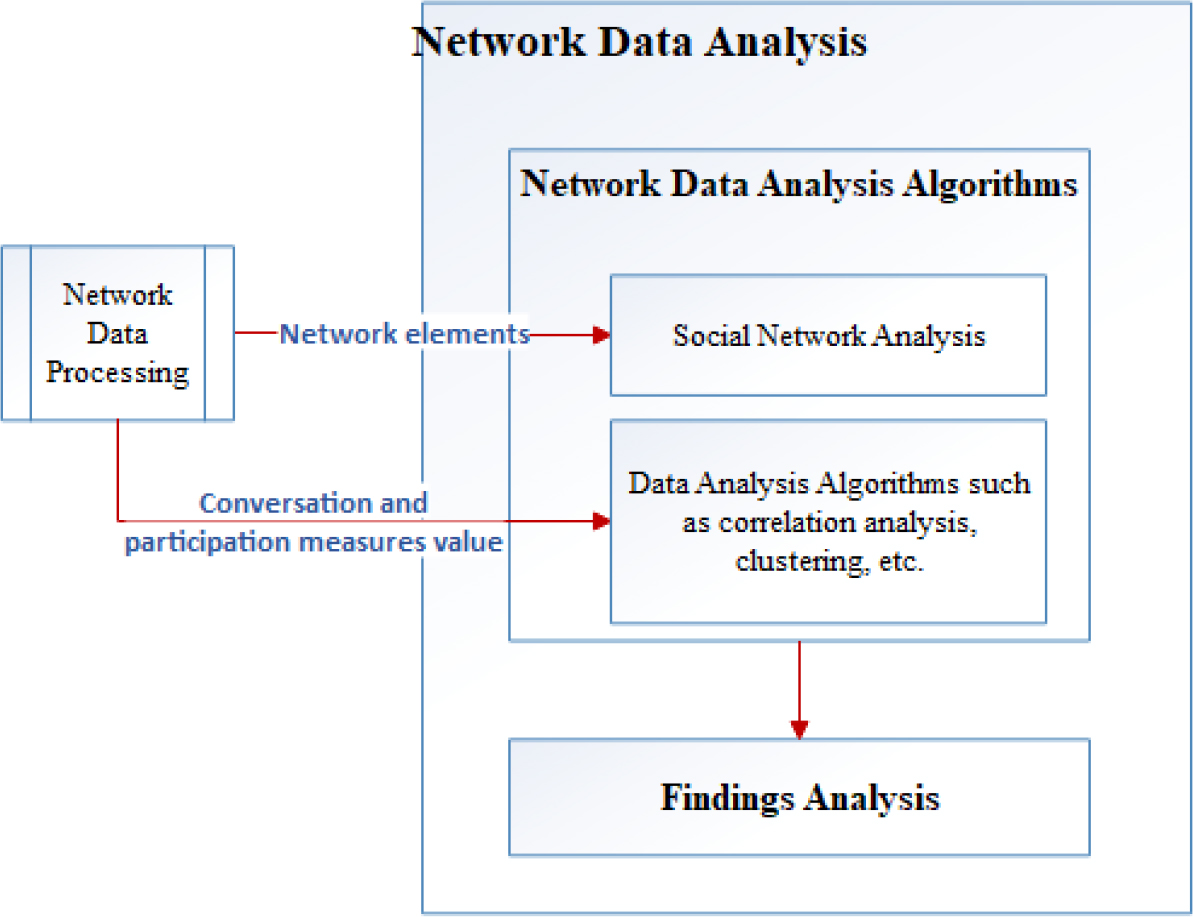
Figure 8.
Network data analysis process
(Source: Own elaboration)
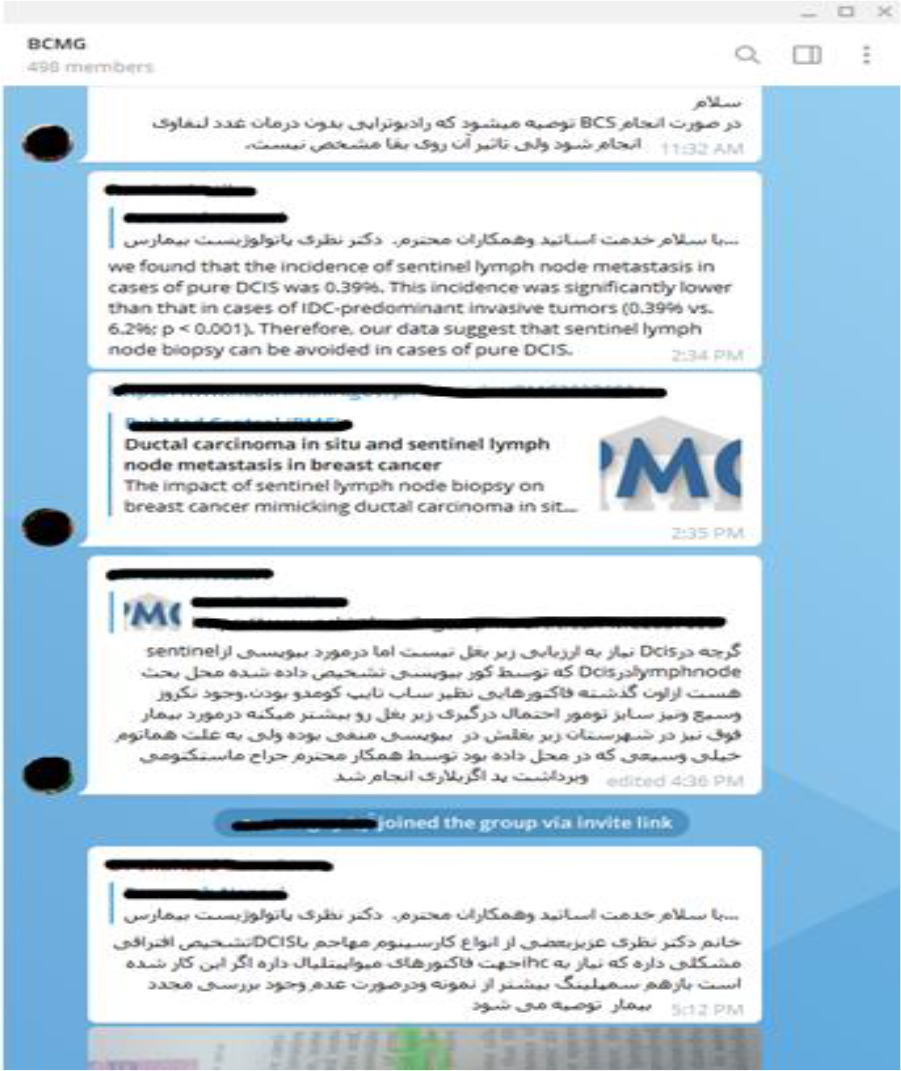
Figure 9.
A screenshot from the BCMG network
(Source: Own elaboration)
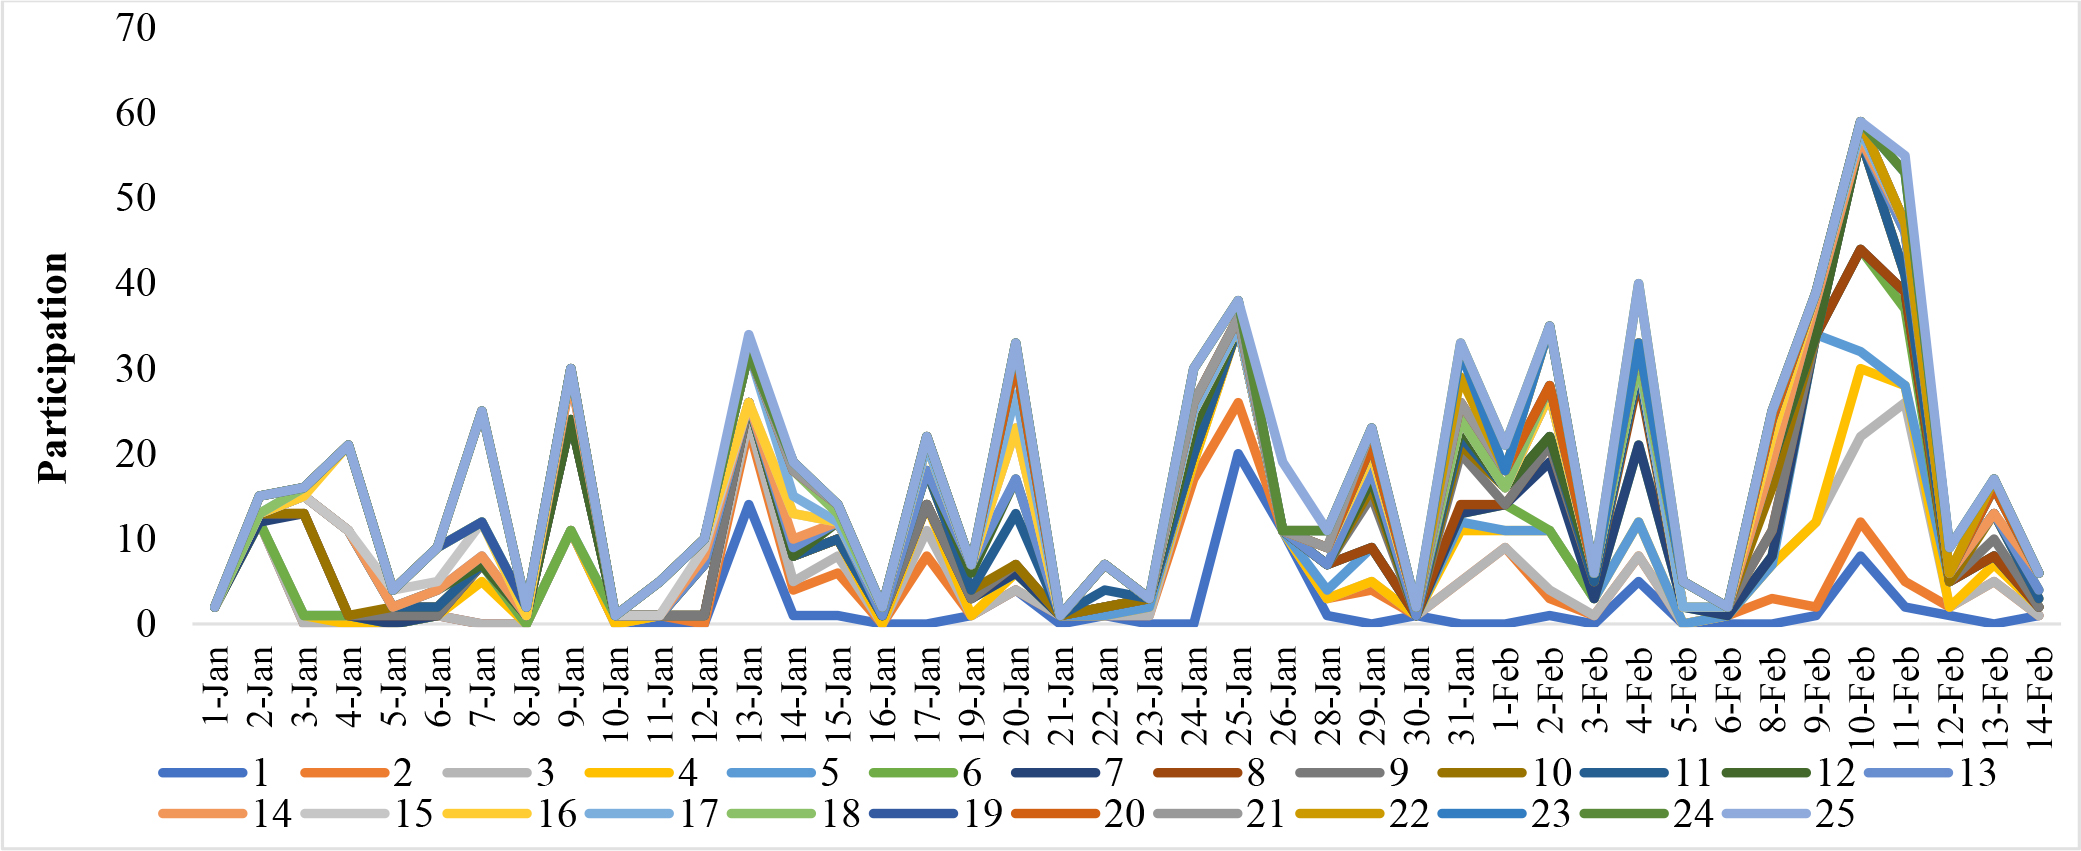
Figure 10.
The trend of participation for 25% of the most active participants
(Source: Authors’ own research)
Table 5.
Border signs identified in the BCMG
(Source: Authors’ own research)
| Conversation Border signs | Sample |
|---|---|
| Initiation words | “Hi colleagues,” “Dear colleagues,” “Please look at the files,” “Good day,” “Please consider my patient case,” “A patient…” |
| Files | Photos containing MRI and CT scans or files with laboratory and pathology reports |
| Content | Messages referring to treatment, diagnosis, or screening |
| Messages’ connections | Replies and references to the previous messages of the conversation |
| Closure words | “Like,” “thank you,” emoji |
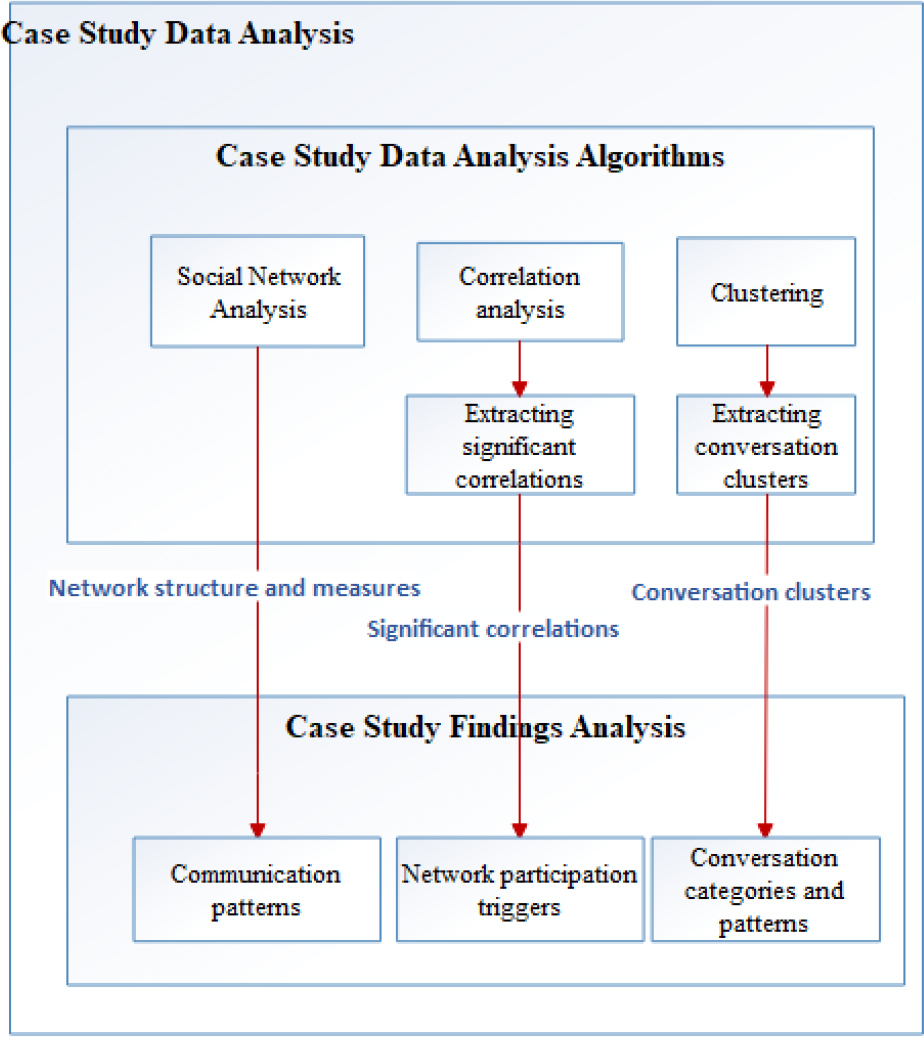
Figure 11.
Data analytical processes applied to the case
(Source: Own elaboration)
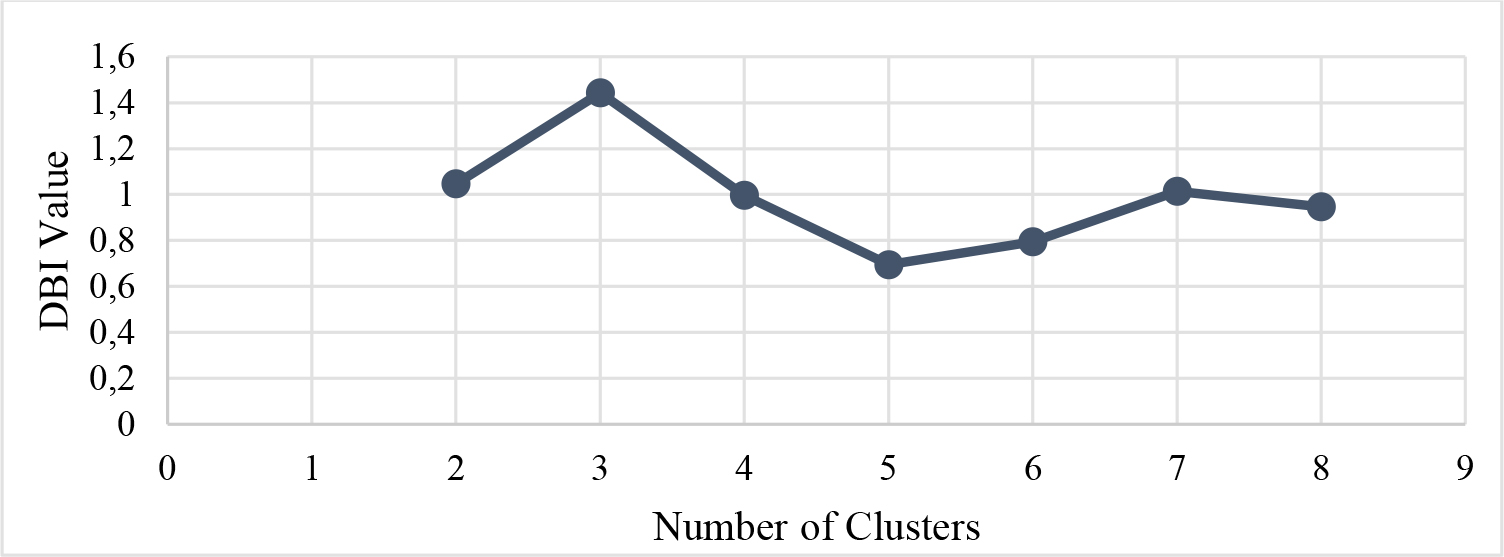
Figure 12.
Davies–Bouldin index (DBI) for k clusters
(Source: Authors’ own research)
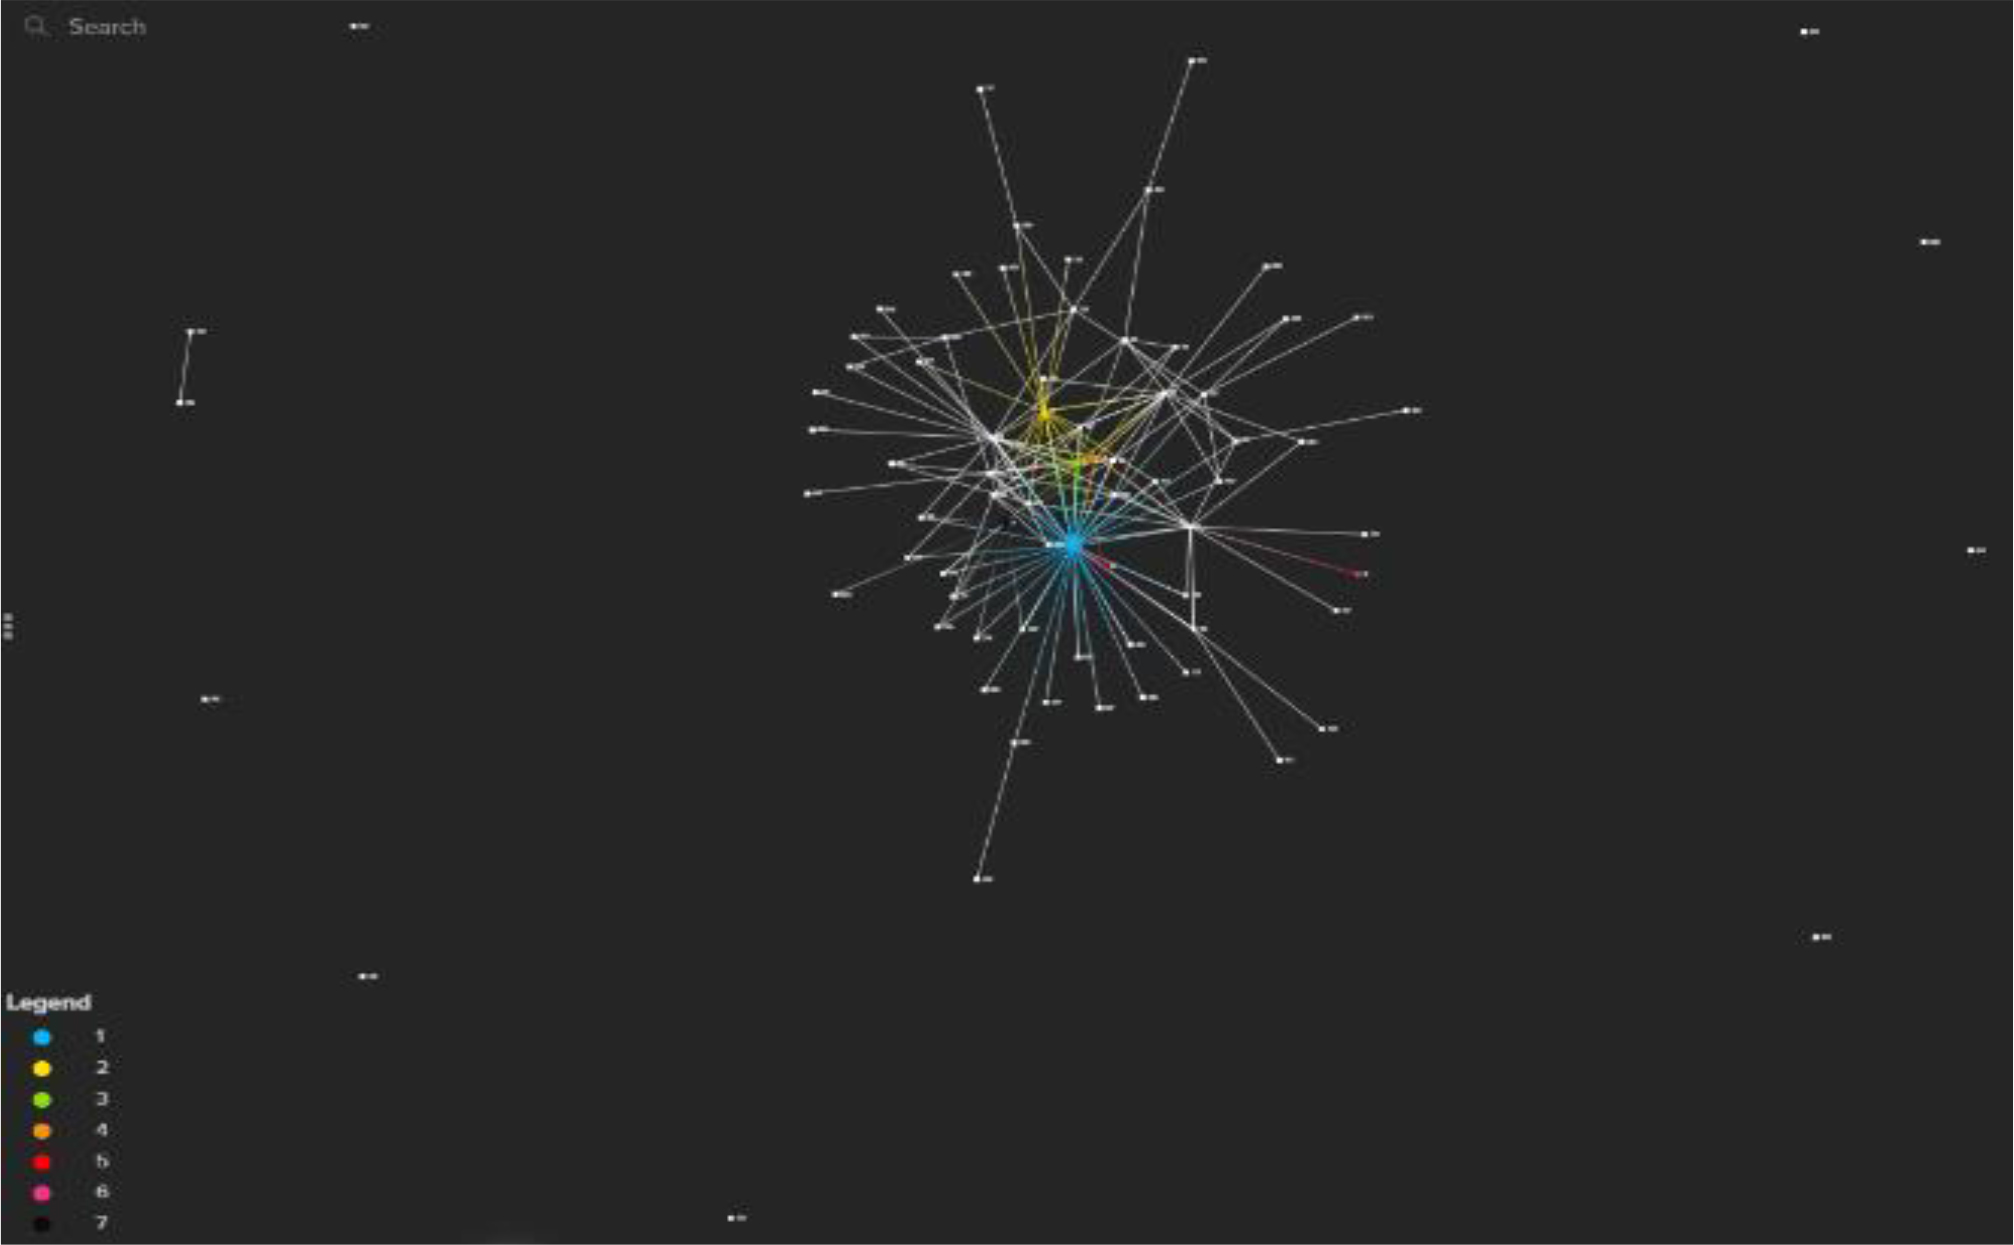
Figure 13.
The network structure of the BCMG sample
(Source: Authors’ own research)
Table 6.
Social network analysis results for 25% of the most active participants
(Source: Authors’ own research)
| Participant | Degree | Closeness | Betweenness | Size | Indegree | Outdegree | Eigenvector | Reach | Reach-efficiency | MICMAC |
|---|---|---|---|---|---|---|---|---|---|---|
| 1 | 63 | 0.64 | 0.42 | 35 | 63 | 63 | 0.12 | 0.82 | 0.02 | 0.66 |
| 2 | 25 | 0.53 | 0.15 | 19 | 25 | 25 | 0.07 | 0.76 | 0.04 | 0.95 |
| 3 | 18 | 0.47 | 0.02 | 11 | 18 | 18 | 0.06 | 0.72 | 0.07 | 0.86 |
| 4 | 15 | 0.48 | 0.03 | 11 | 15 | 15 | 0.05 | 0.77 | 0.07 | 0.89 |
| 5 | 8 | 0.41 | 0.00 | 6 | 8 | 8 | 0.04 | 0.56 | 0.09 | 0.77 |
| 6 | 1 | 0.31 | 0.00 | 2 | 1 | 1 | 0.00 | 0.19 | 0.09 | 0.92 |
| 7 | 21 | 0.52 | 0.05 | 19 | 21 | 21 | 0.05 | 0.70 | 0.04 | 0.82 |
| 8 | 17 | 0.44 | 0.05 | 14 | 17 | 17 | 0.03 | 0.42 | 0.03 | 0.86 |
| 9 | 17 | 0.49 | 0.09 | 15 | 17 | 17 | 0.03 | 0.68 | 0.05 | 0.84 |
| 10 | 16 | 0.47 | 0.05 | 13 | 16 | 16 | 0.04 | 0.65 | 0.05 | 0.89 |
| 11 | 24 | 0.53 | 0.15 | 19 | 24 | 24 | 0.06 | 0.75 | 0.04 | 0.79 |
| 12 | 9 | 0.45 | 0.01 | 9 | 9 | 9 | 0.02 | 0.67 | 0.07 | 0.86 |
| 13 | 6 | 0.42 | 0.04 | 7 | 6 | 6 | 0.01 | 0.53 | 0.08 | 0.97 |
| 14 | 3 | 0.36 | 0.00 | 4 | 3 | 3 | 0.01 | 0.35 | 0.09 | 0.67 |
| 15 | 5 | 0.42 | 0.03 | 6 | 5 | 5 | 0.01 | 0.61 | 0.10 | 0.75 |
| 16 | 7 | 0.44 | 0.00 | 7 | 7 | 7 | 0.02 | 0.67 | 0.10 | 0.72 |
| 17 | 6 | 0.39 | 0.02 | 7 | 6 | 6 | 0.01 | 0.43 | 0.06 | 0.82 |
| 18 | 8 | 0.41 | 0.04 | 6 | 8 | 8 | 0.03 | 0.53 | 0.09 | 0.72 |
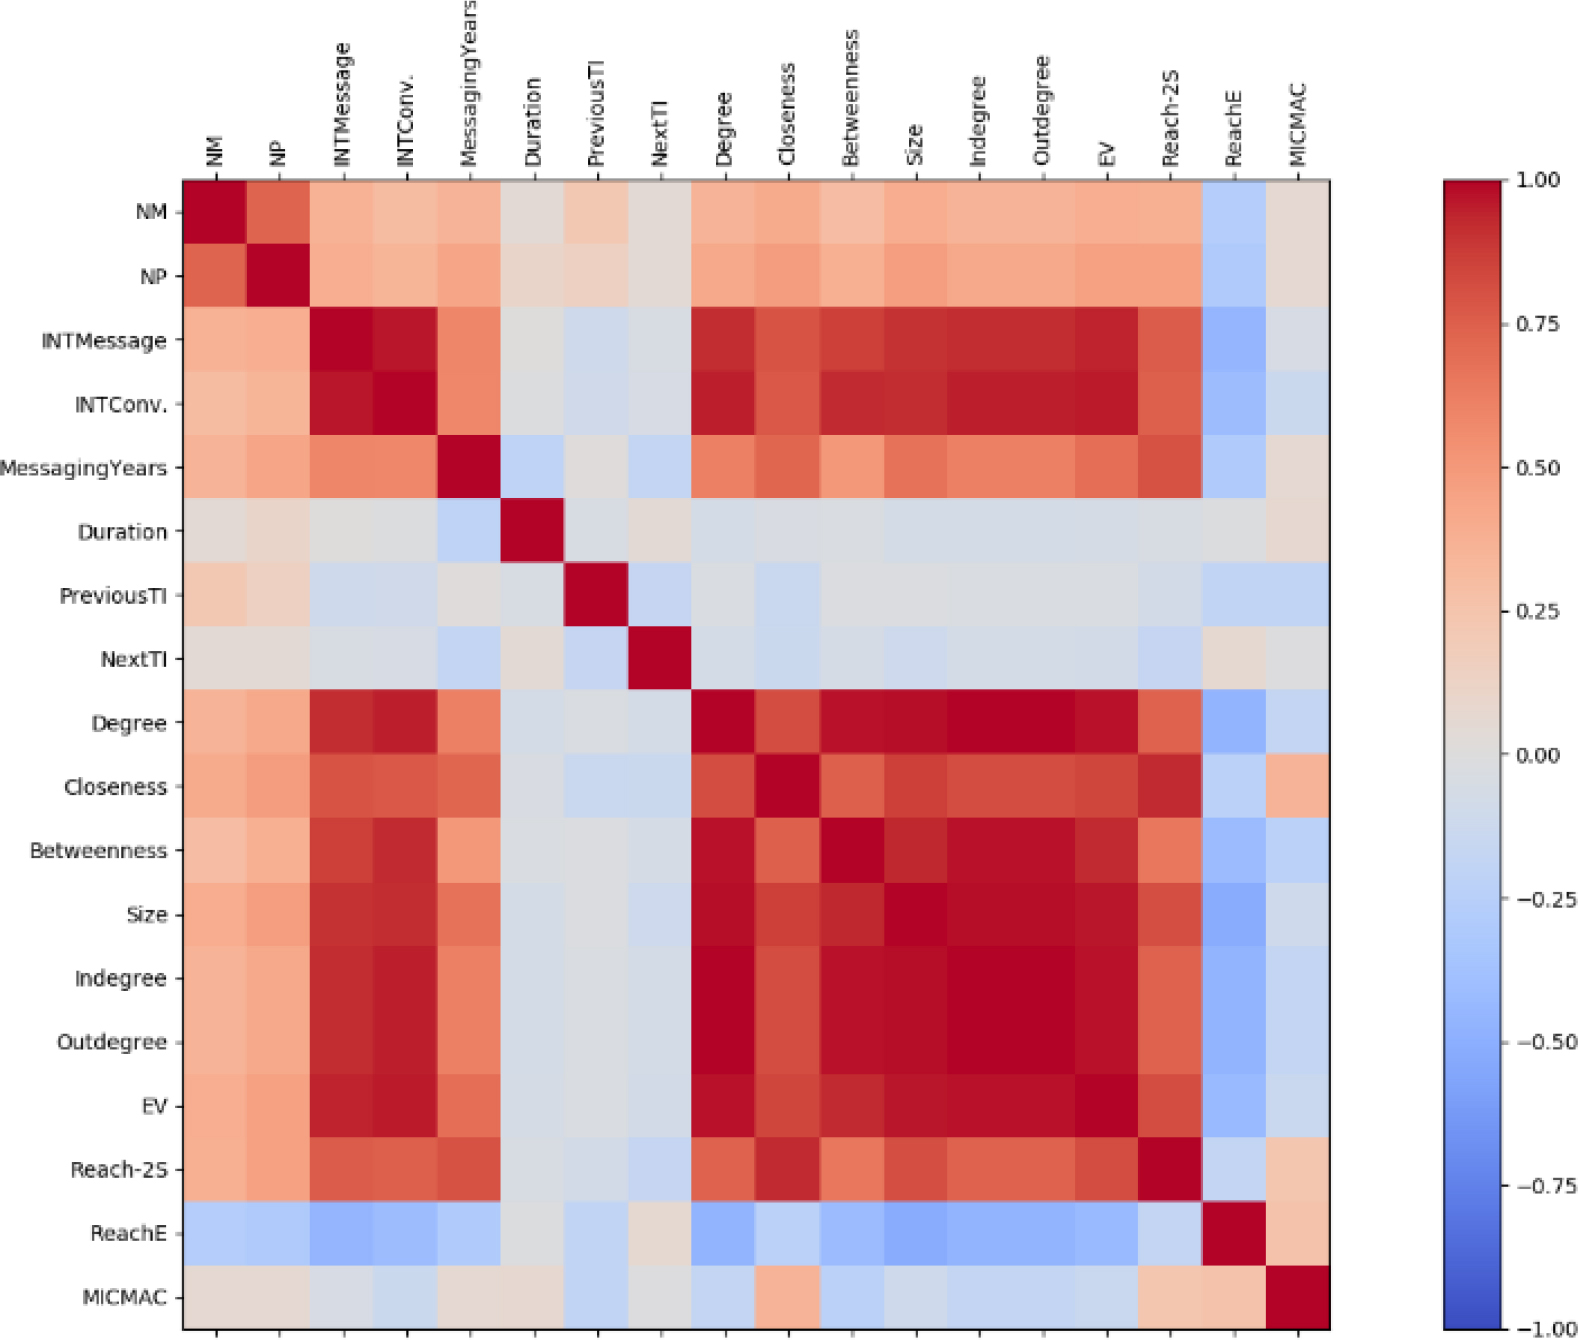
Figure 14.
Heatmap of Pearson correlation analysis result
(Source: Authors’ own research)
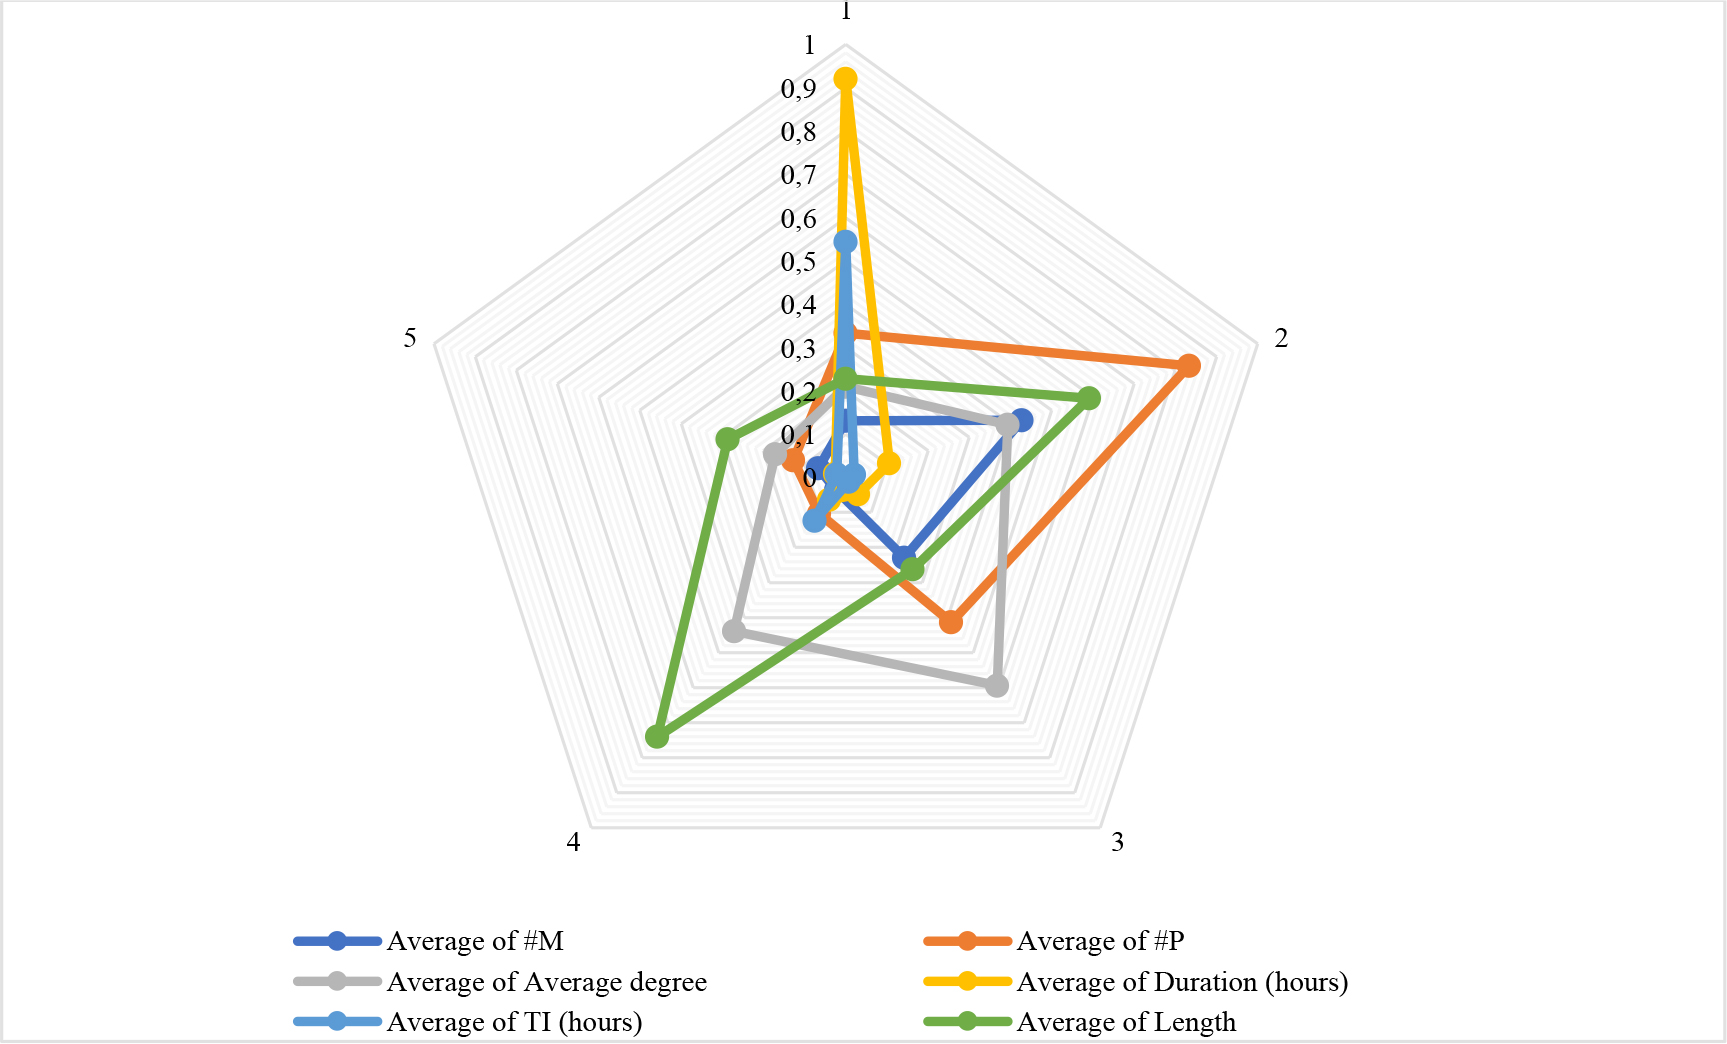
Figure 15.
Radar chart of clusters’ characteristics
(Source: Authors’ own research)
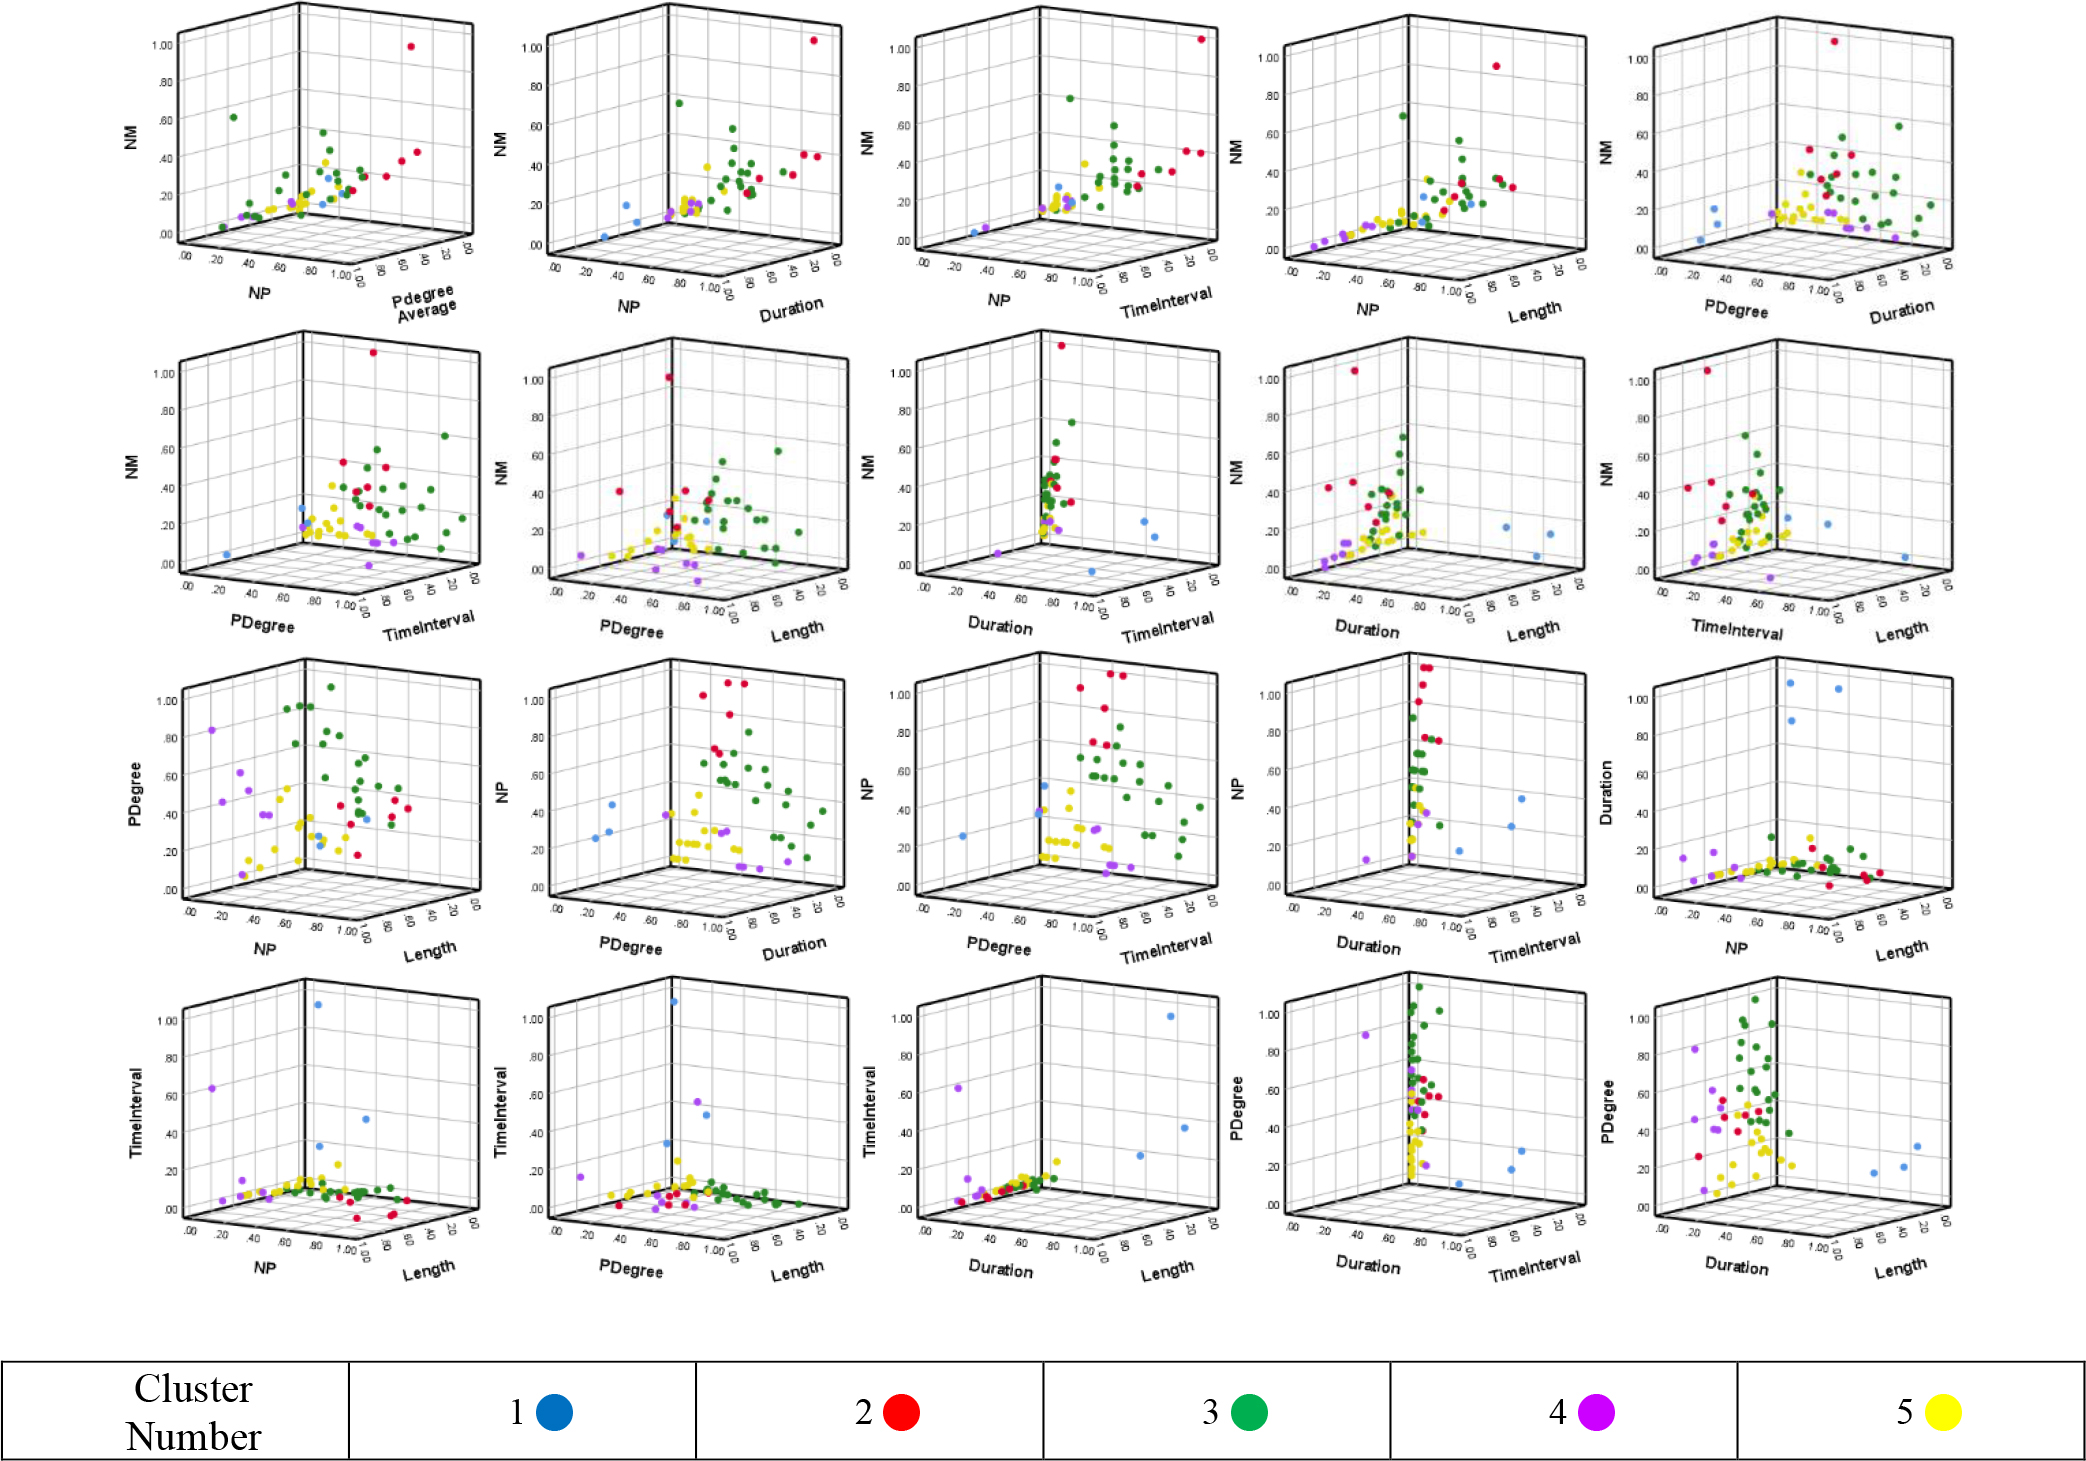
Figure 16.
3D scatter plots of six measures of participation
(Source: Authors’ own research)
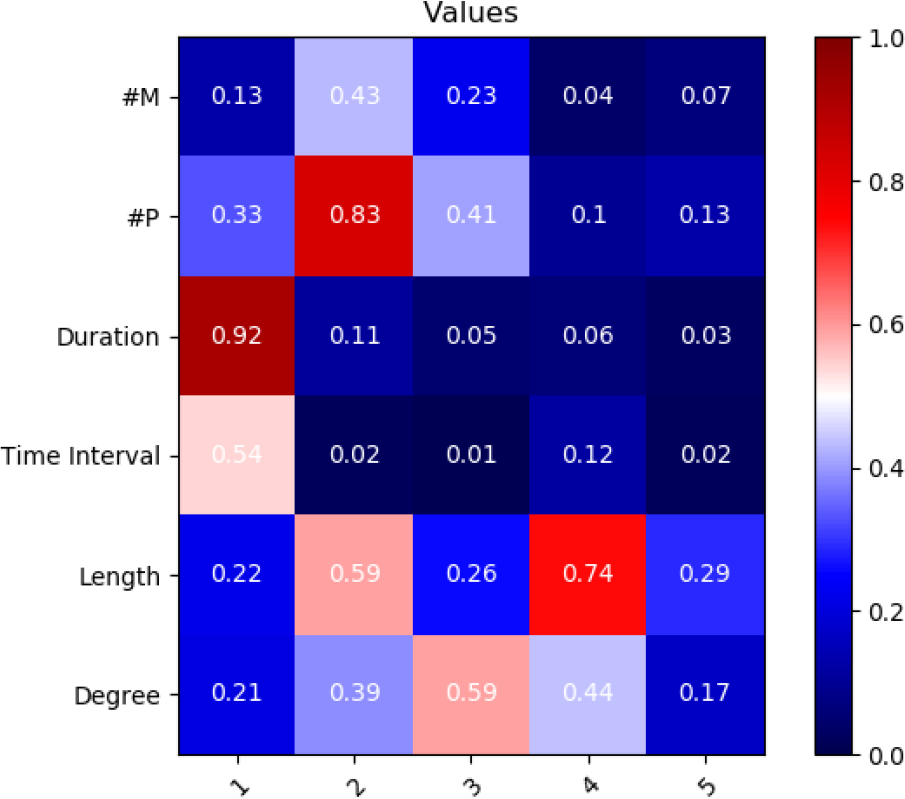
Figure 17.
Heatmap of cluster characteristics
(Source: Authors’ own research)
Table 7.
Characteristics of the five clusters
(Source: Authors’ own research)
| Cluster | # Messages | # Participants | Degree | Duration (days) | Messaging time interval (days) | Message length (characters) |
|---|---|---|---|---|---|---|
| 1 | 10 | 4.6 | 7.9 | 12 | 1.8 | 106 |
| 2 | 30.5 | 10.1 | 14.9 | 1.4 | 0.06 | 190.8 |
| 3 | 16.8 | 5.6 | 22.5 | 0.6 | 0.04 | 113.6 |
| 4 | 3.6 | 2.1 | 16.6 | 0.8 | 0.4 | 226.1 |
| 5 | 5.6 | 2.4 | 6.5 | 0.3 | 0.07 | 119.4 |
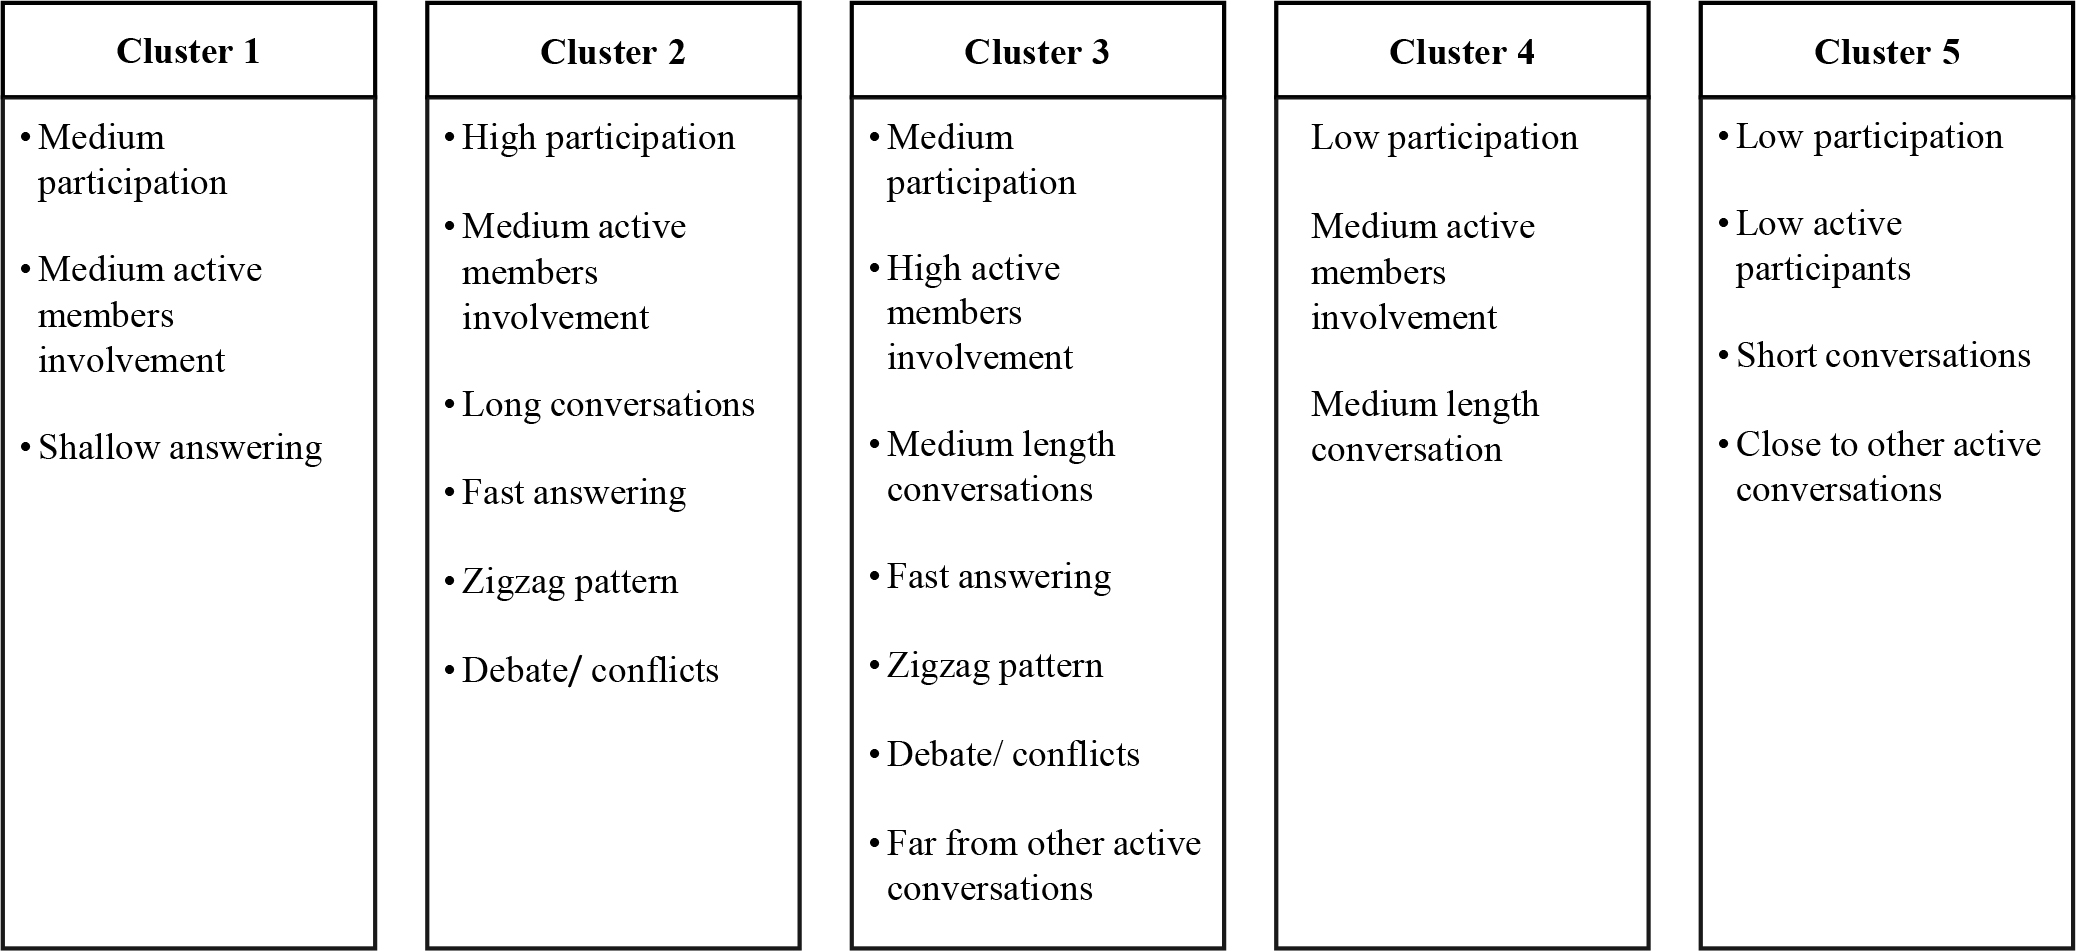
Figure 18.
Conversation clusters characteristics
(Source: Own elaboration)