

Figure 1.
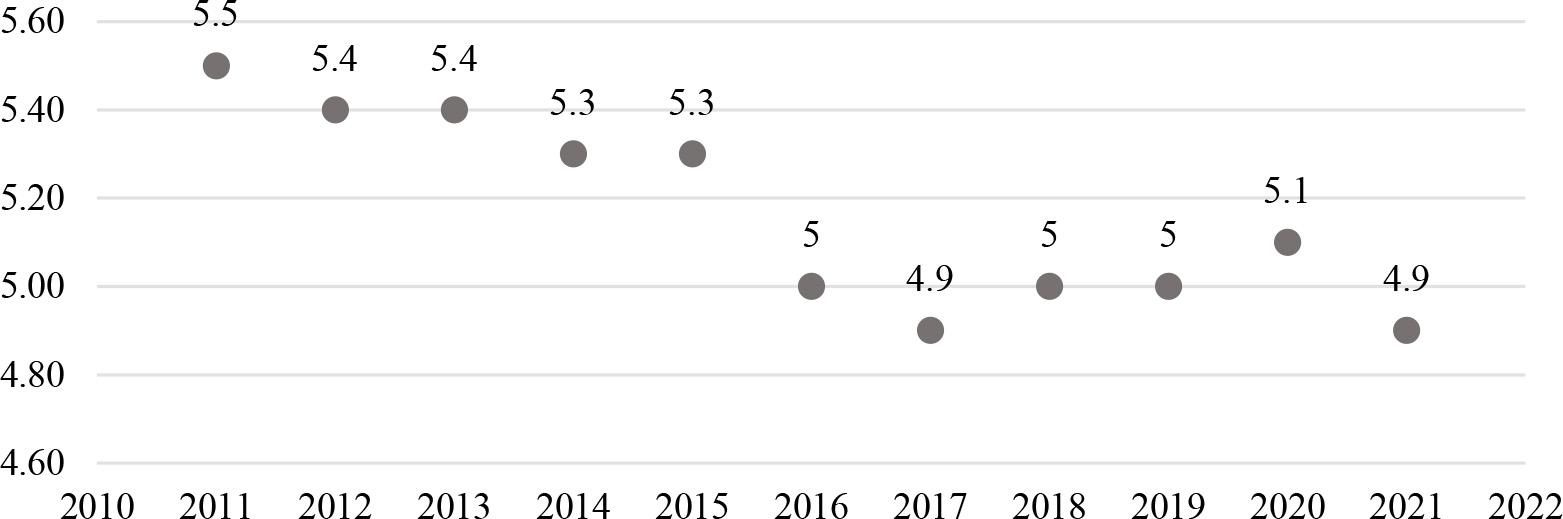
Figure 2.
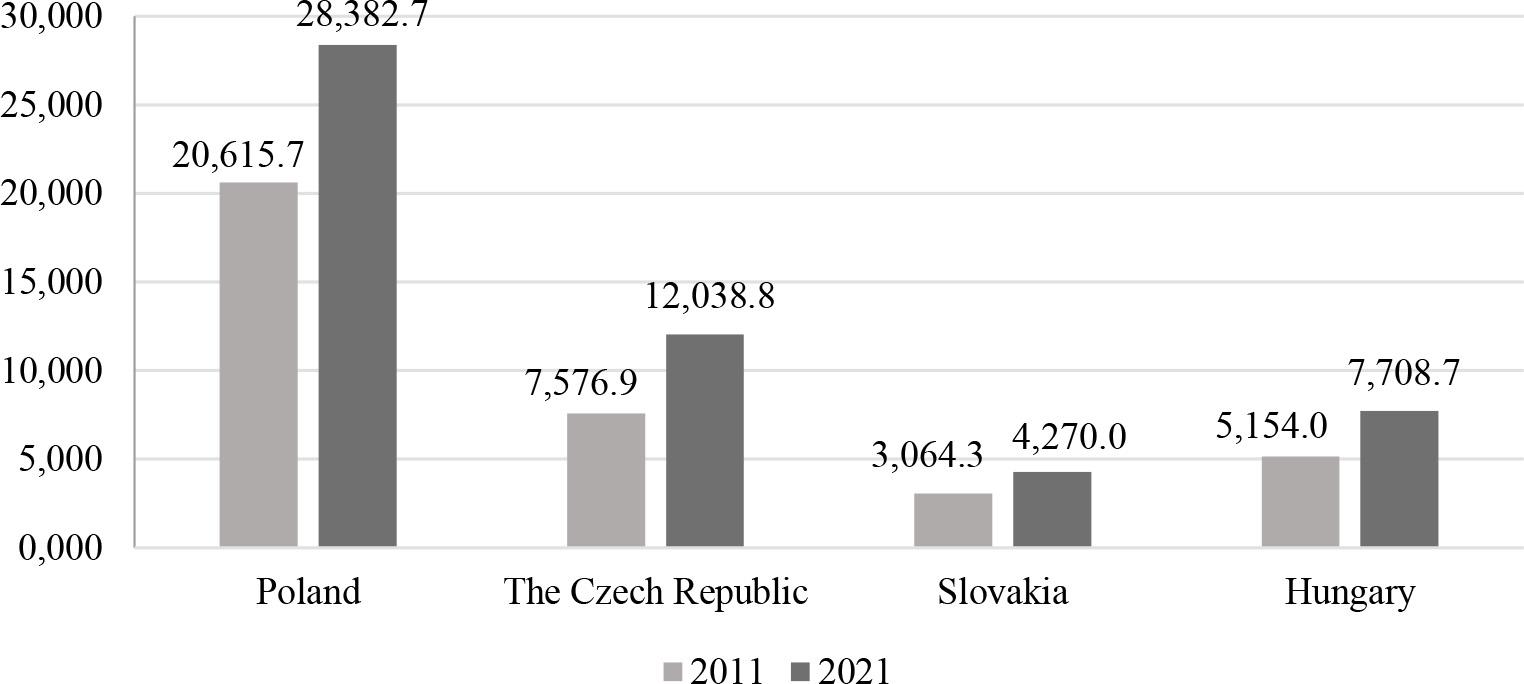
Figure 3.
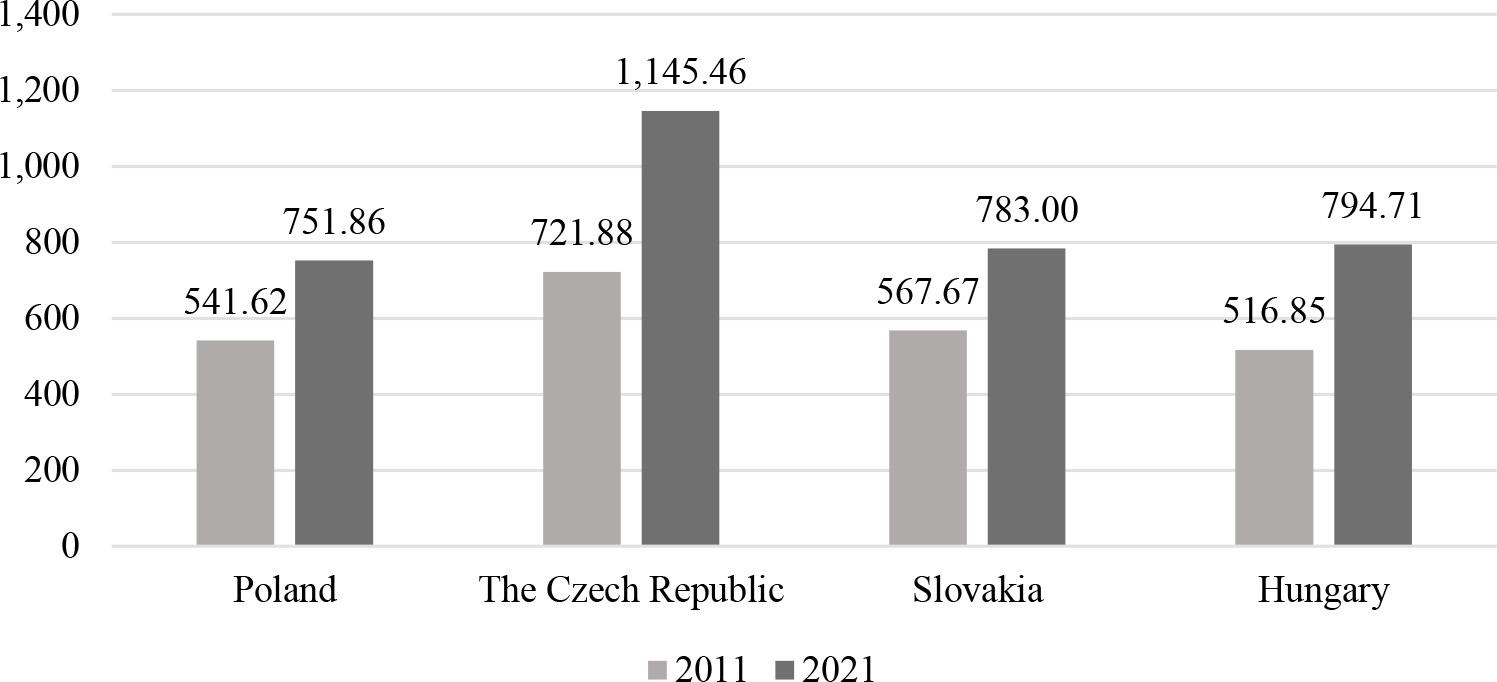
Figure 4.
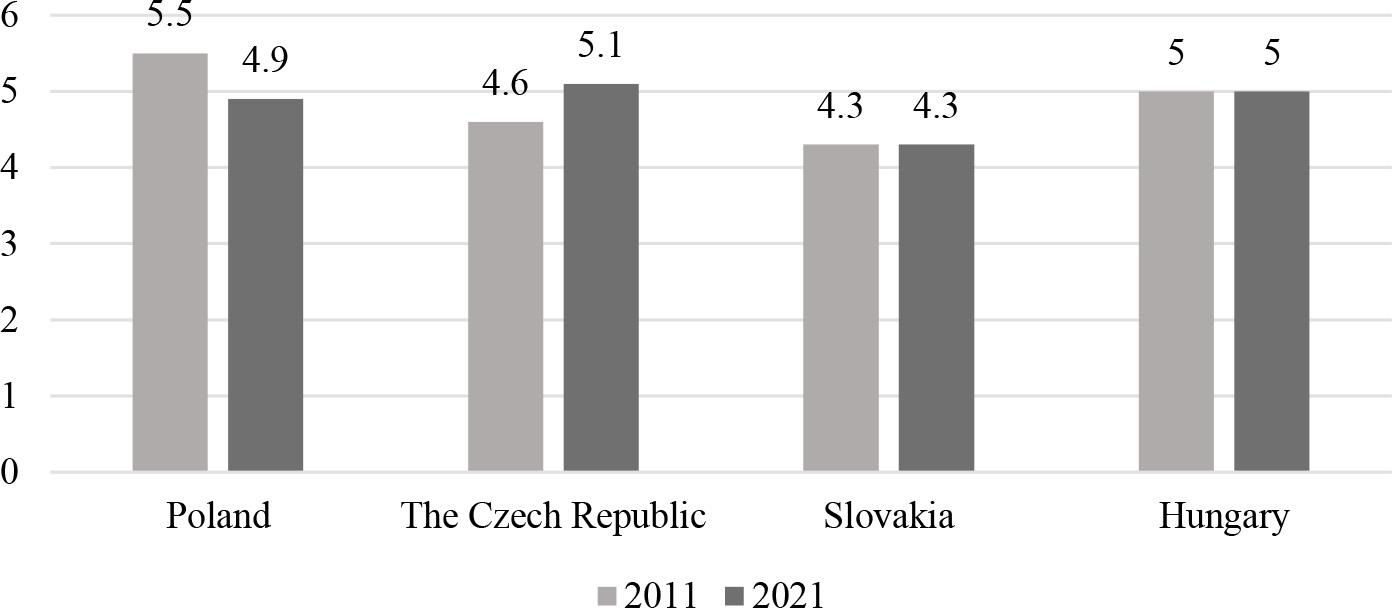
Figure 5.
Figure 6.
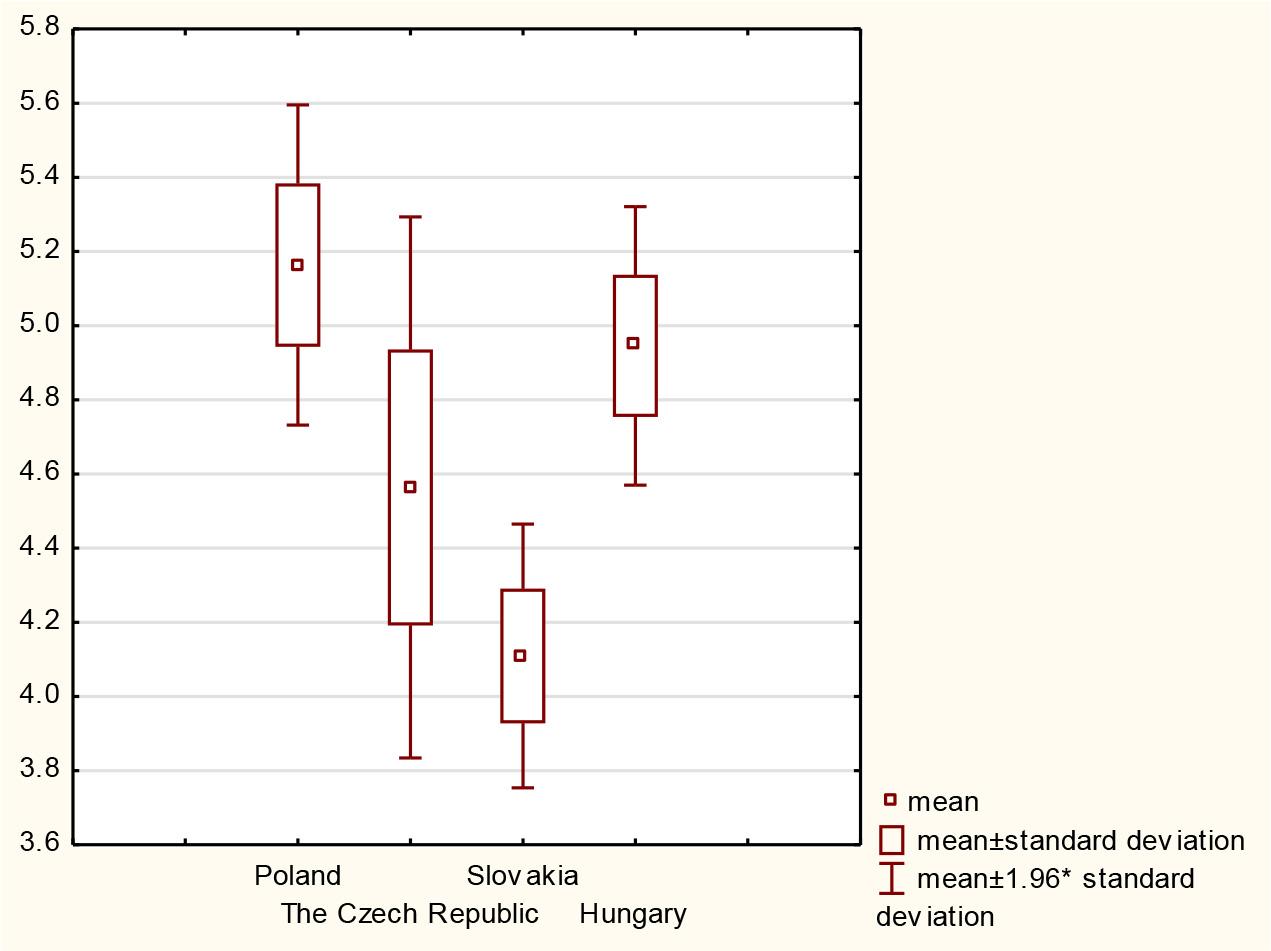
Statistical measures for public spending on education as a percentage of GDP in the Visegrad countries from 2011 to 2021
| Specification | Average spending as a percentage of GDP | Variance | Standard deviation | Coefficient of variation | Skewness |
|---|---|---|---|---|---|
| The Czech Republic | 4.56 | 0.14 | 0.37 | 8.16 | −0.12 |
| Slovakia | 4.11 | 0.03 | 0.18 | 4.41 | 0.21 |
| Hungary | 4.95 | 0.04 | 0.19 | 3.88 | −0.18 |
| Poland | 5.16 | 0.05 | 0.22 | 4.27 | 0.22 |