

Figure 1
Result of correlation analysis (Source: IDX Statistics, 2009–2019)
| Debt to Assets Ratio | Age | Size | Growth sales | |
|---|---|---|---|---|
| Debt to Assets Ratio | 1 | 0.033379 | 0.111995 | 0.007558 |
| Age | 0.033379 | 1 | 0.045458 | −0.06881 |
| Size | 0.111995 | 0.045458 | 1 | 0.009209 |
| Growth sales | 0.007558 | −0.06881 | 0.009209 | 1 |
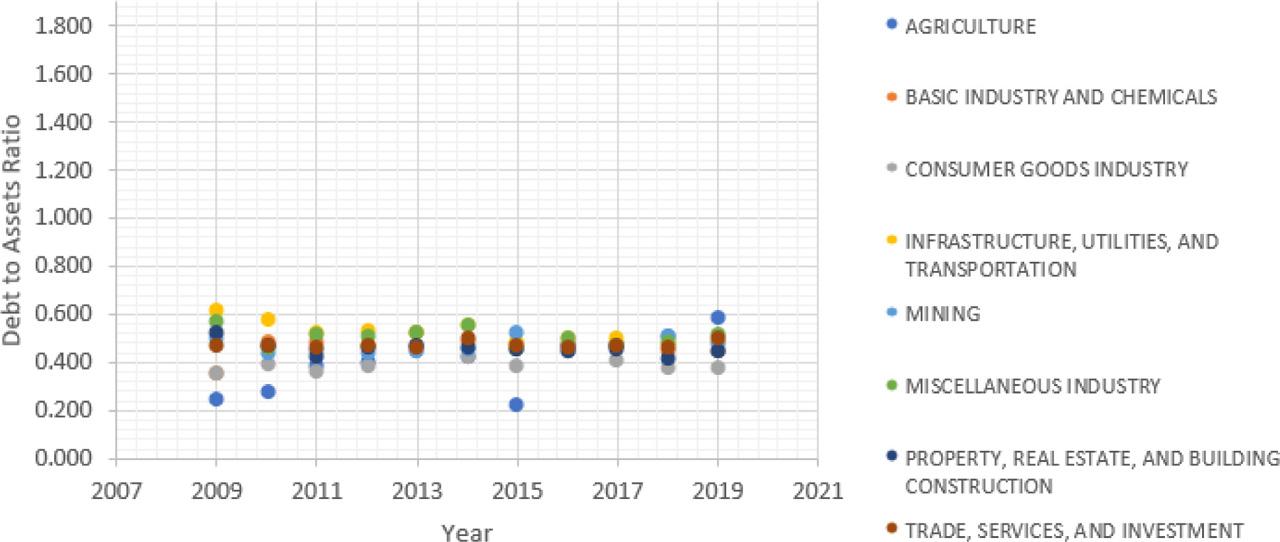
Time series data on firm age (Source: IDX Statistics, 2009–2019)
| 2009 | 2010 | 2011 | 2012 | 2013 | 2014 | 2015 | 2016 | 2017 | 2018 | 2019 | |
|---|---|---|---|---|---|---|---|---|---|---|---|
| Agriculture | 0.252 | 0.281 | 0.387 | 0.404 | 0.476 | 0.432 | 0.227 | 0.481 | 0.475 | 0.513 | 0.591 |
| Basic industry and chemicals | 0.361 | 0.495 | 0.497 | 0.473 | 0.527 | 0.493 | 0.485 | 0.487 | 0.490 | 0.449 | 0.447 |
| Consumer goods industry | 0.363 | 0.393 | 0.375 | 0.389 | 0.448 | 0.432 | 0.387 | 0.448 | 0.417 | 0.383 | 0.378 |
| Infrastructure, utilities, and transportation | 0.616 | 0.583 | 0.534 | 0.544 | 0.529 | 0.559 | 0.493 | 0.505 | 0.503 | 0.483 | 0.492 |
| Mining | 0.502 | 0.446 | 0.455 | 0.444 | 0.453 | 0.463 | 0.534 | 0.475 | 0.482 | 0.512 | 0.488 |
| Miscellaneous industry | 0.574 | 0.468 | 0.518 | 0.511 | 0.530 | 0.554 | 0.459 | 0.508 | 0.474 | 0.498 | 0.524 |
| Property, real estate, and building construction | 0.531 | 0.474 | 0.431 | 0.470 | 0.479 | 0.467 | 0.460 | 0.452 | 0.455 | 0.428 | 0.446 |
| Trade, services, and investment | 0.477 | 0.475 | 0.466 | 0.477 | 0.472 | 0.503 | 0.473 | 0.469 | 0.478 | 0.467 | 0.505 |
| Minimal | 0.460 | 0.452 | 0.458 | 0.464 | 0.489 | 0.488 | 0.440 | 0.478 | 0.472 | 0.467 | 0.484 |
| Maximal | 0.252 | 0.281 | 0.375 | 0.389 | 0.448 | 0.432 | 0.227 | 0.448 | 0.417 | 0.383 | 0.378 |
ANOVA test on leverage in inter-industry (Source: IDX Statistics, 2009–2019)
| Sources | SS | df | MS | F | P-value | F crit | RMSSE |
|---|---|---|---|---|---|---|---|
| Between groups | 1.952 | 8 | 0.244 | 6.305 | 0.000 | 1.940 | 0.169 |
| Within groups | 179.710 | 4645 | 0.039 | – | – | – | – |
| Total | 181.661 | 4653 | 0.039 | – | – | – | – |
Descriptive statistics on inter-industry leverage (Source: IDX Statistics, 2009–2019)
| Industry | n | Mean | Standard deviation | 25th percentiles | Median | 75th percentiles | Kurtosis | Skewness |
|---|---|---|---|---|---|---|---|---|
| Agriculture | 113 | 0.452 | 0.226 | 0.257 | 0.468 | 0.607 | 5.464 | 1.147 |
| Basic industry and chemicals | 313 | 0.479 | 0.195 | 0.334 | 0.471 | 0.616 | −0.757 | 0.111 |
| Consumer goods industry | 207 | 0.404 | 0.170 | 0.262 | 0.388 | 0.541 | −0.890 | 0.231 |
| Infrastructure, utilities, and transportation | 290 | 0.520 | 0.176 | 0.399 | 0.533 | 0.650 | −0.447 | −0.290 |
| Mining | 231 | 0.478 | 0.195 | 0.318 | 0.463 | 0.616 | −0.669 | 0.224 |
| Miscellaneous industry | 162 | 0.508 | 0.189 | 0.367 | 0.491 | 0.660 | −0.959 | 0.051 |
| Property, real estate, and building construction | 382 | 0.462 | 0.175 | 0.336 | 0.474 | 0.581 | −0.610 | 0.118 |
| Trade, services, and investment | 629 | 0.480 | 0.219 | 0.321 | 0.468 | 0.633 | 13.305 | 1.530 |
| Whole industry | 2327 | 0.476 | 0.198 | 0.327 | 0.474 | 0.618 | 5.549 | 0.693 |
ANOVA test on firm size intra-industry (Source: IDX Statistics, 2009–2019)
| Sources | SS | Df | MS | F | P-value | F crit | RMSSE | Omega Sq. |
|---|---|---|---|---|---|---|---|---|
| Between groups | 389.996 | 8 | 48.750 | 24.481 | 0.000 | 1.940 | 0.321 | 0.039 |
| Within groups | 9249.644 | 4645 | 1.991 | − | − | − | − | − |
| Total | 9639.640 | 4653 | 2.072 | − | − | − | − | − |
Descriptive statistics on firm size (Source: IDX Statistics, 2009–2019)
| Industry | n | Mean | Standard deviation | 25th percentiles | Median | 75th percentiles | Skewness | Kurtosis |
|---|---|---|---|---|---|---|---|---|
| Agriculture | 113 | 29.262 | 1.162 | 28.609 | 29.335 | 30.084 | −0.625 | 0.364 |
| Basic industry and chemicals | 313 | 28.365 | 1.329 | 27.460 | 28.369 | 29.168 | 0.339 | −0.140 |
| Consumer goods industry | 207 | 28.083 | 1.284 | 27.206 | 27.926 | 28.845 | 0.444 | −0.014 |
| Infrastructure, utilities, and transportation | 290 | 28.856 | 1.531 | 27.886 | 28.752 | 29.809 | −0.004 | −0.692 |
| Mining | 231 | 29.118 | 1.468 | 28.242 | 29.205 | 30.259 | −0.517 | −0.359 |
| Miscellaneous industry | 162 | 28.090 | 1.229 | 27.186 | 27.730 | 28.631 | 0.960 | 0.025 |
| Property, real estate, and building construction | 382 | 28.899 | 1.338 | 28.038 | 28.942 | 29.893 | −0.188 | −0.311 |
| Trade, services, and investment | 629 | 28.161 | 1.433 | 26.890 | 28.197 | 29.243 | 0.046 | −0.527 |
| Whole industry | 2327 | 28.533 | 1.439 | 27.434 | 28.515 | 29.563 | 0.045 | −0.572 |
Regression analysis (Source: IDX Statistics, 2009–2019)
| Dependent variable: growth sales | 1 | 2 |
|---|---|---|
| Debt asset ratio | 0.009 | 0.010 |
| P-value | 0.716 | 0.680 |
| Age | − | −0.024* |
| P-value | − | 0.001 |
| Size | − | 0.002 |
| P-value | − | 0.584 |
| R2 | 0.000 | 0.005 |
| Adj. R2 | 0.000 | 0.004 |
| No. observation | 2327 | 2327 |
Data description on firm age intra-industry (Source: IDX Statistics, 2009–2019)
| Industry | n | Mean | Standard deviation | 25th percentiles | Median | 75th percentiles | Kurtosis | Skewness |
|---|---|---|---|---|---|---|---|---|
| Agriculture | 113 | 2.470 | 0.596 | 2.197 | 2.485 | 3.091 | 0.866 | −0.682 |
| Basic industry and chemicals | 313 | 2.761 | 0.699 | 2.303 | 3.135 | 3.219 | 1.414 | −1.468 |
| Consumer goods industry | 207 | 2.747 | 0.720 | 2.197 | 3.178 | 3.258 | 0.708 | −1.328 |
| Infrastructure, utilities, and transportation | 290 | 2.293 | 0.633 | 1.946 | 2.197 | 2.773 | 0.253 | −0.641 |
| Mining | 231 | 2.581 | 0.472 | 2.303 | 2.485 | 2.944 | 2.355 | −0.960 |
| Miscellaneous industry | 162 | 2.803 | 0.719 | 2.485 | 3.135 | 3.296 | 2.173 | −1.612 |
| Property, real estate, and building construction | 382 | 2.620 | 0.622 | 2.303 | 2.602 | 3.178 | 1.080 | −1.041 |
| Trade, services, and investment | 629 | 2.583 | 0.627 | 2.079 | 2.773 | 3.091 | 0.727 | −0.995 |
| Whole industry | 2327 | 2.601 | 0.653 | 2.197 | 2.708 | 3.178 | 0.697 | −1.006 |
ANOVA test on firm age intra-industry (Source: IDX Statistics, 2009–2019)
| Sources | SS | Df | MS | F | P-value | F crit | RMSSE | Omega Sq. |
|---|---|---|---|---|---|---|---|---|
| Between groups | 48.950 | 8 | 6.119 | 14.682 | 0.000 | 1.940 | 0.245 | 0.023 |
| Within groups | 1935.800 | 4645 | 0.417 | − | − | − | − | − |
| Total | 1984.750 | 4653 | 0.427 | − | − | − | − | − |