

Table 1
Evolution of BSC to SBSC-4 and SBSC-5
(Source: Authors’ own research)
| Phase | Summary of Phase | Source |
|---|---|---|
| 1 | BSC: Was introduced as a performance measurement system through a longitudinal research on 12 companies, at the leading edge of performance measurement. The study designed a dashboard (i.e., the BSC) that gives top management a fast and comprehensive view of their business. The BSC includes financial measures that tell the results of actions already taken by complementing financial measures with operational measures on customer satisfaction, internal processes and people within the organization. | Kaplan and Norton (2001) |
| 2 | SBSC-4: Four components (i.e., environment, safety and health performance, employment practices, and community investment) were embedded into the four BSC perspectives. This scorecard was designed for companies to comply with national and local regulations on the environment, employee health and safety, hiring and employment practices to avoid shutdowns or litigations, and so on. | Kaplan and Norton (2001) |
| 3 | SBSC-5: Stephan Schaltegger along with two of his Ph. D students published a seminal paper that introduces the SBSC framework where the sustainability parameters are proposed as a separate 5th perspective. Their initial intent was to introduce non-market perspectives such as “child labor.” In several follow-up papers, Schaltegger and his team introduced other components of sustainability related to the physical environment from environmental management accounting. The introduction of the 5th perspective, thus gave birth to two separate schools of thought on SBSC; one where sustainability parameters are embedded into BSC perspectives (SBSC-4) and the 5th perspective type configuration with sustainability as a separate perspective (SBSC-5), see Fig. 1. | Figge, et al. (2002) |
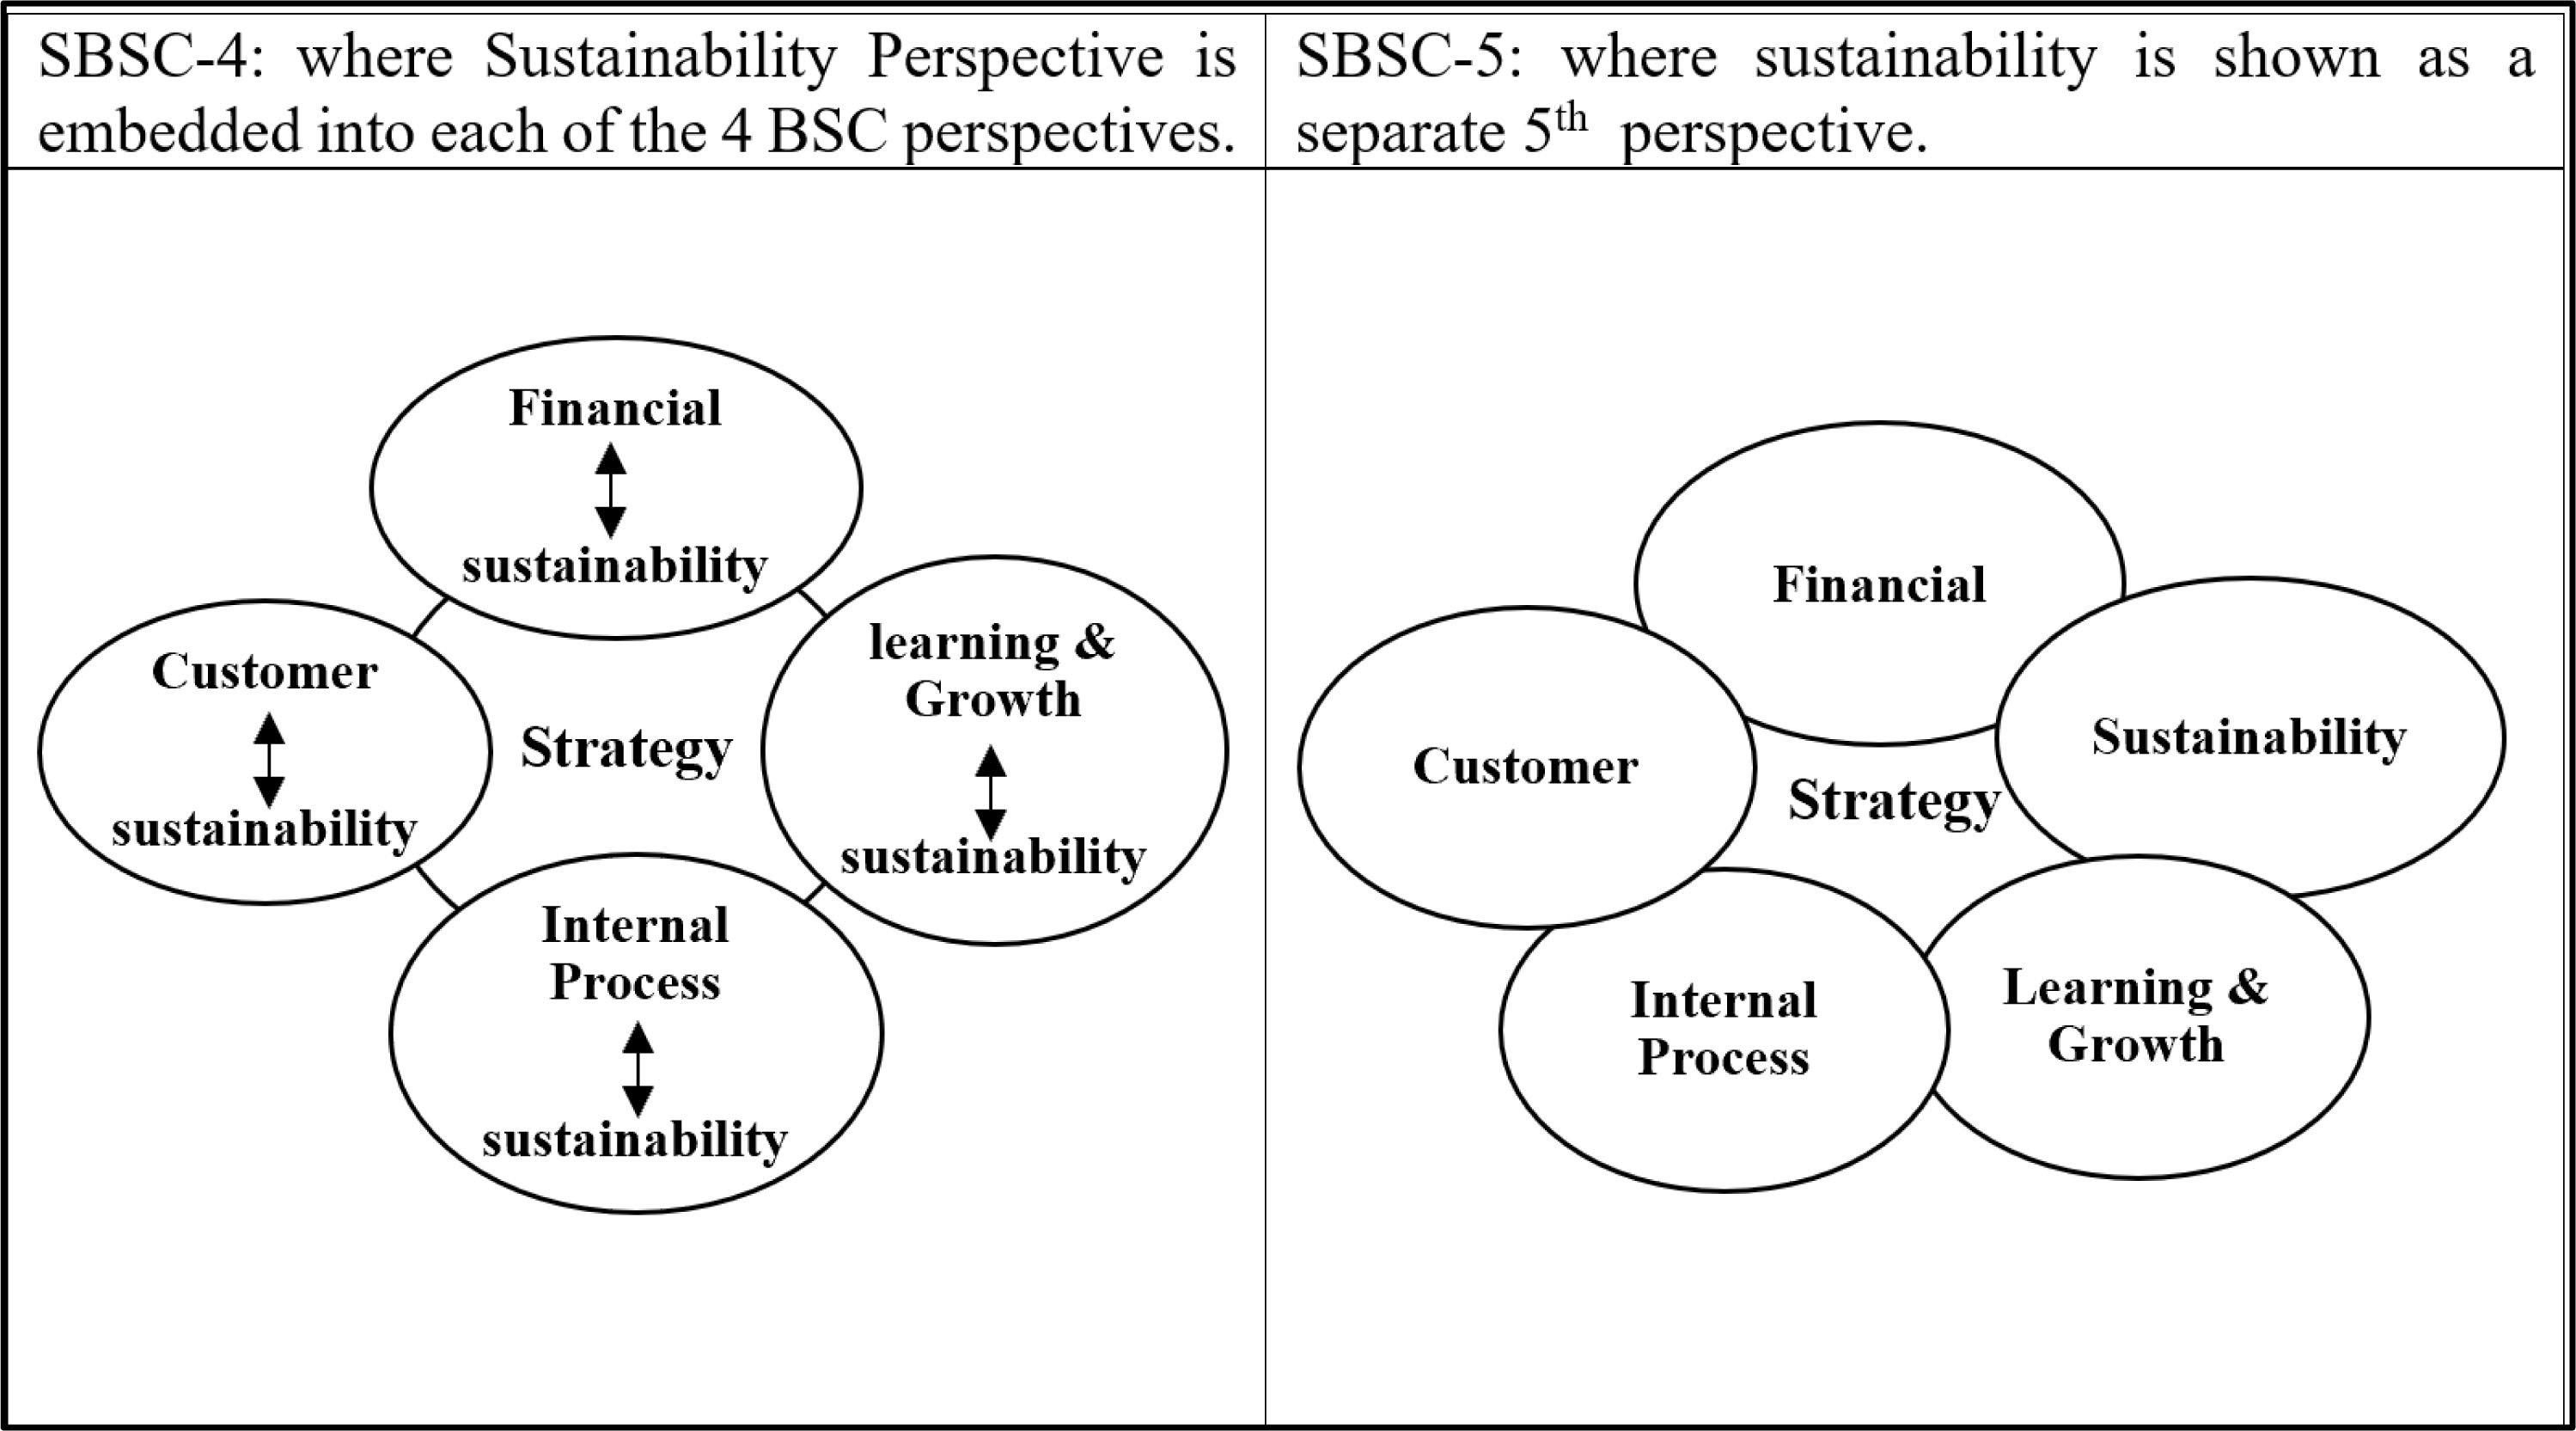
Figure 1
Architecture of SBSC-4 and SBSC-5 (Source: Authors’ own research)
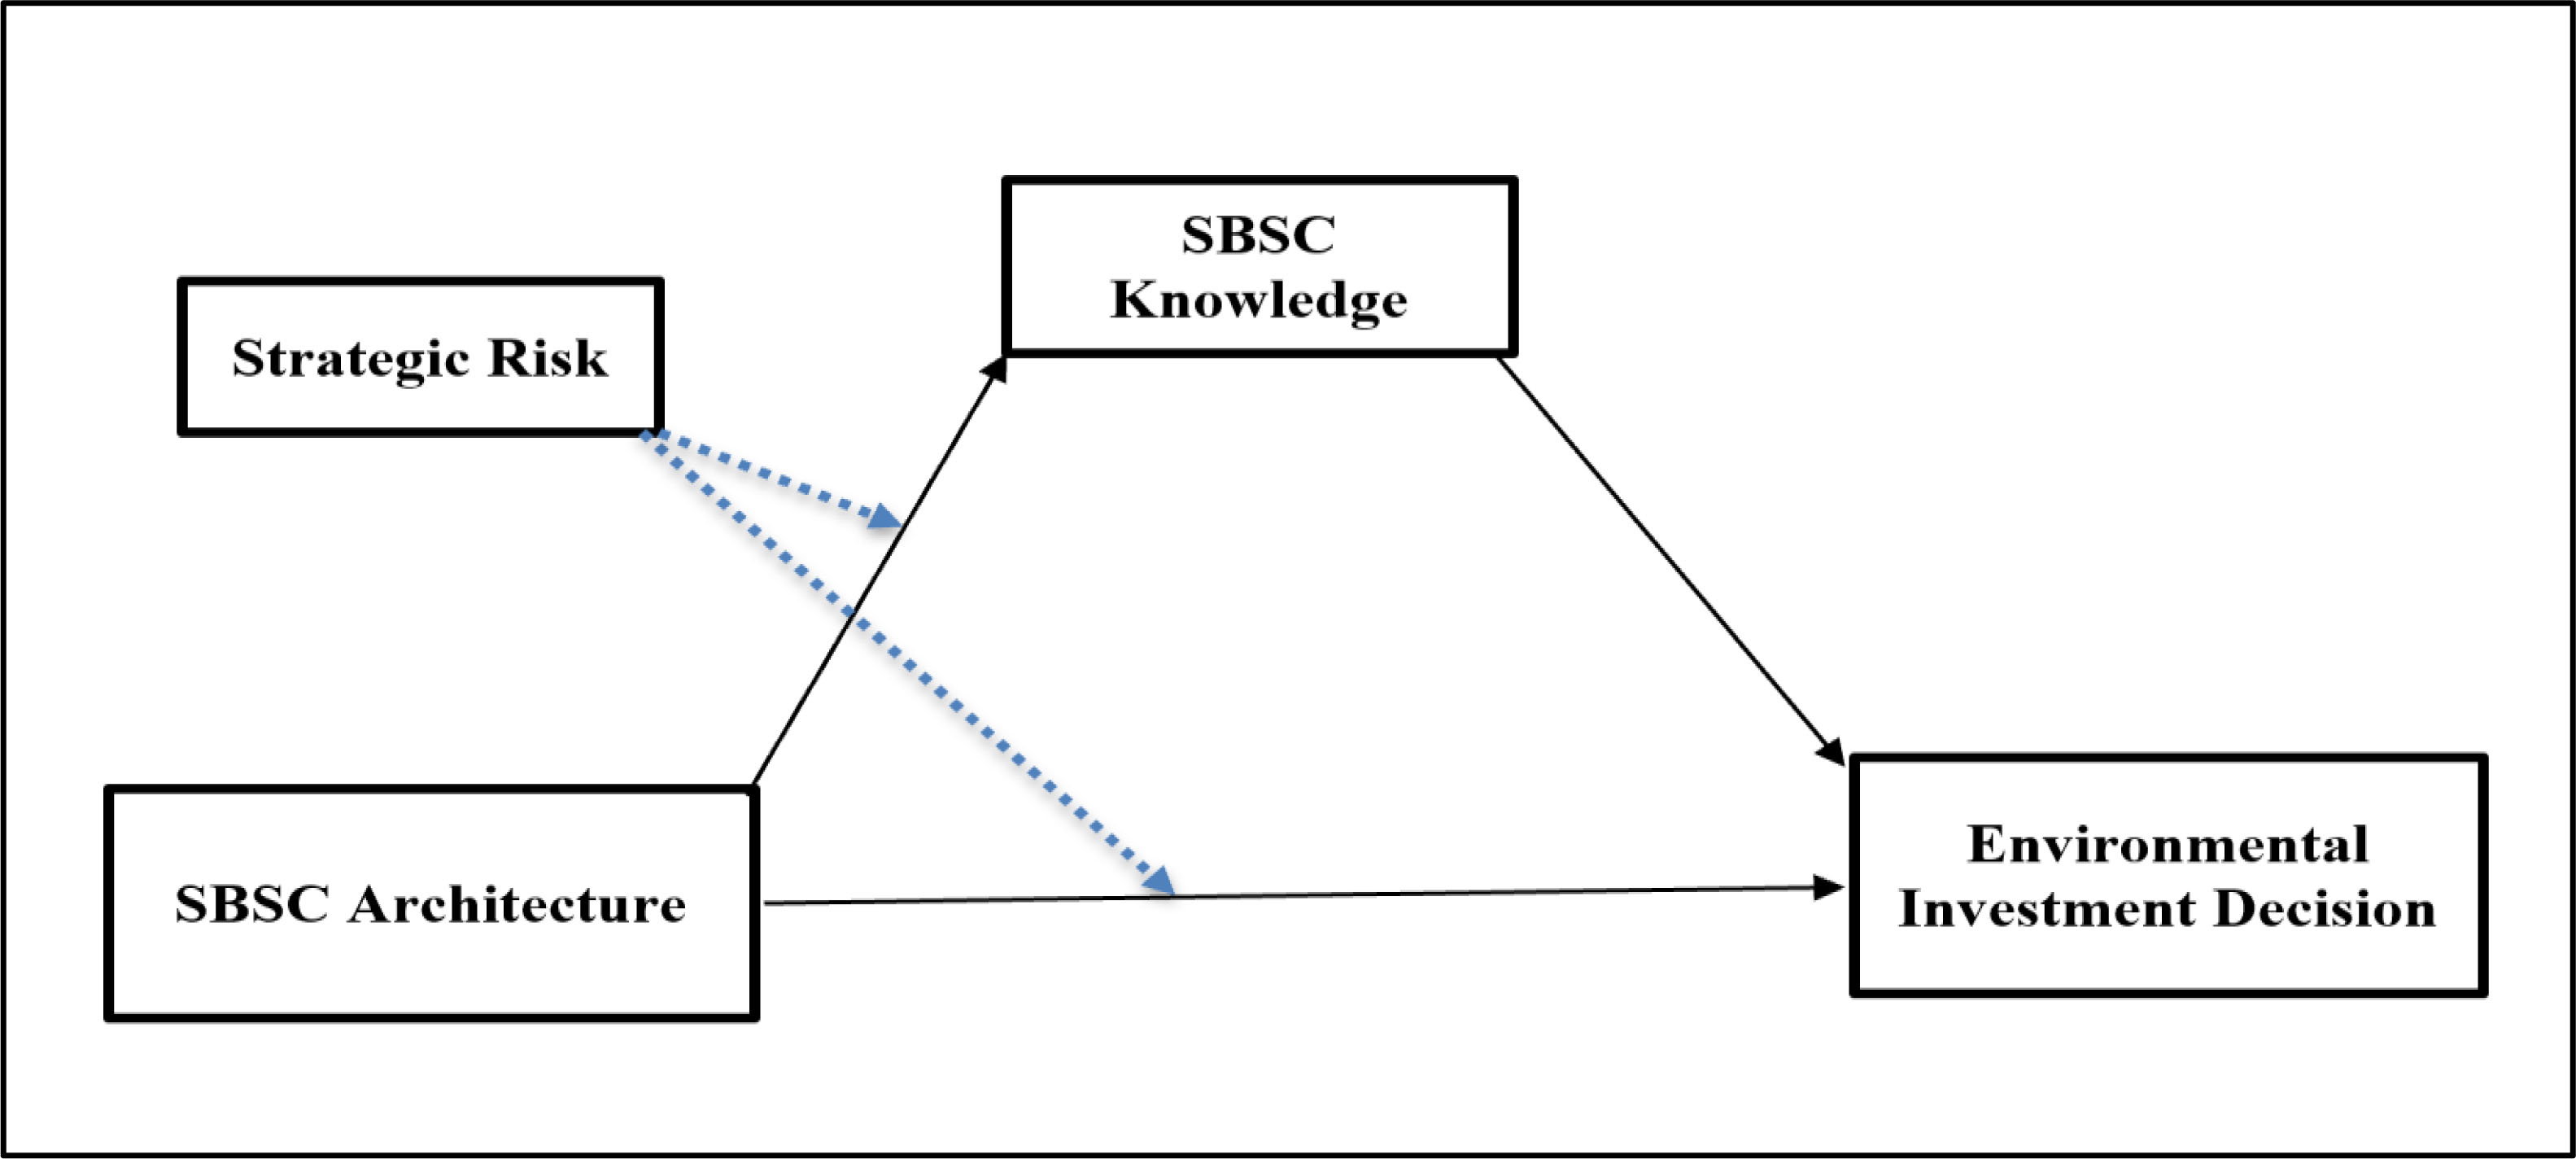
Figure 2
Research Model (Source: Authors’ own research)
Table 2
Four groups and manipulated conditions (Source: Authors’ own research)
| Conditions | Configuration | Including risk | Number of SBSC perspectives | Experimental group No. |
|---|---|---|---|---|
| 1 | SBSC-4 without risk | No | 4 | Group 1 |
| 2 | SBSC-4 with risk | Yes | 4 | Group 2 |
| 3 | SBSC-5 without risk | No | 5 | Group 3 |
| 4 | SBSC-5 with risk | Yes | 5 | Group 4 |
[i] Note:Appendix A presents the details of the research instrument with four conditions
Table 3
Descriptive statistics of environmental investment decision-making
(Source: Authors’ own research)
| SBSC Architecture | Risk | Investment A | Investment B | ||
|---|---|---|---|---|---|
| Mean | SD | Mean | SD | ||
| SBSC-4 | Without risk | 8.409 (42%) | 2.922 | 11.591 (58%) | 2.922 |
| With risk | 5.521 (27.6%) | 1.647 | 14.478 (72.4%) | 1.647 | |
| SBSC-5 | Without risk | 12.833 (64.2%) | 1.786 | 7.167 (35.8%) | 1.786 |
| With risk | 7.56 (37.8%) | 2.123 | 12.44 (62.2%) | 2.123 | |
[i] Mean-scores and SD are in millions of dollars allocated by the participants
Table 4
Results of ANOVA for environmental investment decision-making (between subject effect)
(Source: Authors’ own research)
| Source | df | MS | F-Value | p-Value | η2 |
|---|---|---|---|---|---|
| SBSC architecture | 1 | 244.807 | 52.39 | <0.001 | 0.368 |
| Risk | 1 | 390.369 | 83.541 | <0.001 | 0.481 |
| SBSC architecture risk | 1 | 33.37 | 7.141 | 0.009 | 0.074 |
[i] Dependent variable: environmental investment decision making, significant at p < 0.05
Table 5
Pairwise Comparison between SBSC-4 and SBSC-5 (with risk and without risk)
(Source: Authors’ own research)
Table 6
Path coefficient for the mediation effect of SBSC knowledge between SBSC architecture and environmental investment decision-making (Source: Authors’ own research)
| Path | B | SE | T/Z | p-value | LLCI | ULCI |
|---|---|---|---|---|---|---|
IV to Mediators (path a)
| −0.697 | 0.334 | −2.085 | <0.05 | 1.371 | −0.023 |
Mediator to DV (path b)
| 1.606 | 0.210 | 7.641 | <0.001 | 1.182 | 2.030 |
Direct effect (path c)
| −3.305 | 0.488 | −6.766 | <0.001 | −4.290 | −2.320 |
Indirect effect (path ab)
| −1.119 | 0.561 | −1.996 | <0.05 | −2.046 | −0.165 |
[i] Significant at p-value < 0.05. The negative signs of the values of B are a result of the manner in which the dichotomous variables are coded. If the coding were reversed, then the values would appear positive. Hence the negative values do not warrant any remarks
Table 7
Results of the mediation test of SBSC Knowledge between SBSC Architecture and Environmental Investment Decision-Making (with risk) (Source: Authors’ own research)
| Path | B | SE | T/Z | p-value | LLCI | ULCI |
|---|---|---|---|---|---|---|
IV to Mediators (path a)
| −1.557 | 0.252 | −6.180 | <0.001 | −2.064 | −1.049 |
Mediator to DV (path b)
| 1.633 | 0.218 | 7.493 | <0.001 | 1.194 | 2.071 |
Direct effect (path c)
| −0.503 | 0.504 | −0.999 | 0.323 | −0.511 | 1.518 |
Indirect effect (path ab)
| −2.542 | 0.536 | −4.743 | <0.001 | −3.640 | −1.695 |
[i] Significant at p-value < 0.05. The negative signs of the values of B are a result of the manner in which the dichotomous variables are coded. If the coding were reversed, then the values would appear positive. Hence the negative values do not warrant any remarks.
Table 8
Pairwise comparison between both risk levels (with risk and without risk) (Source: Authors’ own research)
Table 9
Conditional direct and indirect effects of SBSC architecture on environmental investment decision-making (with and without risk) (Source: Authors’ own research)
| Effect | Risk | Effect | SE | LLCI | ULCI |
|---|---|---|---|---|---|
| Direct | Without risk | −3.298 | 0.511 | −4.313 | −2.282 |
| With risk* | 0.477 | 0.490 | −0.497 | 1.452 | |
| Indirect | Without risk | −1.126 | 0.503 | −2.276 | −0.215 |
| With risk | −2.516 | 0.490 | −3.570 | −1.671 |
Table 10
Index of moderated mediation (Source: Authors’ own research)
| Mediator | Index | SE (Boot) | Boot LLCI | Boot ULCI |
|---|---|---|---|---|
| SBSC knowledge | −1.389 | 0.717 | −2.992 | −0.216 |
Panel G1
An example of the information that the participants could see at one time (SBSC-4)
| Financial perspective | Goals | Investment A | Investment B |
|---|---|---|---|
| Return on investment | 17% | 12–14% | 16–22% |
| Annual cash flow increase | $325,000 | $100,000–$300,000 | $300,000–$400,000 |
| Sales growth | 24% | 22–27% | 18–23% |
| Payback period | 3 years | 5 years | 3 years |
| Energy cost savings | 325,000 | 300,000–400,000 | 100,000–300,000 |
Panel G2
An example of the information that the participants could see at one time (SBSC-4 with risk)
| Financial perspective | Goals | Investment A | Risk | Investment B | Risk |
|---|---|---|---|---|---|
| Return on investment | 17% | 12–14% | >15 | 16–22% | <15 |
| Annual cash flow increase | $325,000 | $100,000–$300,000 | $300,000–$400,000 | ||
| Sales growth | 24% | 22–27% | 18–23% | ||
| Payback period | 3 years | 5 years | 3 years | ||
| Energy cost savings | 325,000 | 300,000–400,000 | 100,000–300,000 |
Panel G3
An example of the information that the participants could see at one time (SBSC-5)
| Environmental perspective | Goals | Investment A | Investment B |
|---|---|---|---|
| Energy cost savings | 325,000 | 300,000–400,000 | 100,000–300,000 |
| Number of community complaints about company pollutant emissions | 3 | 1–3 | 7–9 |
| Annual tons of nitrogen dioxide emissions | 30 | 20–30 | 40–55 |
| Number of hours of training per factory employee for environmental emergency responses | 275 | 180–250 | 240–300 |
Panel G4
An example of the information that the participants could see at one time (SBSC-5 with risk)
| Environmental perspective | Goals | Investment A | Risk | Investment B | Risk |
|---|---|---|---|---|---|
| Energy cost savings | 325,000 | 300,000–400,000 | <15 | 100,000–300,000 | >15 |
| Number of community complaints about company pollutant emissions | 3 | 1–3 | 7–9 | ||
| Annual tons of nitrogen dioxide emissions | 30 | 20–30 | 40–55 | ||
| Number of hours of training per factory employee for environmental emergency responses | 275 | 180–250 | 240–300 |