

Figure 1
Figure 2
Figure 3
Figure 4
Figure 5
Figure 6
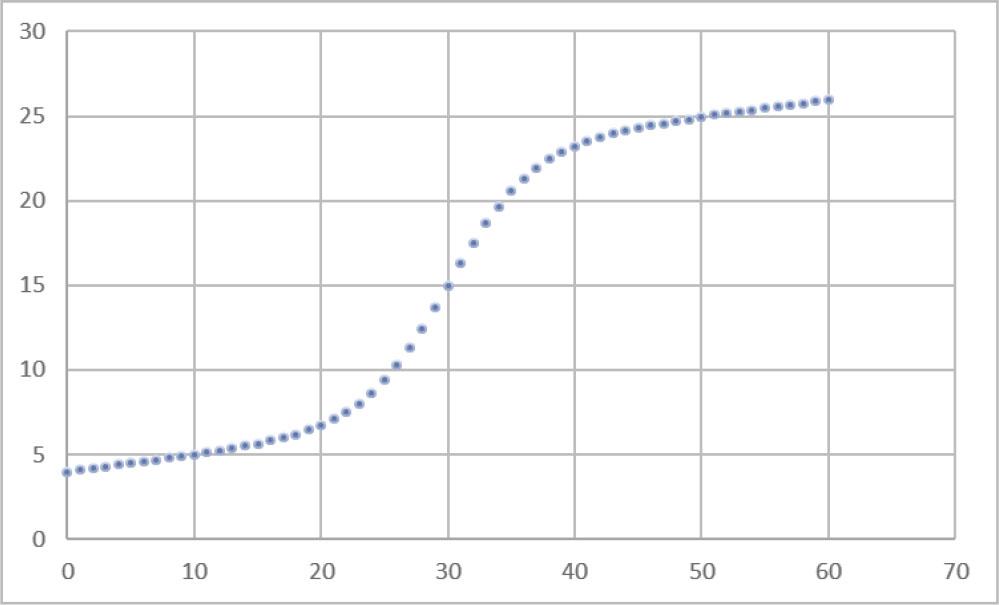
Figure 7
Figure 8
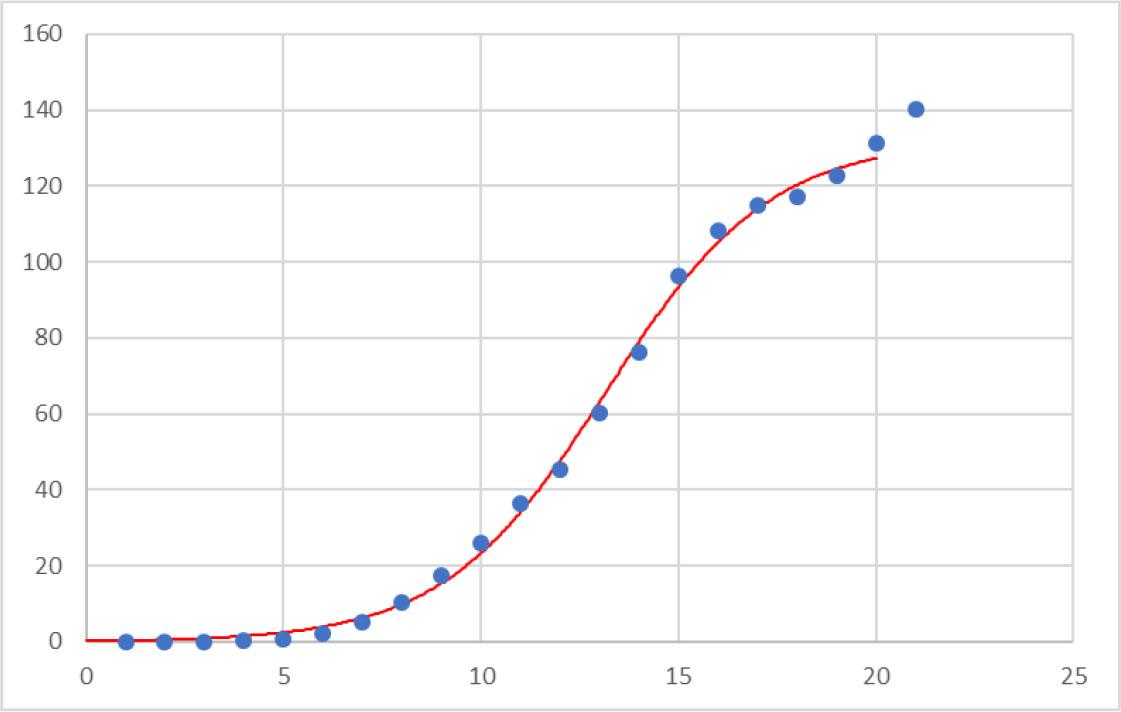
Number of subscriptions of mobile telephones per 100 inhabitants in Poland in the years 1992–2012 (Source: ITU, http://www_itu_int)
| No (t) | Year | Number of subscriptions per 100 inhabitants, y(t) | Second differences ∆2 |
|---|---|---|---|
| 1 | 1992 | 0.007 | |
| 2 | 1993 | 0.035 | 0.0378 |
| 3 | 1994 | 0.101 | 0.02894 |
| 4 | 1995 | 0.196 | 0.27426 |
| 5 | 1996 | 0.565 | 1.1828 |
| 6 | 1997 | 2.117 | 1.39996 |
| 7 | 1998 | 5.069 | 2.29338 |
| 8 | 1999 | 10.315 | 2.03268 |
| 9 | 2000 | 17.593 | 1.24125 |
| 10 | 2001 | 26.112 | 1.67588 |
| 11 | 2002 | 36.307 | −1.0091 |
| 12 | 2003 | 45.493 | 5.74175 |
| 13 | 2004 | 60.421 | 0.99075 |
| 14 | 2005 | 76.339 | 3.94934 |
| 15 | 2006 | 96.207 | −7.6964 |
| 16 | 2007 | 108.378 | −5.5284 |
| 17 | 2008 | 115.021 | −4.3499 |
| 18 | 2009 | 117.315 | 3.30763 |
| 19 | 2010 | 122.915 | 2.77762 |
| 20 | 2011 | 131.294 | 0.67138 |
| 21 | 2012 | 140.343 |
Exponentially smoothed values for the data of Table 1 (Source: Own elaboration)
| No (t) | Year | Smoothed values
| Second differences ∆2 |
|---|---|---|---|
| 1 | 1992 | 0.007 | |
| 2 | 1993 | 0.021 | 0.02594 |
| 3 | 1994 | 0.061 | 0.027439 |
| 4 | 1995 | 0.129 | 0.150848 |
| 5 | 1996 | 0.347 | 0.666822 |
| 6 | 1997 | 1.232 | 1.033391 |
| 7 | 1998 | 3.151 | 1.663384 |
| 8 | 1999 | 6.733 | 1.848031 |
| 9 | 2000 | 12.163 | 1.544643 |
| 10 | 2001 | 19.137 | 1.610262 |
| 11 | 2002 | 27.722 | 0.300585 |
| 12 | 2003 | 36.607 | 3.021167 |
| 13 | 2004 | 48.514 | 2.005957 |
| 14 | 2005 | 62.427 | 2.977648 |
| 15 | 2006 | 79.317 | −2.35939 |
| 16 | 2007 | 93.848 | −3.9439 |
| 17 | 2008 | 104.434 | −4.14688 |
| 18 | 2009 | 110.875 | −0.41963 |
| 19 | 2010 | 116.895 | 1.178996 |
| 20 | 2011 | 124.094 | 0.925189 |
| 21 | 2012 | 132.219 |