

Figure 1
Figure 2
Figure 3
Figure 4
Figure 5
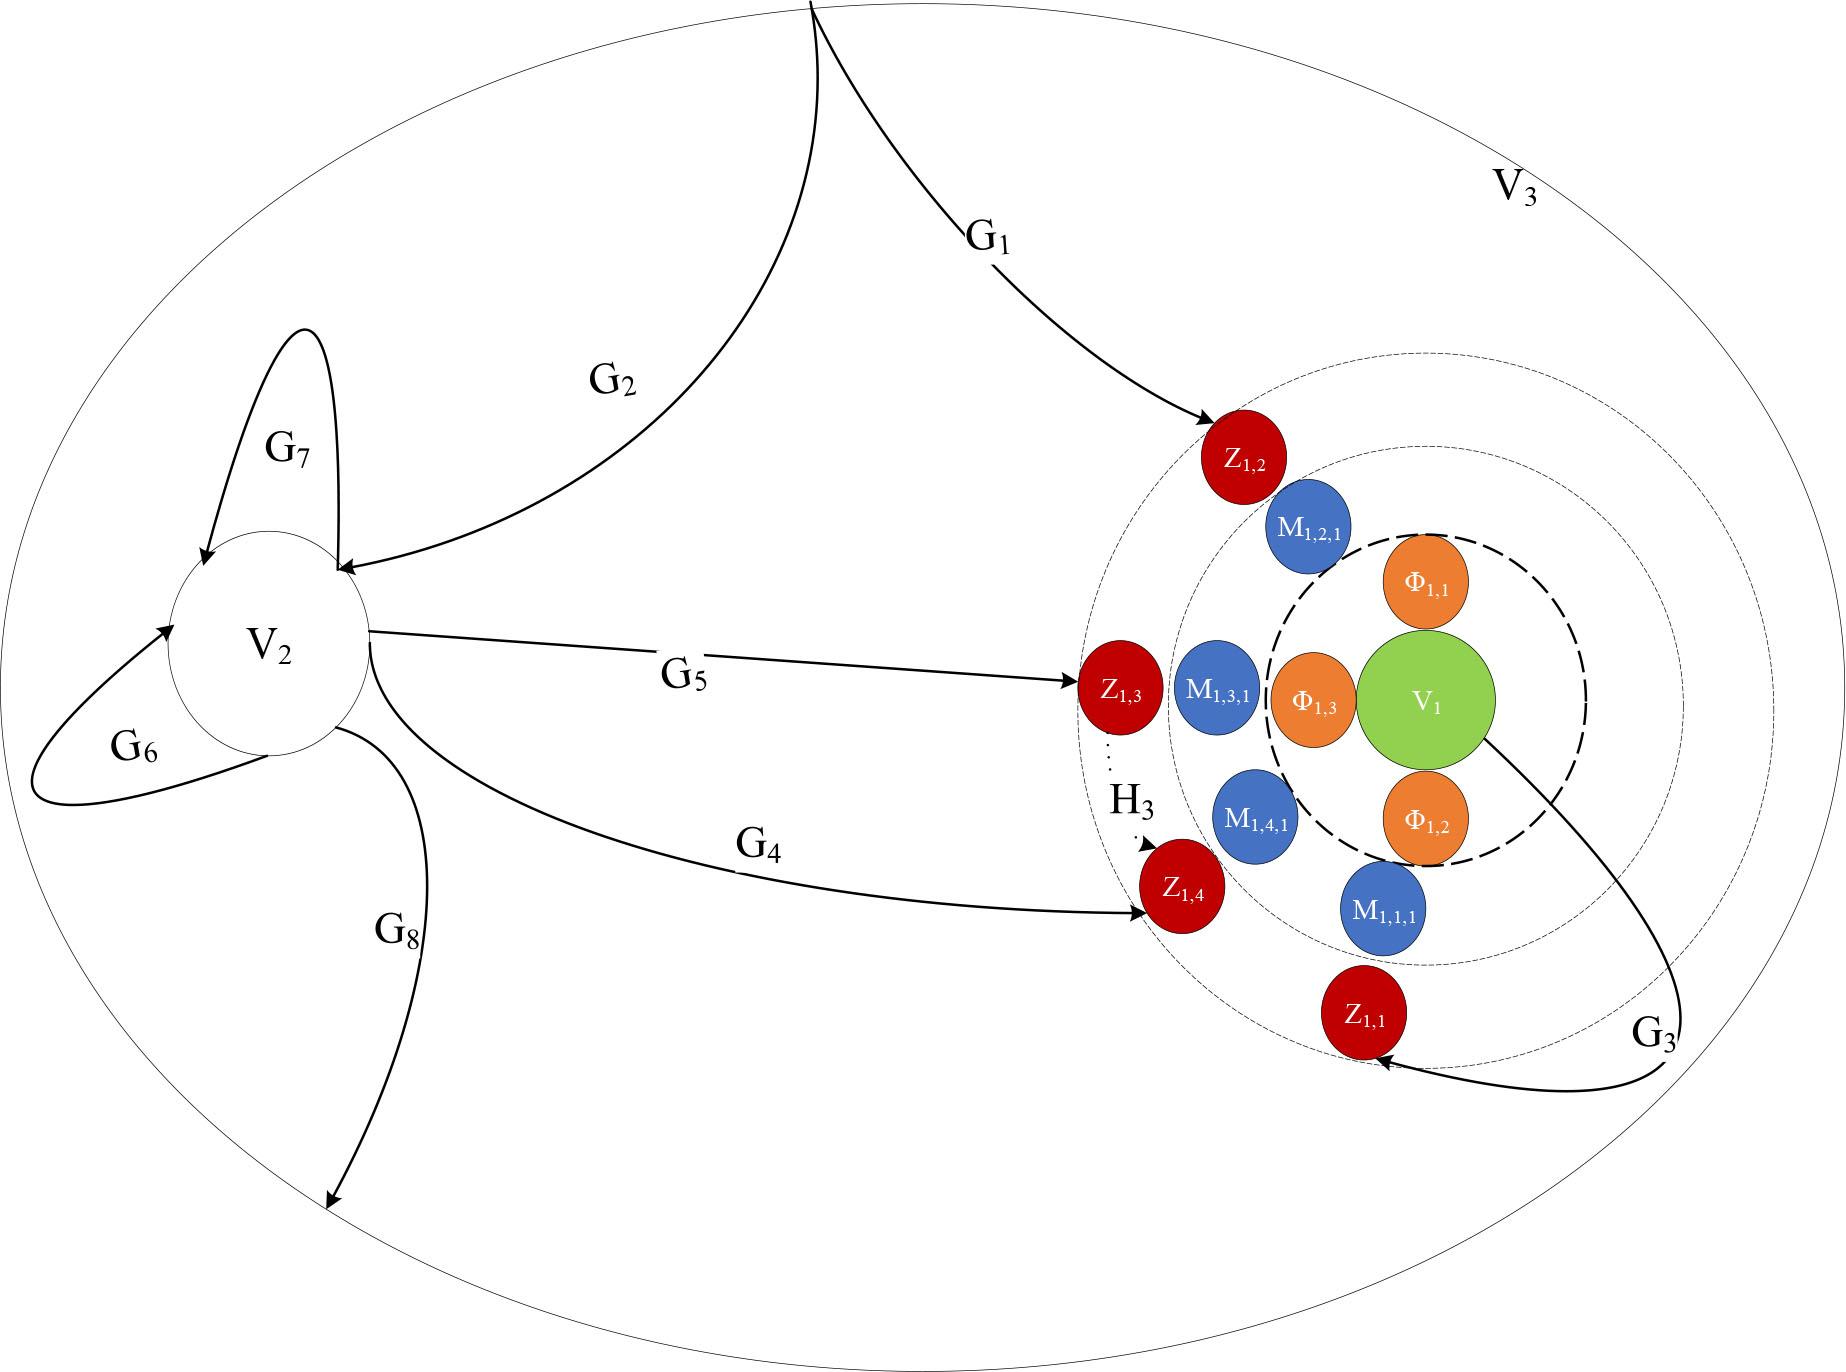
Figure 6
Figure 7
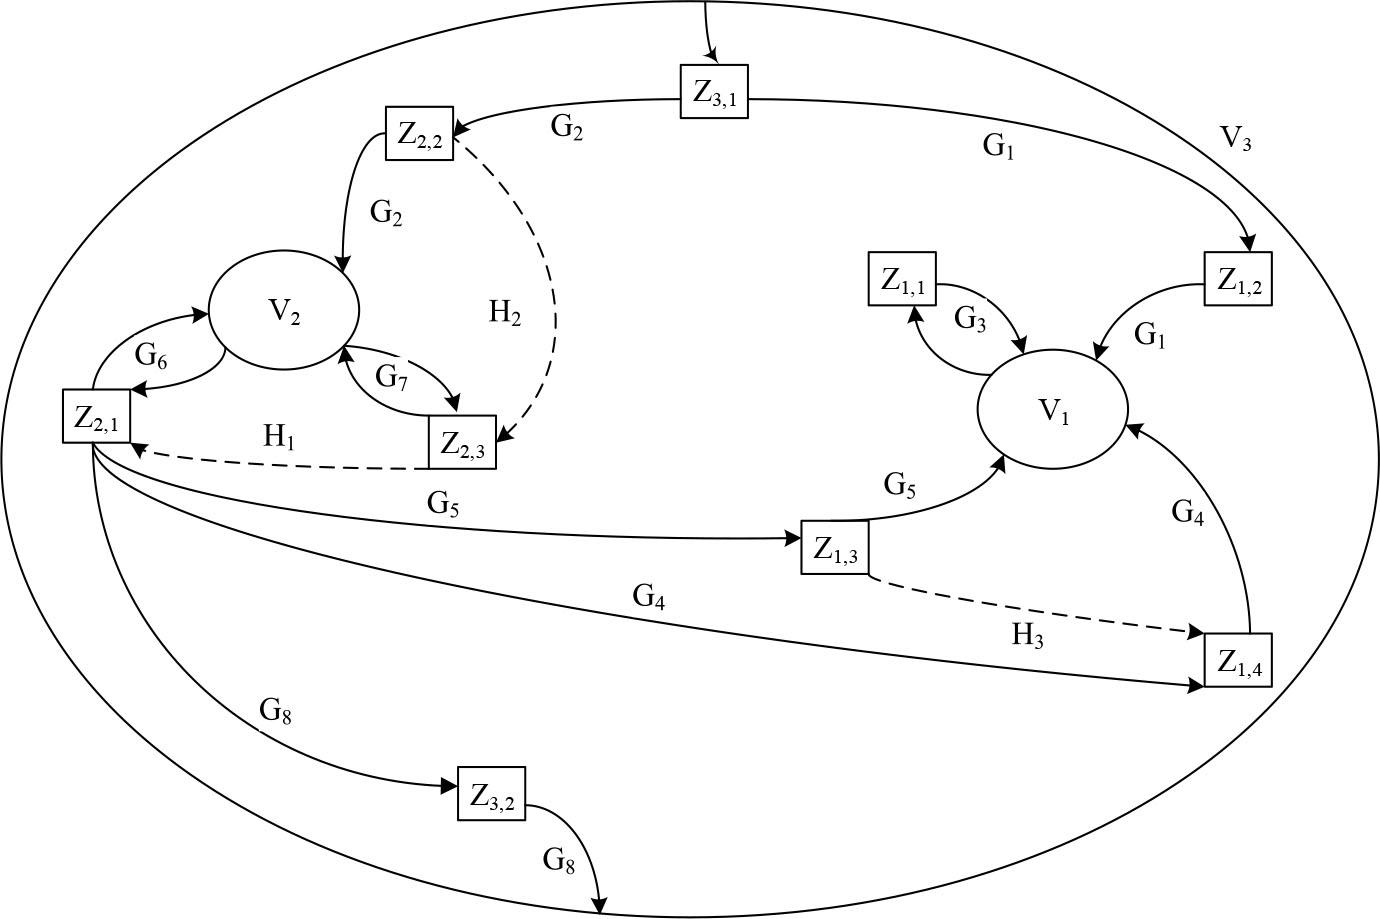
Figure 8
Figure 9
Figure 10
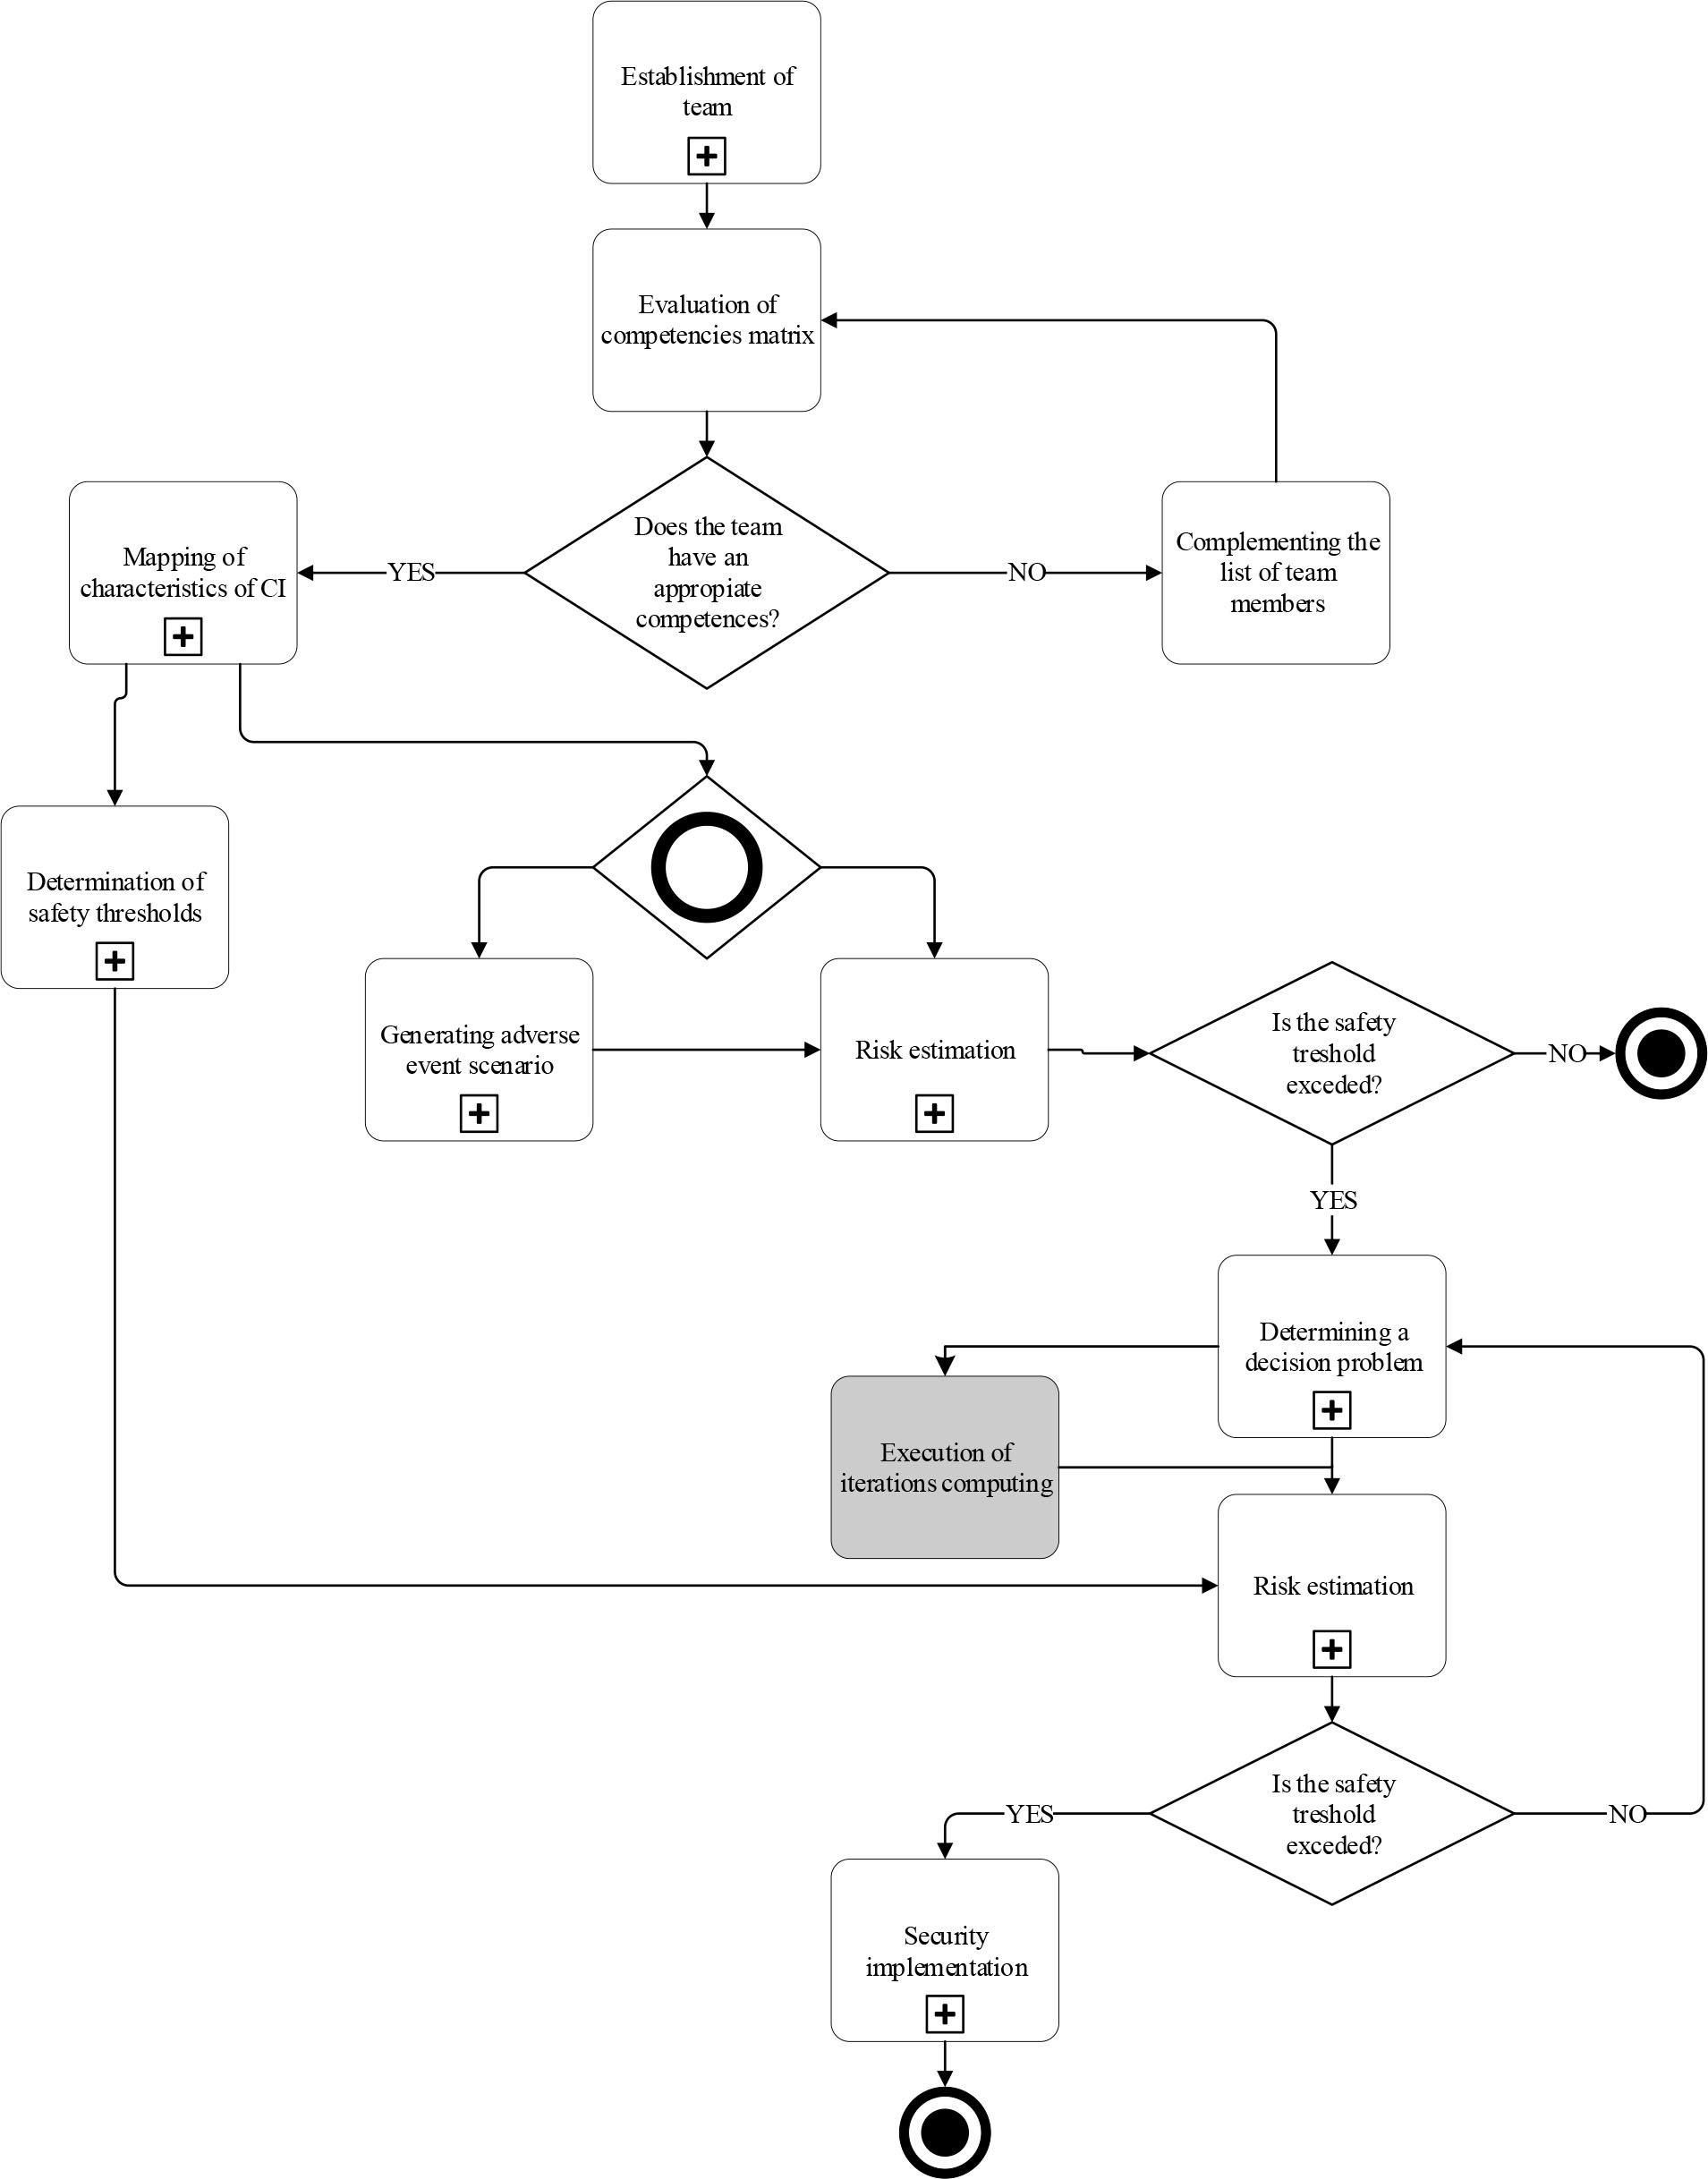
Figure 11
Figure 12
Figure 13
Figure 14
Entities responsible for CI security (Source: Wiśniewski, 2019, p_19)
| Local government level | State | The Council of Ministers | Government Security Center (State level) | |
| Governmental Crisis Management Team (GCMT) | ||||
| Province | Voivod | |||
| Provincial Crisis Management Team (PCMT) | Provincial Center for Crisis Management | |||
| District | District officer | |||
| District Crisis Management Team (DCMT) | District Center for Crisis Management | |||
| Community | Mayor / Mayor of the city | |||
| Commune Crisis Management Team (CCMT) | Commune Center for Crisis Management | |||
| The level of the CI operator | Systems of CI | CI entities | ||
Synthetic record of the situation of the Refinery ORLEN inc_, the Basell Orlen Polyolefins ltd_ and the Production Facility Orlen Oil ltd (Source: Wiśniewski, 2019, p_104)
| CI | Functionalities | Threats | Vulnerability | |||||||
|---|---|---|---|---|---|---|---|---|---|---|
| Mark | Value of functionality | Mark | Type | Excited threat | Probability | Effect | Mark | Degree of reduction of vulnerability | ||
| V1 | Φ1,1 | 93% | Z1,1 | IN | explosion, environmental contamination | 0.7 | −47% (Φ1,1) | M1,1,1 | 0.46 | 0.88 |
| −37% (Φ1,2) | ||||||||||
| −13% (Φ1,3) | M1,1,2 | 0.31 | ||||||||
| Φ1,2 | 93% | Z1,2 | IN | fire | 0.56 | −42% (Φ1,1) | M1,2,1 | 0.16 | 0.31 | |
| −36% (Φ1,2) | ||||||||||
| −46% (Φ1,3) | ||||||||||
| Φ1,3 | 93% | Z1,3 | IN | - | 0.81 | −9% (Φ1,1) | M1,3,1 | 0.16 | 0.31 | |
| −9% (Φ1,3) | ||||||||||
| V2 | Φ2,1 | 93% | Z2,1 | IN | explosion, environmental contamination | 0.42 | –94% (Φ2,1) | M2,1,1 | 0.27 | 0.56 |
| M2,1,2 | 0.18 | |||||||||
| Z2,2 | IN | fire | 0.35 | −48% (Φ2,1) | M2,2,1 | 0.17 | 0.94 | |||
| Z2,3 | IN | - | 0.61 | −5% (Φ2,1) | M2,3,1 | 0.52 | 0.82 | |||
| V3 | Φ3,1 | 93% | Z3,1 | IN | explosion, environmental contamination | 0.58 | −55% (Φ3,1) | M3,1,1 | 0.05 | 0.92 |
| −34% (Φ3,2) | ||||||||||
| −65% (Φ3,3) | M3,1,2 | 0.75 | ||||||||
| Φ3,2 | 93% | Z3,2 | IN | fire | 0.52 | −41% (Φ3,1) | M3,2,1 | 0.14 | 0.83 | |
| −27% (Φ3,2) | ||||||||||
| −38% (Φ3,3) | ||||||||||
| Φ3,3 | 93% | Z3,3 | IN | - | 0.49 | −18% (Φ3,1) | M3,3,1 | 0.26 | 0.36 | |
| −19% (Φ3,2) | ||||||||||
| −15% (Φ3,3) | ||||||||||
An example of synthetic characteristics of the stage of MSMCIS (Source: Wiśniewski, 2019, p_86)
| The name of the stage | Establishment of a team | ||
|---|---|---|---|
| The goal of the stage | Used utilities | Input data | Output data |
| Establishment of the list of members in the analytical team responsible for CI security | Model of CI situation | Characteristics of CI | List of analytical team members |
| Procedure |
| ||
Synthetic record of the risk of functionality loss for considered CI entities after adding new safeguards (Source: Own elaboration)
| CI | Threat | Probability | Effect | Vulnerability | Safeguard | Inherent risk | Residual risk | |
|---|---|---|---|---|---|---|---|---|
| Vα | Zα,β | P | Φα,γ | ΔΦα,γ | Uα,β | ΣMα,β,λ | Ri | Rr |
| V1 | Z1,1 | 0.7 | Φ1,1 | 47% | 0.88 | 0.88 | 28.95% | 0.00% |
| Φ1,2 | 37% | 22.79% | 0.00% | |||||
| Φ1,3 | 13% | 8.01% | 0.00% | |||||
| Z1,2 | 0.56 | Φ1,1 | 42% | 0.81 | 0.72 | 19.05% | 2.12% | |
| Φ1,2 | 39% | 17.69% | 1.97% | |||||
| Φ1,3 | 46% | 20.87% | 2.32% | |||||
| Z1,3 | 0.81 | Φ1,1 | 9% | 0.31 | 0.29 | 2.26% | 0.15% | |
| Φ1,3 | 9% | 2.26% | 0.15% | |||||
| Sum of risk for | Φ1,1 | 50.26% | 2.26% | |||||
| Φ1,2 | 40.48% | 1.97% | ||||||
| Φ1,3 | 31.13% | 2.46% | ||||||
List of CI systems in the EU and Poland (Source: Dz_U_UE_, 2008, No_ 345, Item 75, Article 2b; Dz_U_, 2019, Item 209, Article 3, Point 2)
| European CI systems | Polish CI systems |
|---|---|
|
|
Synthetic record of the risk of functionality loss for considered CI entities (Source: Wiśniewski, 2019, p_105)
| CI | Threat | Probability | Effect | Vulnerability | Safeguard | Inherent risk | Residual risk | |
|---|---|---|---|---|---|---|---|---|
| Vα | Zα,β | P | Φα,γ | ΔΦα,γ | Uα,β | Mα,β | Ri | Rr |
| V1 | Z1,1 | 0.7 | Φ1,1 | 47% | 0.88 | 0.77 | 28.95% | 3.62% |
| Φ1,2 | 37% | 22.79% | 2.85% | |||||
| Φ1,3 | 13% | 8.01% | 1.00% | |||||
| Z1,2 | 0.56 | Φ1,1 | 42% | 0.81 | 0.16 | 19.05% | 15.29% | |
| Φ1,2 | 39% | 17.69% | 14.20% | |||||
| Φ1,3 | 46% | 20.87% | 16.74% | |||||
| Z1,3 | 0.81 | Φ1,1 | 9% | 0.31 | 0.16 | 2.26% | 1.09% | |
| Φ1,3 | 9% | 2.26% | 1.09% | |||||
| Sum of risk for | Φ1,1 | 50.26% | 20.00% | |||||
| Φ1,2 | 40.48% | 17.05% | ||||||
| Φ1,3 | 31.13% | 18.84% | ||||||
| V2 | Z2,1 | 0.42 | Φ2,1 | 94% | 0.56 | 0.45 | 22.11% | 4.34% |
| Z2,2 | 0.35 | Φ2,1 | 48% | 0.91 | 0.17 | 15.29% | 12.43% | |
| Z2,3 | 0.61 | Φ2,1 | 5% | 0.82 | 0.52 | 2.50% | 0.92% | |
| Sum of risk for | Φ2,2 | 39.90% | 17.69% | |||||
| V3 | Z3,1 | 0.58 | Φ3,1 | 55% | 0.92 | 0.8 | 29.35% | 3.83% |
| Φ3,2 | 34% | 18.14% | 2.37% | |||||
| Φ3,3 | 65% | 34.68% | 4.52% | |||||
| Z3,2 | 0.52 | Φ3,1 | 41% | 0.83 | 0.14 | 17.70% | 14.71% | |
| Φ3,2 | 27% | 11.65% | 9.69% | |||||
| Φ3,3 | 38% | 16.40% | 13.63% | |||||
| Z3,3 | 0.49 | Φ3,1 | 18% | 0.36 | 0.26 | 3.18% | 0.88% | |
| Φ3,2 | 19% | 3.35% | 0.93% | |||||
| Φ3,3 | 15% | 2.65% | 0.74% | |||||
| Sum of risk for | Φ3,1 | 50.22% | 19.42% | |||||
| Φ3,2 | 33.15% | 12.99% | ||||||
| Φ3,3 | 53.73% | 18.89% | ||||||