

Figure 1
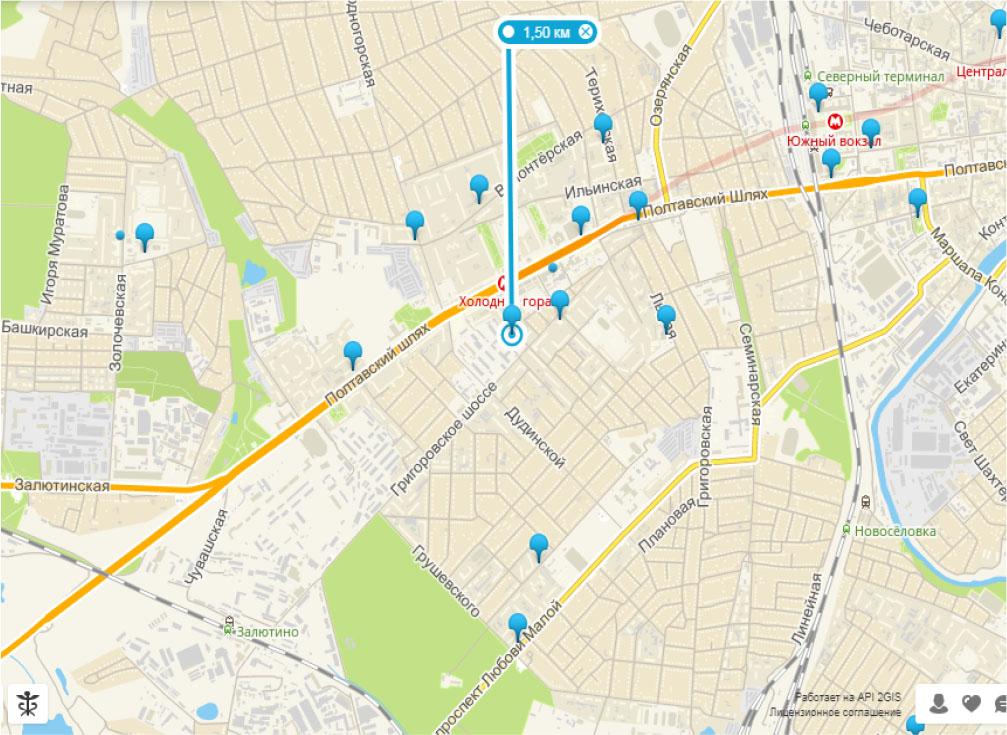
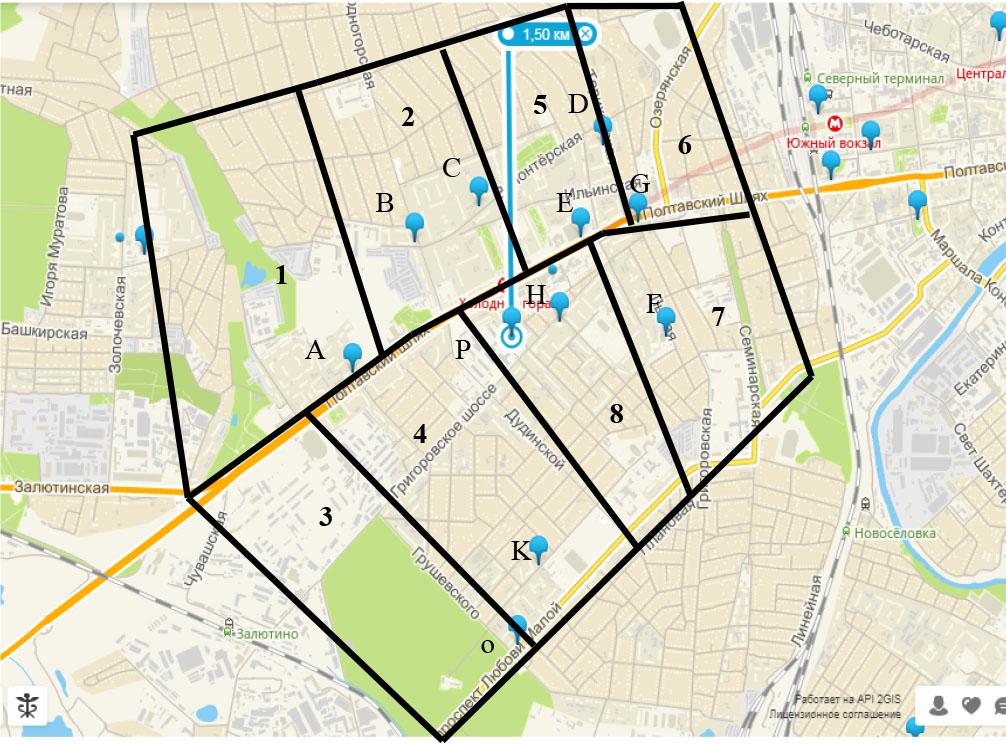
Figure 2
Output data for obtaining time changing models (Source: Authors’ own research)
| № | Time movement, min. | Slope factor | Non-linearity factor | Distance, km | Time of trade service, km | Size of the store, m2 | Total visiting time, min. | |||
|---|---|---|---|---|---|---|---|---|---|---|
| to store | from store | to store | by air | by air | by road | |||||
| 1 | 10 | 11 | 0.990 | 1.010 | 1.23 | 0.57 | 0.7 | 19 | 700 | 40 |
| 2 | 11 | 11 | 0.996 | 1.004 | 1.36 | 0.55 | 0.75 | 22 | 1408 | 44 |
| … | … | … | … | … | … | … | … | … | … | … |
| 86 | 6 | 4 | 1.100 | 0.900 | 1.00 | 0.3 | 0.3 | 12 | 140 | 22 |
Demand attractiveness matrix of visiting a retailers in described zone (Source: Authors’ own research)
| Retailer | Residential zones | |||||||||
|---|---|---|---|---|---|---|---|---|---|---|
| 1 | 2 | 3 | 4 | 5 | 6 | 7 | 8 | 9 | Σ | |
| A | 0.0150 | 0.0104 | 0.0080 | 0.0206 | 0.0093 | 0.0055 | 0.0132 | 0.0113 | 0.0014 | 0.0948 |
| B | 0.0125 | 0.0095 | 0.0084 | 0.0177 | 0.0085 | 0.0055 | 0.0116 | 0.0103 | 0.0014 | 0.0853 |
| C | 0.0153 | 0.0091 | 0.0070 | 0.0227 | 0.0089 | 0.0050 | 0.0144 | 0.0121 | 0.0014 | 0.0958 |
| D | 0.0176 | 0.0122 | 0.0091 | 0.0260 | 0.0118 | 0.0064 | 0.0163 | 0.0140 | 0.0018 | 0.1152 |
| E | 0.0125 | 0.0095 | 0.0087 | 0.0183 | 0.0094 | 0.0064 | 0.0125 | 0.0111 | 0.0016 | 0.0900 |
| F | 0.0148 | 0.0115 | 0.0109 | 0.0217 | 0.0115 | 0.0080 | 0.0146 | 0.0129 | 0.0019 | 0.1079 |
| G | 0.0162 | 0.0109 | 0.0087 | 0.0263 | 0.0119 | 0.0064 | 0.0180 | 0.0155 | 0.0019 | 0.1159 |
| H | 0.0131 | 0.0080 | 0.0064 | 0.0218 | 0.0082 | 0.0047 | 0.0168 | 0.0141 | 0.0014 | 0.0944 |
| I | 0.0131 | 0.0085 | 0.0070 | 0.0219 | 0.0091 | 0.0052 | 0.0183 | 0.0189 | 0.0017 | 0.1038 |
| K | 0.0132 | 0.0097 | 0.0084 | 0.0202 | 0.0104 | 0.0064 | 0.0142 | 0.0127 | 0.0018 | 0.0970 |
| Σ | 0.1432 | 0.0993 | 0.0827 | 0.2172 | 0.0988 | 0.0595 | 0.1501 | 0.1329 | 0.0164 | 1 |
Results of model evaluation (Source: Authors’ own research)
| Indicator | Value for energy cost model | Value of the time cost model |
|---|---|---|
| Student Criterion: | ||
| • calculated | 1.97 | 1.97 |
| • actual value of the slope factor | 2.007 | 2.281 |
| • actual value of the none-linearity factor | 7.325 | 6.956 |
| • actual value of the distance between the points “by air” | 67.64 | 66.097 |
| Fischer Criterion: | ||
| • calculated | 3.88 | 3.88 |
| • actual | 6730.09 | 6268.63 |
| Correlation coefficient | 0.99 | 0.99 |
| Determination coefficient | 0.89 | 0.98 |
Output data for obtaining models of change in calories consumed (Source: Authors’ own research)
| № | Energy expenses on the road, kcal. | Slope factor | Non-linearity factor | Distance, km | Energy expenses at retailer, kcal. | Size of the retailer, m2 | Total energy expenses per visit, kcal. | |||
|---|---|---|---|---|---|---|---|---|---|---|
| to store | from store | to store | from store | by air | by road | |||||
| 1 | 45 | 49 | 0.990 | 1.010 | 1.23 | 0.57 | 0.7 | 8 | 700 | 102 |
| 2 | 54 | 53 | 0.996 | 1.004 | 1.36 | 0.55 | 0.75 | 18 | 1408 | 125 |
| 3 | 72 | 73 | 0.995 | 1.005 | 1.10 | 0.91 | 1 | 5 | 576 | 150 |
| 4 | 37 | 39 | 0.987 | 1.013 | 1.31 | 0.42 | 0.55 | 9 | 500 | 85 |
| … | … | … | … | … | … | … | … | … | … | … |
| 86 | 30 | 21 | 1.100 | 0.900 | 1.00 | 0.3 | 0.3 | 5 | 140 | 56 |
OD matrix (Source: Authors’ own research)
| Retailer | Monetary expression of shopping time spent on purchases, UAH | Monetary expression of the energy (fatigue) spent on purchases, UAH | ||||||||||||||
|---|---|---|---|---|---|---|---|---|---|---|---|---|---|---|---|---|
| Zone | Zone | |||||||||||||||
| 1 | 2 | 3 | 4 | 5 | 6 | 7 | 8 | 1 | 2 | 3 | 4 | 5 | 6 | 7 | 8 | |
| A | 11.46 | 13.42 | 12.05 | 12.32 | 14.95 | 19.49 | 18.42 | 14.57 | 2.53 | 3.19 | 2.73 | 2.82 | 3.71 | 5.23 | 4.88 | 3.58 |
| B | 10.26 | 9.68 | 15.75 | 13.62 | 11.70 | 15.20 | 16.47 | 13.73 | 1.79 | 1.62 | 3.40 | 2.78 | 2.22 | 3.24 | 3.61 | 2.81 |
| C | 10.44 | 7.02 | 15.27 | 13.43 | 9.37 | 12.67 | 14.68 | 12.53 | 2.38 | 1.24 | 4.02 | 3.40 | 2.03 | 3.14 | 3.83 | 3.10 |
| D | 14.90 | 9.33 | 18.02 | 14.62 | 6.67 | 7.66 | 11.22 | 11.74 | 3.57 | 1.92 | 4.52 | 3.50 | 1.12 | 1.41 | 2.49 | 2.64 |
| E | 20.57 | 17.56 | 23.40 | 19.70 | 14.25 | 16.98 | 16.31 | 17.43 | 4.02 | 3.16 | 4.86 | 3.79 | 2.20 | 2.99 | 2.81 | 3.13 |
| G | 16.08 | 14.43 | 18.54 | 13.91 | 8.28 | 9.55 | 8.87 | 9.91 | 4.12 | 3.57 | 4.96 | 3.40 | 1.50 | 1.93 | 1.70 | 2.06 |
| H | 14.04 | 11.04 | 13.16 | 8.88 | 10.72 | 13.38 | 10.16 | 7.78 | 3.26 | 2.36 | 3.00 | 1.71 | 2.26 | 3.07 | 2.10 | 1.39 |
| F | 16.84 | 13.61 | 15.67 | 10.48 | 11.70 | 12.35 | 6.77 | 5.52 | 4.60 | 3.52 | 4.22 | 2.47 | 2.88 | 3.10 | 1.22 | 0.80 |
| K | 18.11 | 19.00 | 7.33 | 9.76 | 20.29 | 23.11 | 16.93 | 14.68 | 4.35 | 4.62 | 1.21 | 1.93 | 4.99 | 5.82 | 4.01 | 3.36 |
Origin-Destination generalized costs matrix on visiting retailer from different origins (UAH) (Source: Authors’ own research)
| Retailer | Residential zones | ||||||||
|---|---|---|---|---|---|---|---|---|---|
| 1 | 2 | 3 | 4 | 5 | 6 | 7 | 8 | 9 | |
| A | 57.4 | 61.6 | 60.6 | 55.7 | 58.7 | 54.4 | 57.7 | 55.1 | 60.2 |
| B | 51.0 | 55.7 | 55.0 | 52.3 | 52.2 | 47.8 | 51.8 | 49.9 | 54.8 |
| C | 67.7 | 65.6 | 63.0 | 63.8 | 68.9 | 63.5 | 63.5 | 59.6 | 55.9 |
| D | 61.7 | 64.0 | 61.5 | 60.3 | 60.1 | 54.9 | 57.9 | 54.2 | 57.7 |
| E | 57.6 | 59.4 | 57.0 | 55.0 | 56.9 | 51.7 | 55.2 | 49.4 | 56.8 |
| F | 62.6 | 59.4 | 54.8 | 58.2 | 65.0 | 59.4 | 60.3 | 54.9 | 50.3 |
| G | 57.7 | 60.1 | 55.8 | 55.7 | 57.0 | 51.7 | 54.7 | 49.1 | 51.0 |
| H | 57.5 | 59.6 | 52.1 | 53.3 | 59.6 | 54.5 | 58.7 | 51.4 | 46.5 |
| I | 61.5 | 60.5 | 55.7 | 57.3 | 62.2 | 58.0 | 60.3 | 53.3 | 50.0 |
| K | 61.4 | 57.6 | 53.2 | 57.1 | 64.3 | 59.0 | 59.9 | 54.3 | 49.4 |