

Figure 1
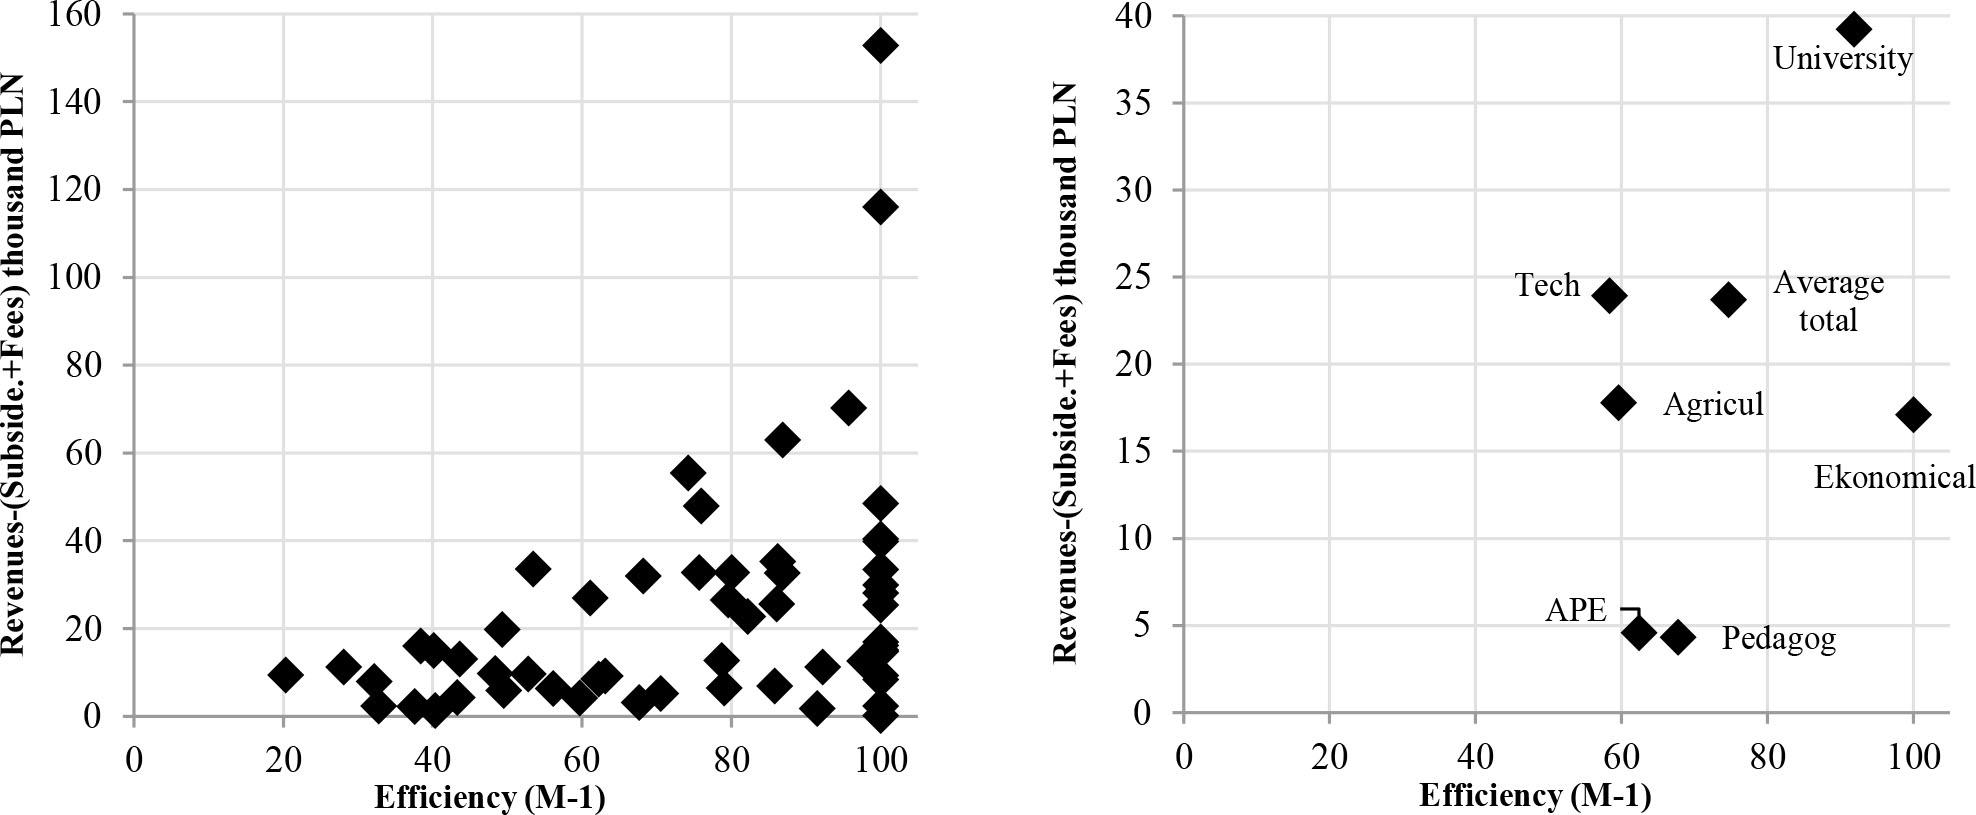
Figure 2
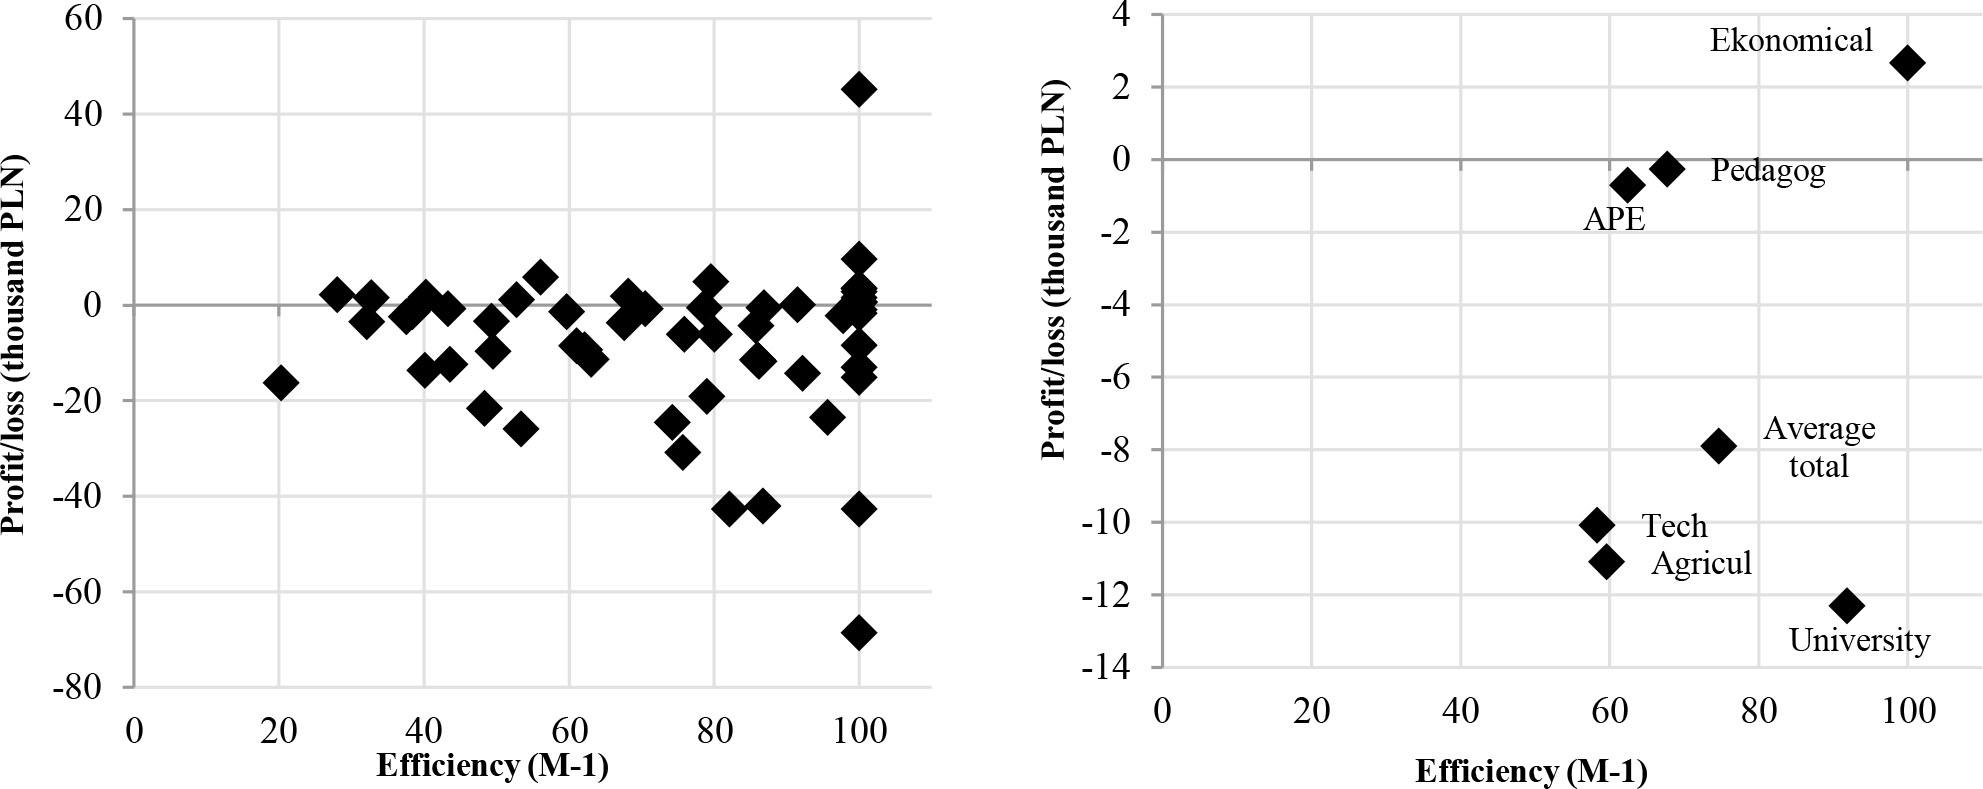
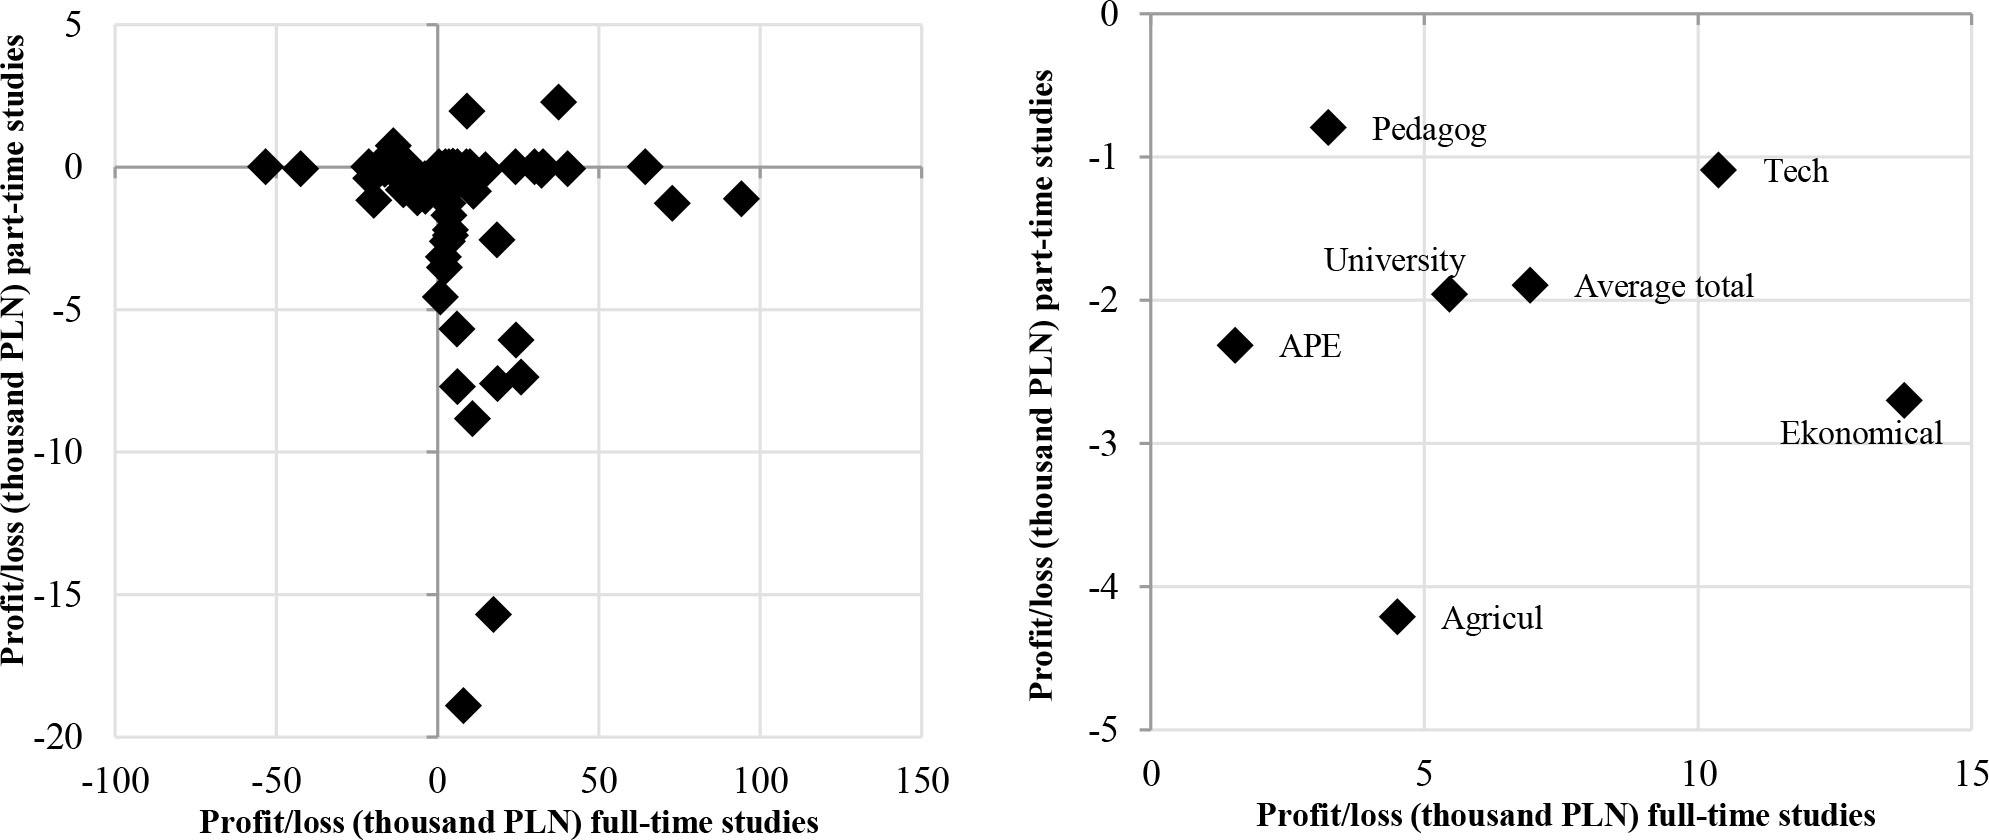
Figure 3
Characteristics of the research sample according to variables included in EBM models (Source: Own study)
| Specification | X1 | X2 | X3 | X4 | Y1 | Y2 | Y3 |
|---|---|---|---|---|---|---|---|
| Minimum | 57 | 8826 | 8610 | 1749 | 95 | 47 | 29 |
| Average | 1078 | 212563 | 188864 | 476987 | 4234 | 169 | 185 |
| Maximum | 3933 | 890193 | 737342 | 2452276 | 10823 | 330 | 559 |
Input and output adopted for testing the efficiency of teaching activity in empirical models (Source: Own study)
| Variable | Model M1 | Model M2 |
|---|---|---|
| X1 – number of academic teachers | + | + |
| X2 – the total value of teaching income | + | − |
| X3 – the total value of subsidies from the state budget and fees for educational services rendered | − | + |
| X4 – the value of fixed assets | + | + |
| Y1 – total number of graduates of 1st, 2nd degree and uniform Master's studies | + | + |
| Y2 – the number of doctor's degrees awarded | + | + |
| Y3 – number of post-graduate certificates issued | + | + |
Ranking of universities in terms of the total efficiency of teaching activity (Source: own study)
| DMU | M1 | M2 | Difference (M1–M2) | DMU | M1 | M2 | Difference (M1–M2) |
|---|---|---|---|---|---|---|---|
| Result | Result | Result | Result | ||||
| U1 | 1.00 | 1.00 | 0.00 | U18 | 0.79 | 0.76 | 0.03 |
| U3 | 1.00 | 1.00 | 0.00 | U25 | 0.76 | 0.76 | 0.00 |
| U5 | 1.00 | 1.00 | 0.00 | U36 | 0.76 | 0.76 | 0.00 |
| U6 | 1.00 | 1.00 | 0.00 | U20 | 0.74 | 0.74 | 0.00 |
| U8 | 1.00 | 1.00 | 0.00 | U58 | 0.70 | 0.74 | −0.04 |
| U11 | 1.00 | 1.00 | 0.00 | U28 | 0.68 | 0.71 | −0.03 |
| U12 | 1.00 | 1.00 | 0.00 | U46 | 0.68 | 0.66 | 0.02 |
| U14 | 1.00 | 1.00 | 0.00 | U51 | 0.63 | 0.61 | 0.02 |
| U15 | 1.00 | 1.00 | 0.00 | U16 | 0.62 | 0.60 | 0.02 |
| U29 | 1.00 | 1.00 | 0.00 | U52 | 0.61 | 0.63 | −0.02 |
| U37 | 1.00 | 1.00 | 0.00 | U53 | 0.60 | 0.60 | 0.00 |
| U38 | 1.00 | 1.00 | 0.00 | U34 | 0.56 | 0.57 | −0.01 |
| U39 | 1.00 | 1.00 | 0.00 | U31 | 0.53 | 0.53 | 0.00 |
| U40 | 1.00 | 1.00 | 0.00 | U57 | 0.53 | 0.56 | −0.03 |
| U41 | 1.00 | 1.00 | 0.00 | U48 | 0.50 | 0.48 | 0.01 |
| U42 | 1.00 | 1.00 | 0.00 | U49 | 0.49 | 0.51 | −0.02 |
| U59 | 1.00 | 1.00 | 0.00 | U50 | 0.48 | 0.47 | 0.01 |
| U44 | 0.98 | 0.98 | 0.00 | U21 | 0.44 | 0.44 | 0.00 |
| U4 | 0.96 | 0.96 | 0.00 | U27 | 0.43 | 0.43 | 0.01 |
| U2 | 0.92 | 0.93 | −0.01 | U19 | 0.40 | 0.40 | 0.01 |
| U54 | 0.91 | 0.91 | 0.01 | U43 | 0.40 | 0.38 | 0.02 |
| U7 | 0.87 | 0.98 | −0.11 | U30 | 0.38 | 0.40 | −0.02 |
| U13 | 0.87 | 0.87 | −0.01 | U56 | 0.38 | 0.36 | 0.01 |
| U10 | 0.86 | 0.89 | −0.03 | U45 | 0.33 | 0.33 | 0.00 |
| U17 | 0.86 | 0.85 | 0.01 | U23 | 0.32 | 0.31 | 0.01 |
| U47 | 0.86 | 0.87 | −0.01 | U32 | 0.28 | 0.29 | −0.01 |
| U35 | 0.82 | 0.86 | −0.03 | U26 | 0.20 | 0.21 | −0.01 |
| U24 | 0.80 | 0.80 | 0.00 | Average | 0.75 | 0.75 | 0.00 |
| U33 | 0.80 | 0.81 | −0.01 | Standard deviation | 0.24 | 0.25 | 0.02 |
| U9 | 0.79 | 0.80 | −0.02 | ||||