
Table 1.
Composition of the Steiner nutrient solution and chemical sources used in this experiment.
| Nutrient | Concentration (mg · L−1) | Chemical sources | Brand |
|---|---|---|---|
| N | 168.00 | Ca(NO3)2 · 4H2O and KNO3 | Meyer and Meyer |
| P | 31.00 | KH2PO4 | J.T. Baker |
| K | 273.00 | KNO3, K2SO4 and KH2PO4 | Meyer, J.T. Baker, and Meyer |
| Ca | 180.00 | Ca(NO3)2 · 4H2O | Meyer |
| Mg | 48.00 | MgSO4 · 7H2O | Meyer |
| S | 112.00 | K2SO4 and MgSO4 · 7H2O | J.T. Baker and Meyer |
| Fe | 5.00 | Fe-EDTA1 | Sigma-Adrich, J.T. Baker and Meyer |
| Cu | 0.02 | CuSO4 · 5H2O | Fermont |
| Zn | 0.11 | ZnSO4 · 7H2O | Fermont |
| Mn | 0.62 | MnSO4 · H2O | Fermont |
| B | 0.44 | H3BO3 | J.T. Baker |
| Mo | 0.10 | H2MoO4 · H2O | J.T. Baker |
1 Source: According to the methodology described by Steiner and van Winden (1970).
Table 2.
Significance of the study factors and their interaction in growth variables of lettuce (Lactuca sativa) cv. ‘Ruby Sky’ plants.
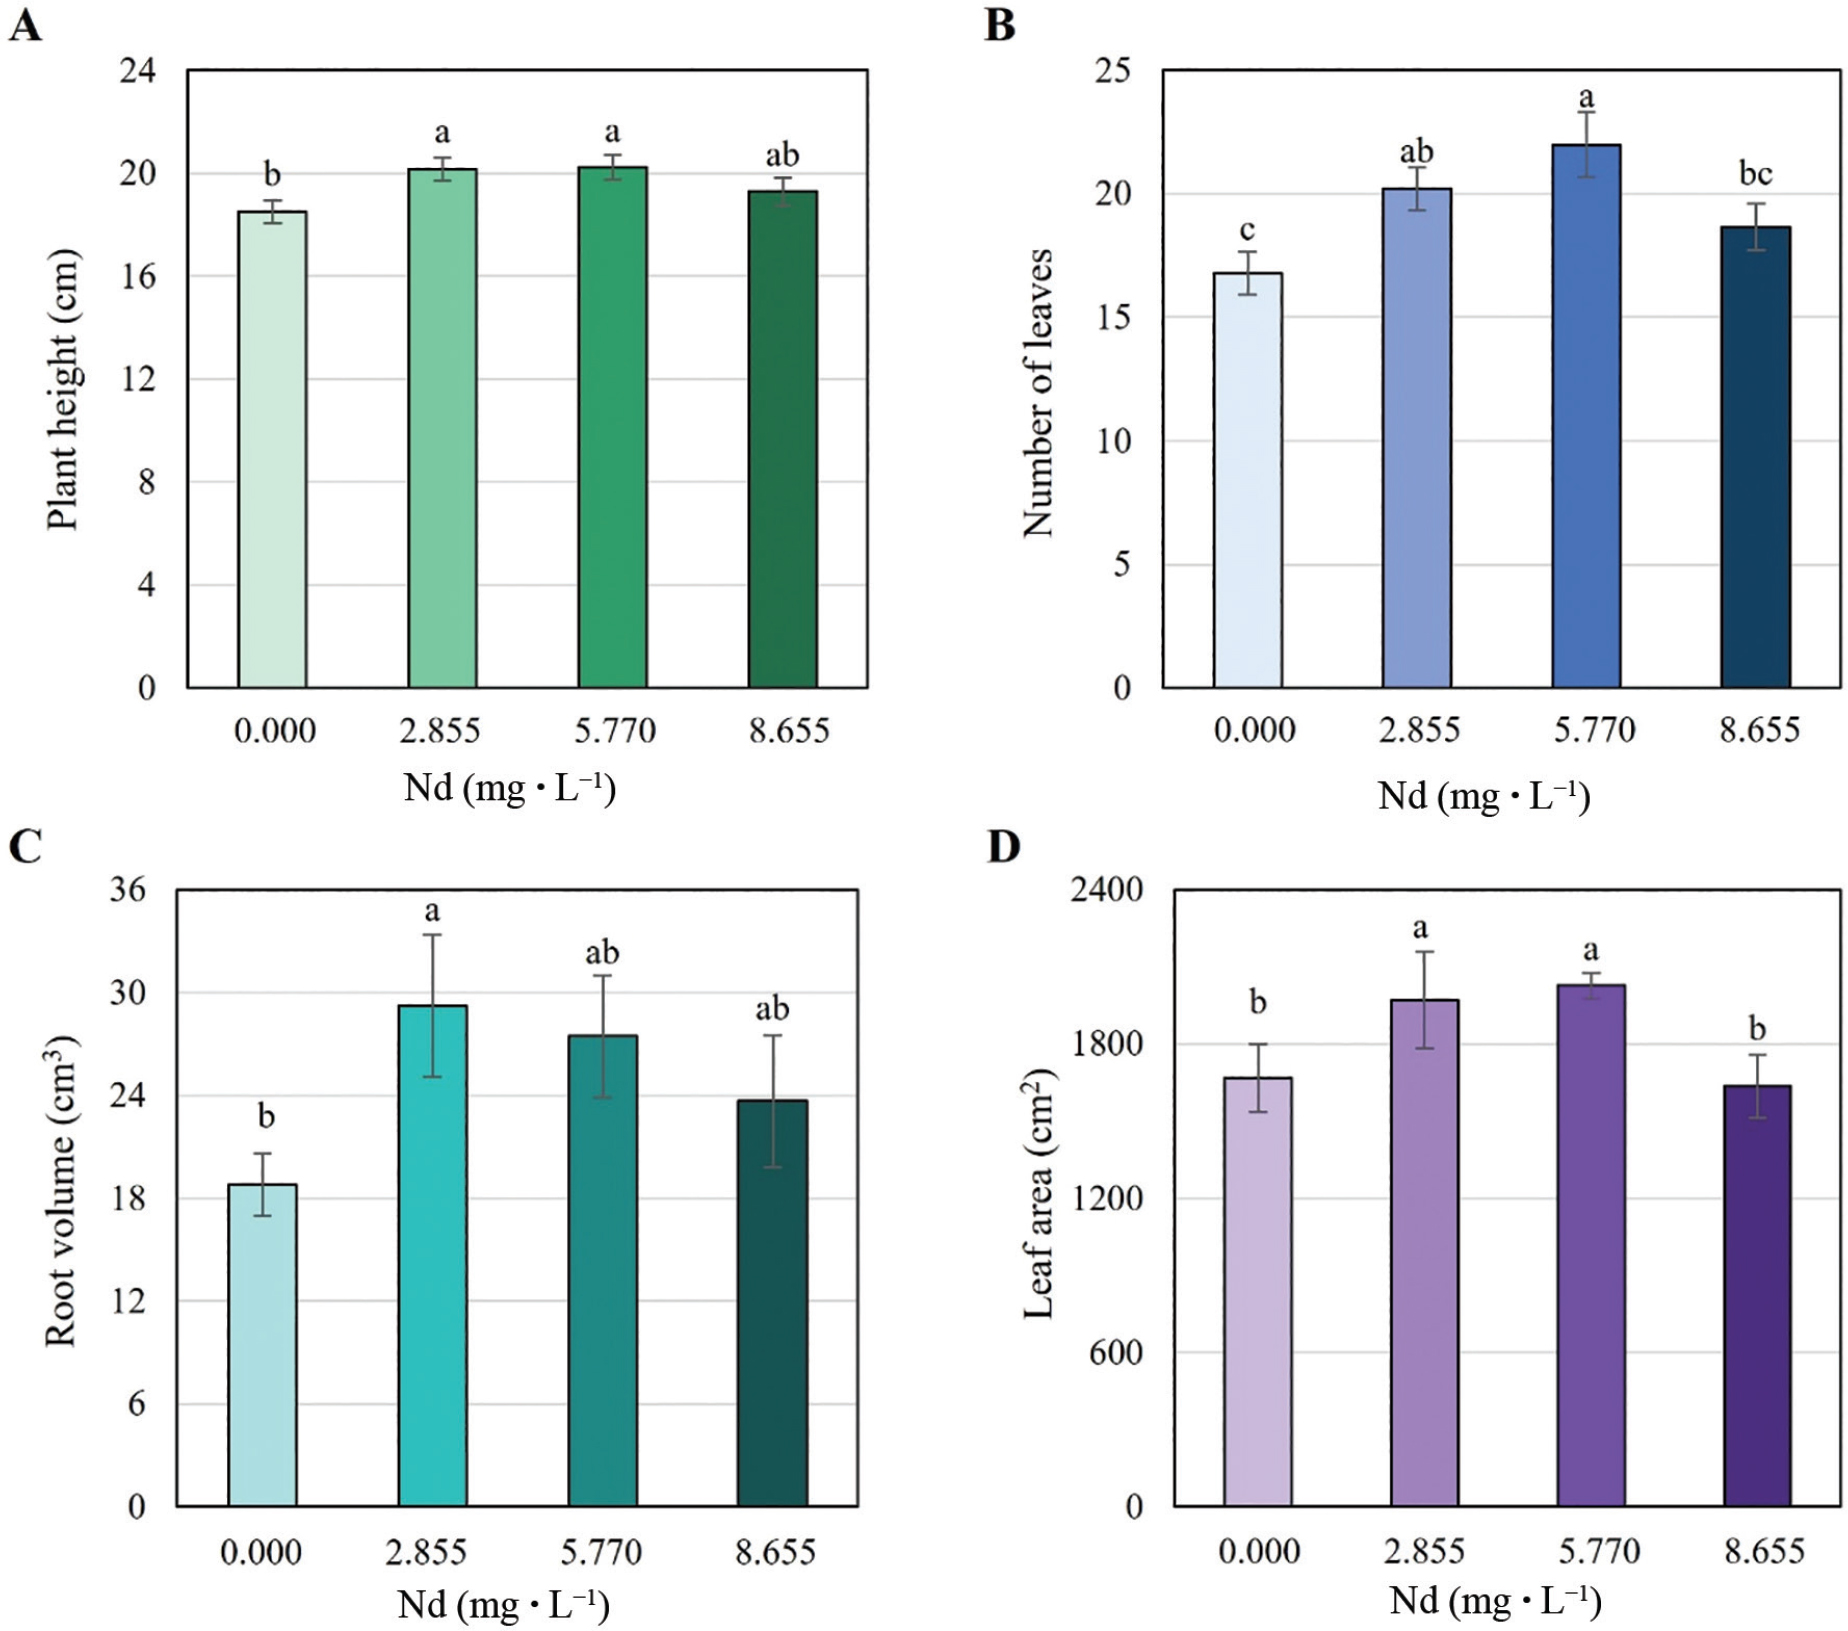
Figure 1.
Plant height (A), number of leaves (B), root volume (C) and leaf area (D) of lettuce (Lactuca sativa) cv. ‘Ruby Sky’ treated for 48 days with different concentrations of Nd (0.000, 2.885, 5.770 and 8.655 mg · L−1). Bars ± SD (standard deviation) with different letters in each subfigure indicate significant statistical differences (Tukey, p ≤ 0.05).
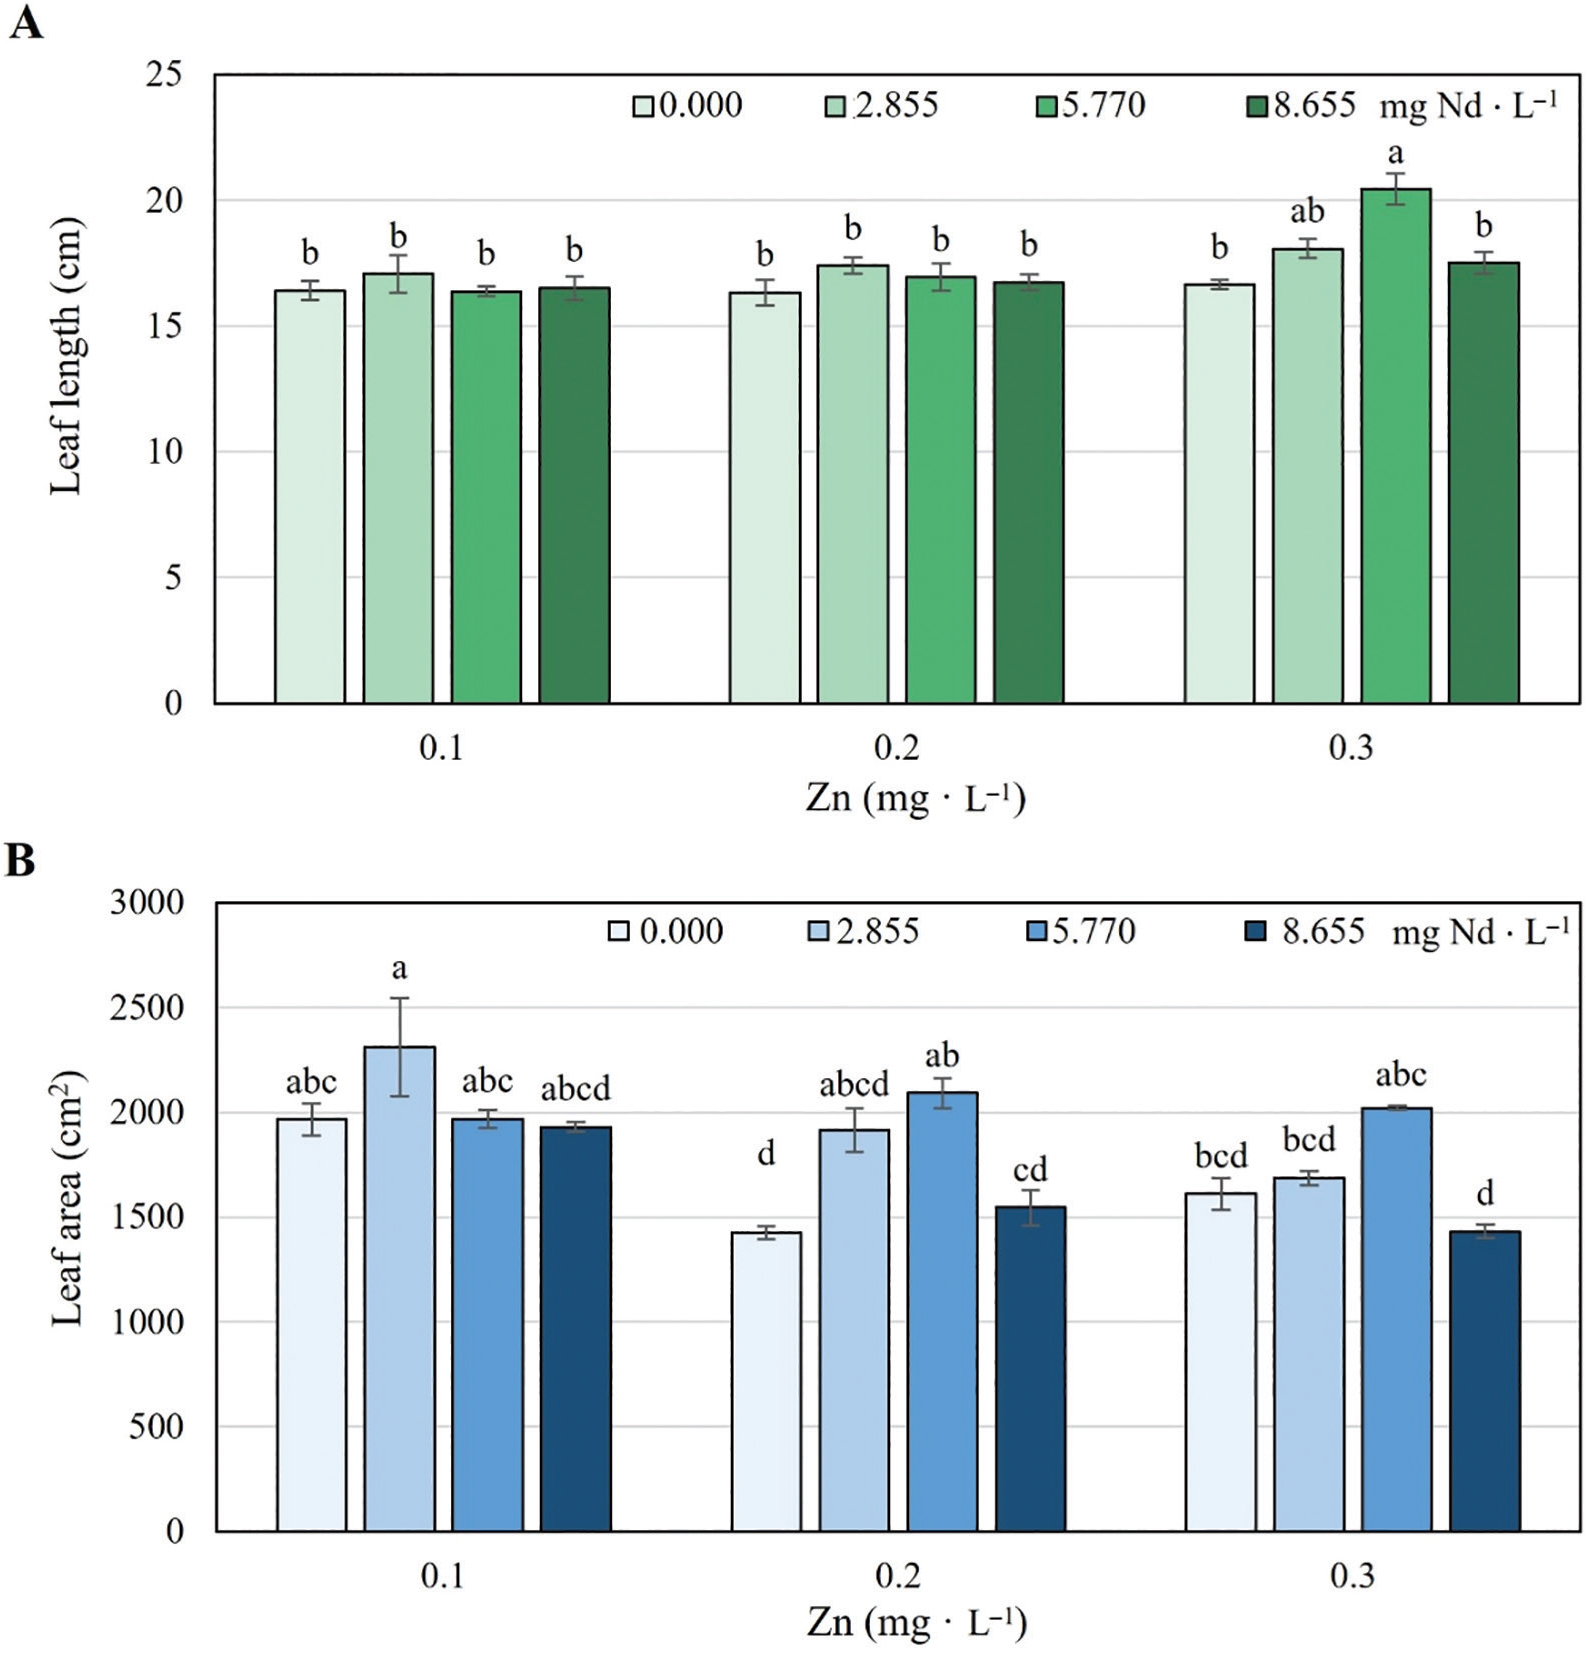
Figure 2.
Leaf length (A) and leaf area (B) of lettuce (Lactuca sativa) cv. ‘Ruby Sky’ plants treated for 48 days with different concentrations of Nd (0.000, 2.885, 5.770 and 8.655 mg · L−1) and Zn (0.1, 0.2 and 0.3 mg · L−1). Bars ± SD (standard deviation) with different letters in each subfigure indicate significant statistical differences (Tukey, p ≤ 0.05).
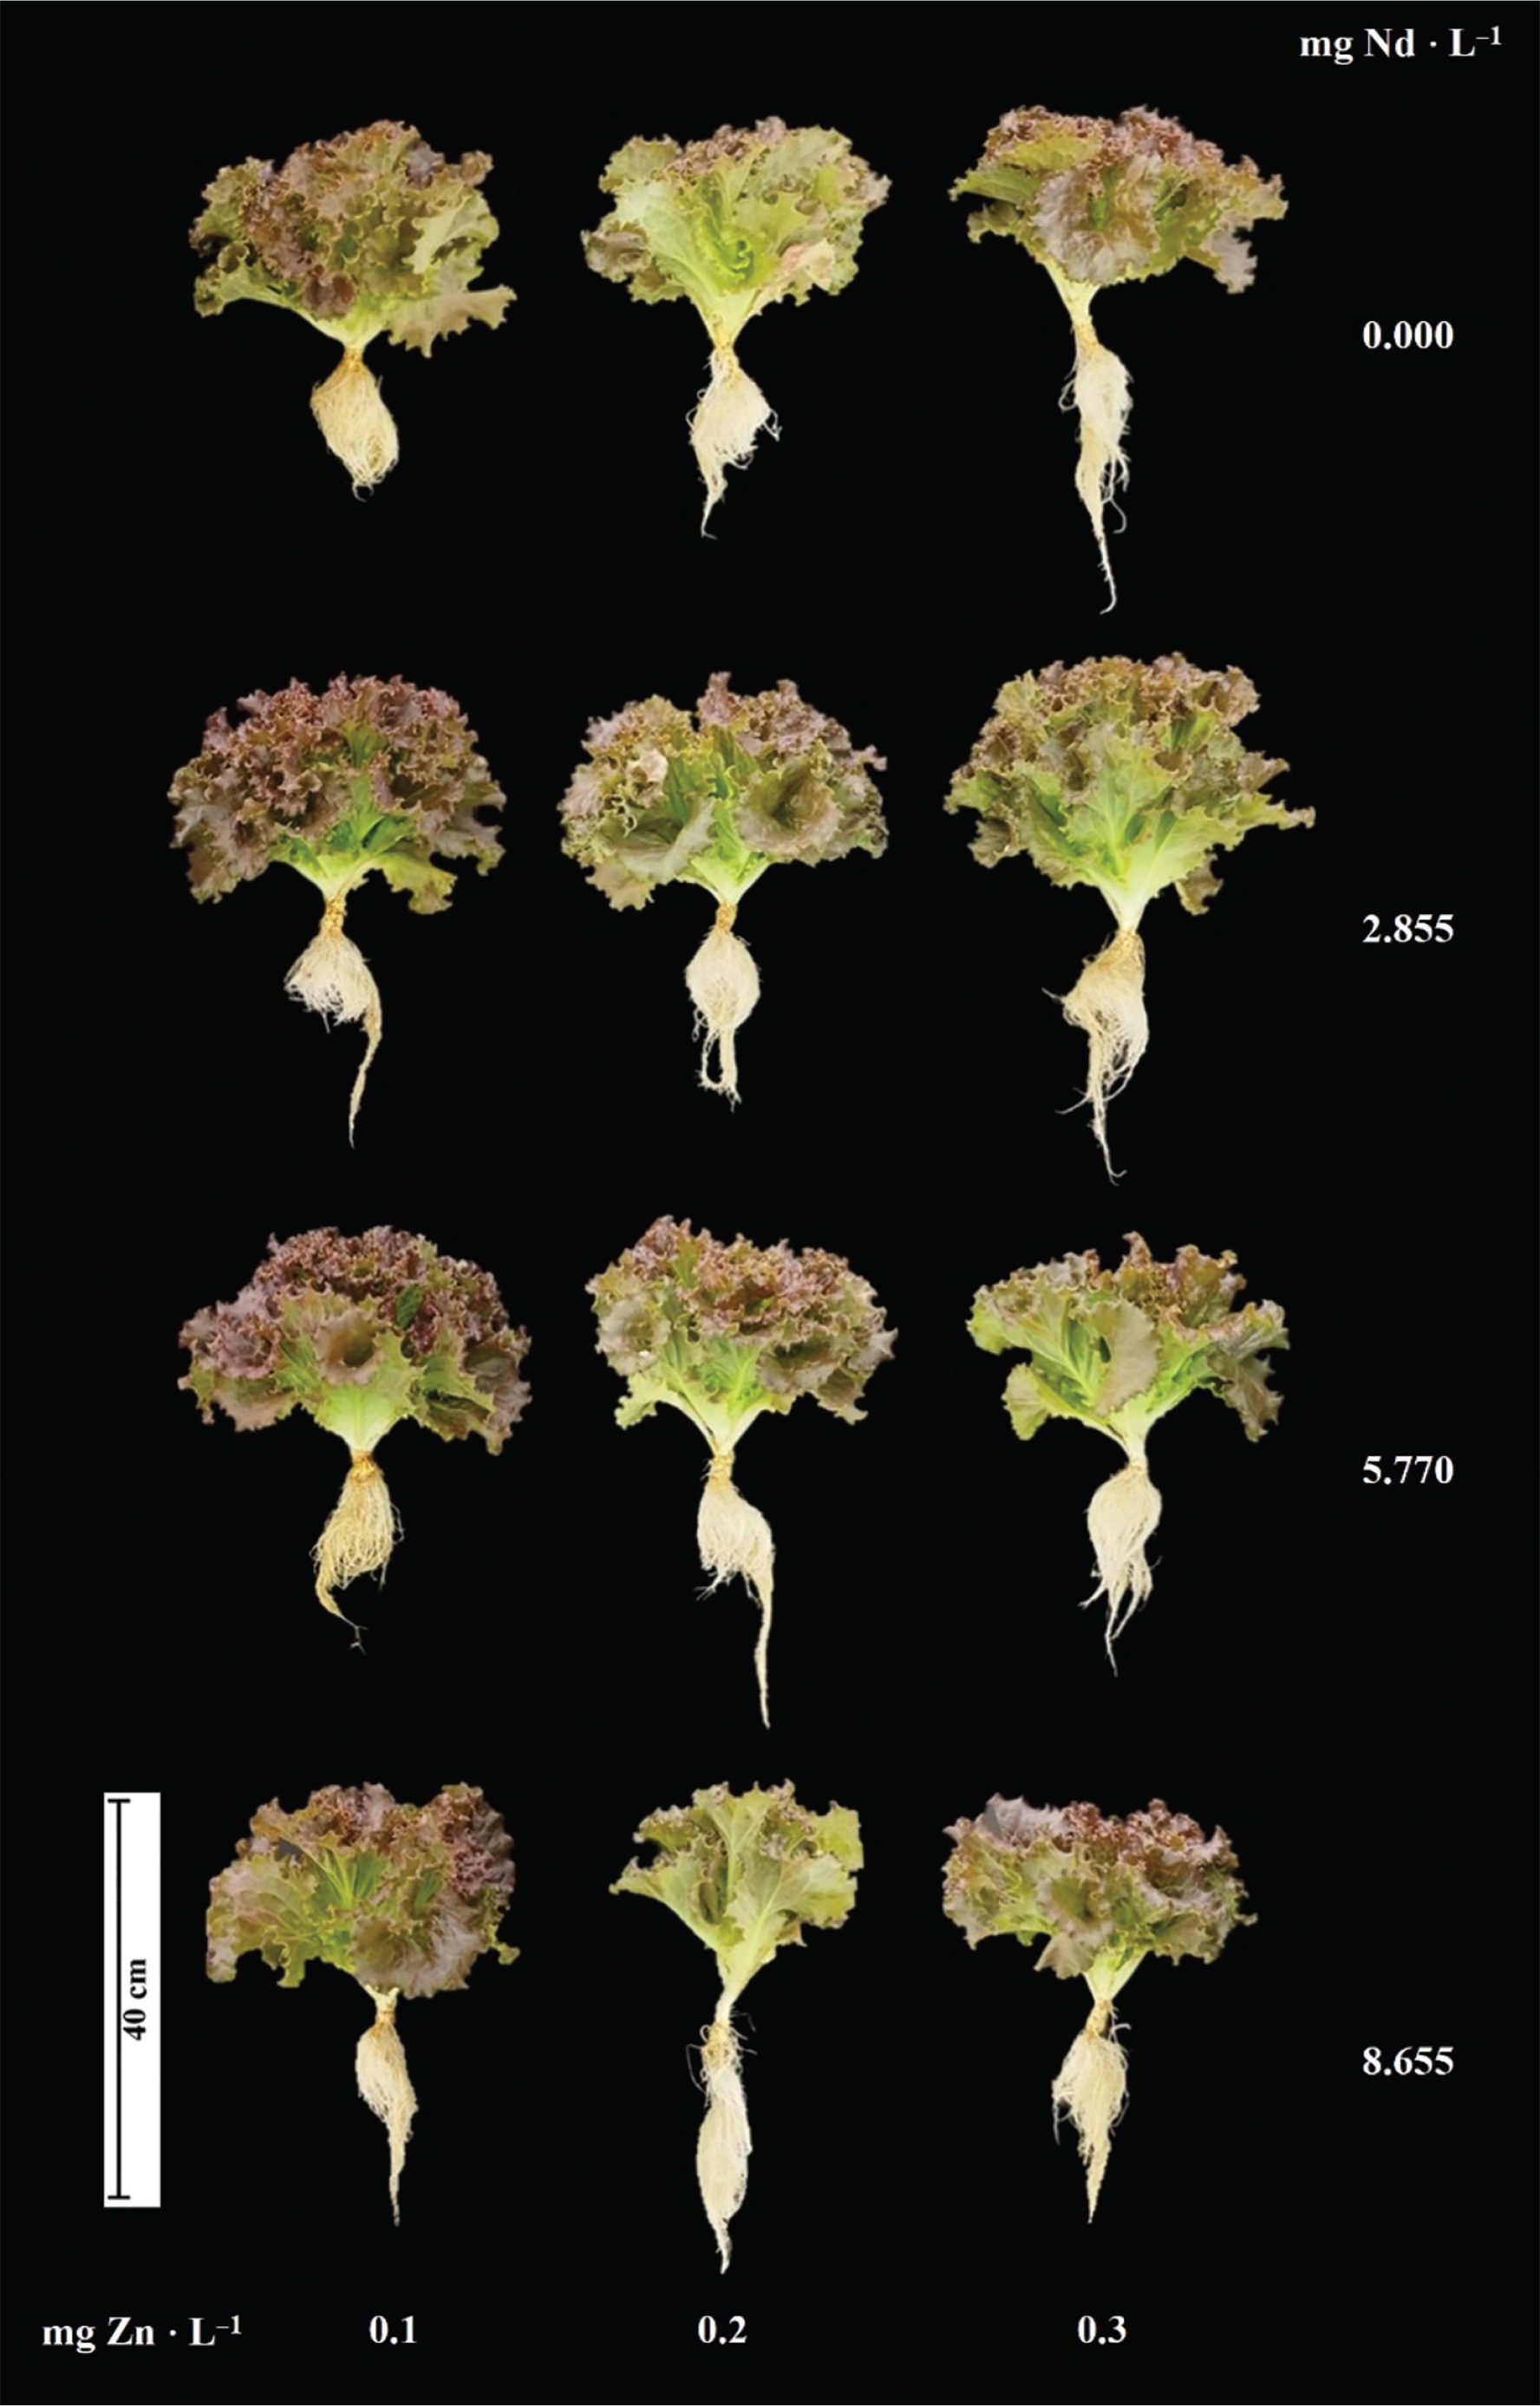
Figure 3.
Growth of lettuce (Lactuca sativa) cv. ‘Ruby Sky’ plants treated for 48 days with different concentrations of Nd (0.000, 2.885, 5.770 and 8.655 mg · L−1) and Zn (0.1, 0.2 and 0.3 mg · L−1).
Table 3.
Significance of the study factors and their interaction in the weights of fresh and dry biomasses, and their relationships, in lettuce (Lactuca sativa) cv. ‘Ruby Sky’ plants.
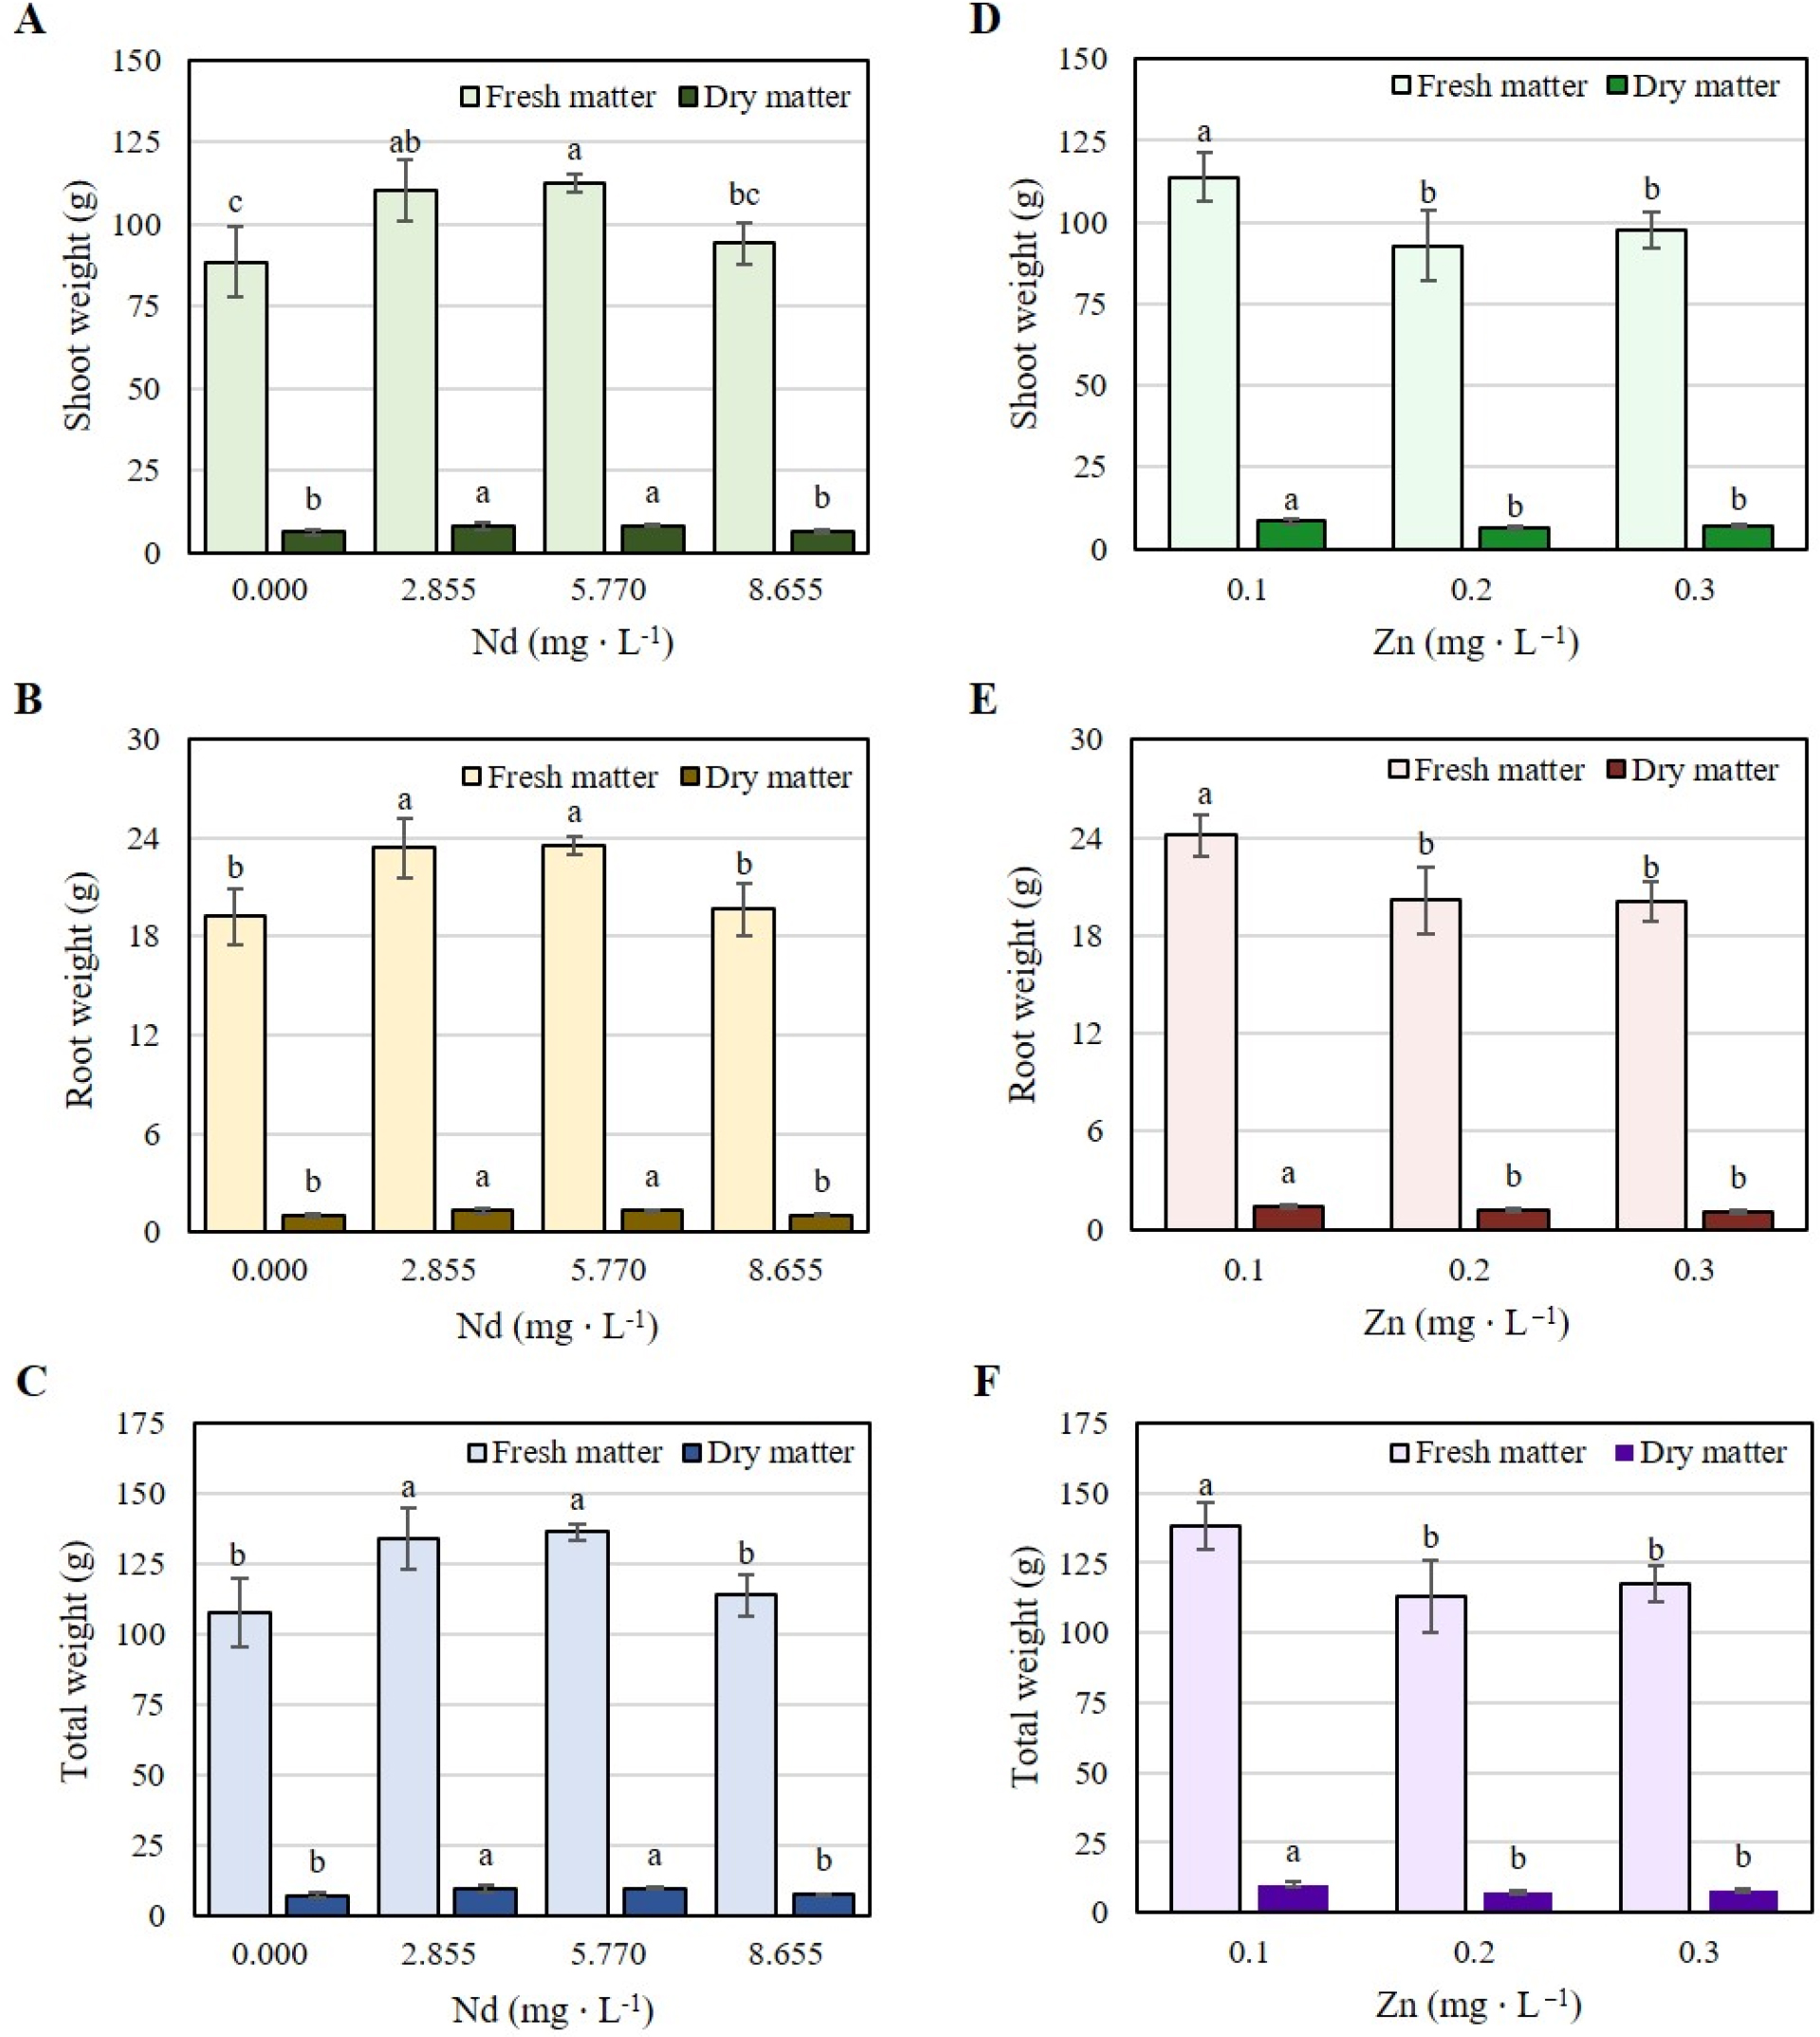
Figure 4.
Fresh and dry biomass of stem (A and D), root (B and E), and total (C and F) of lettuce (Lactuca sativa) cv. ‘Ruby Sky’ plants treated for 48 days with different concentrations of Nd (0.000, 2.885, 5.770 and 8.655 mg · L−1) and Zn (0.1, 0.2 and 0.3 mg · L−1). Bars ± SD (standard deviation) with different letters in each subfigure indicate significant statistical differences (Tukey, p ≤ 0.05).
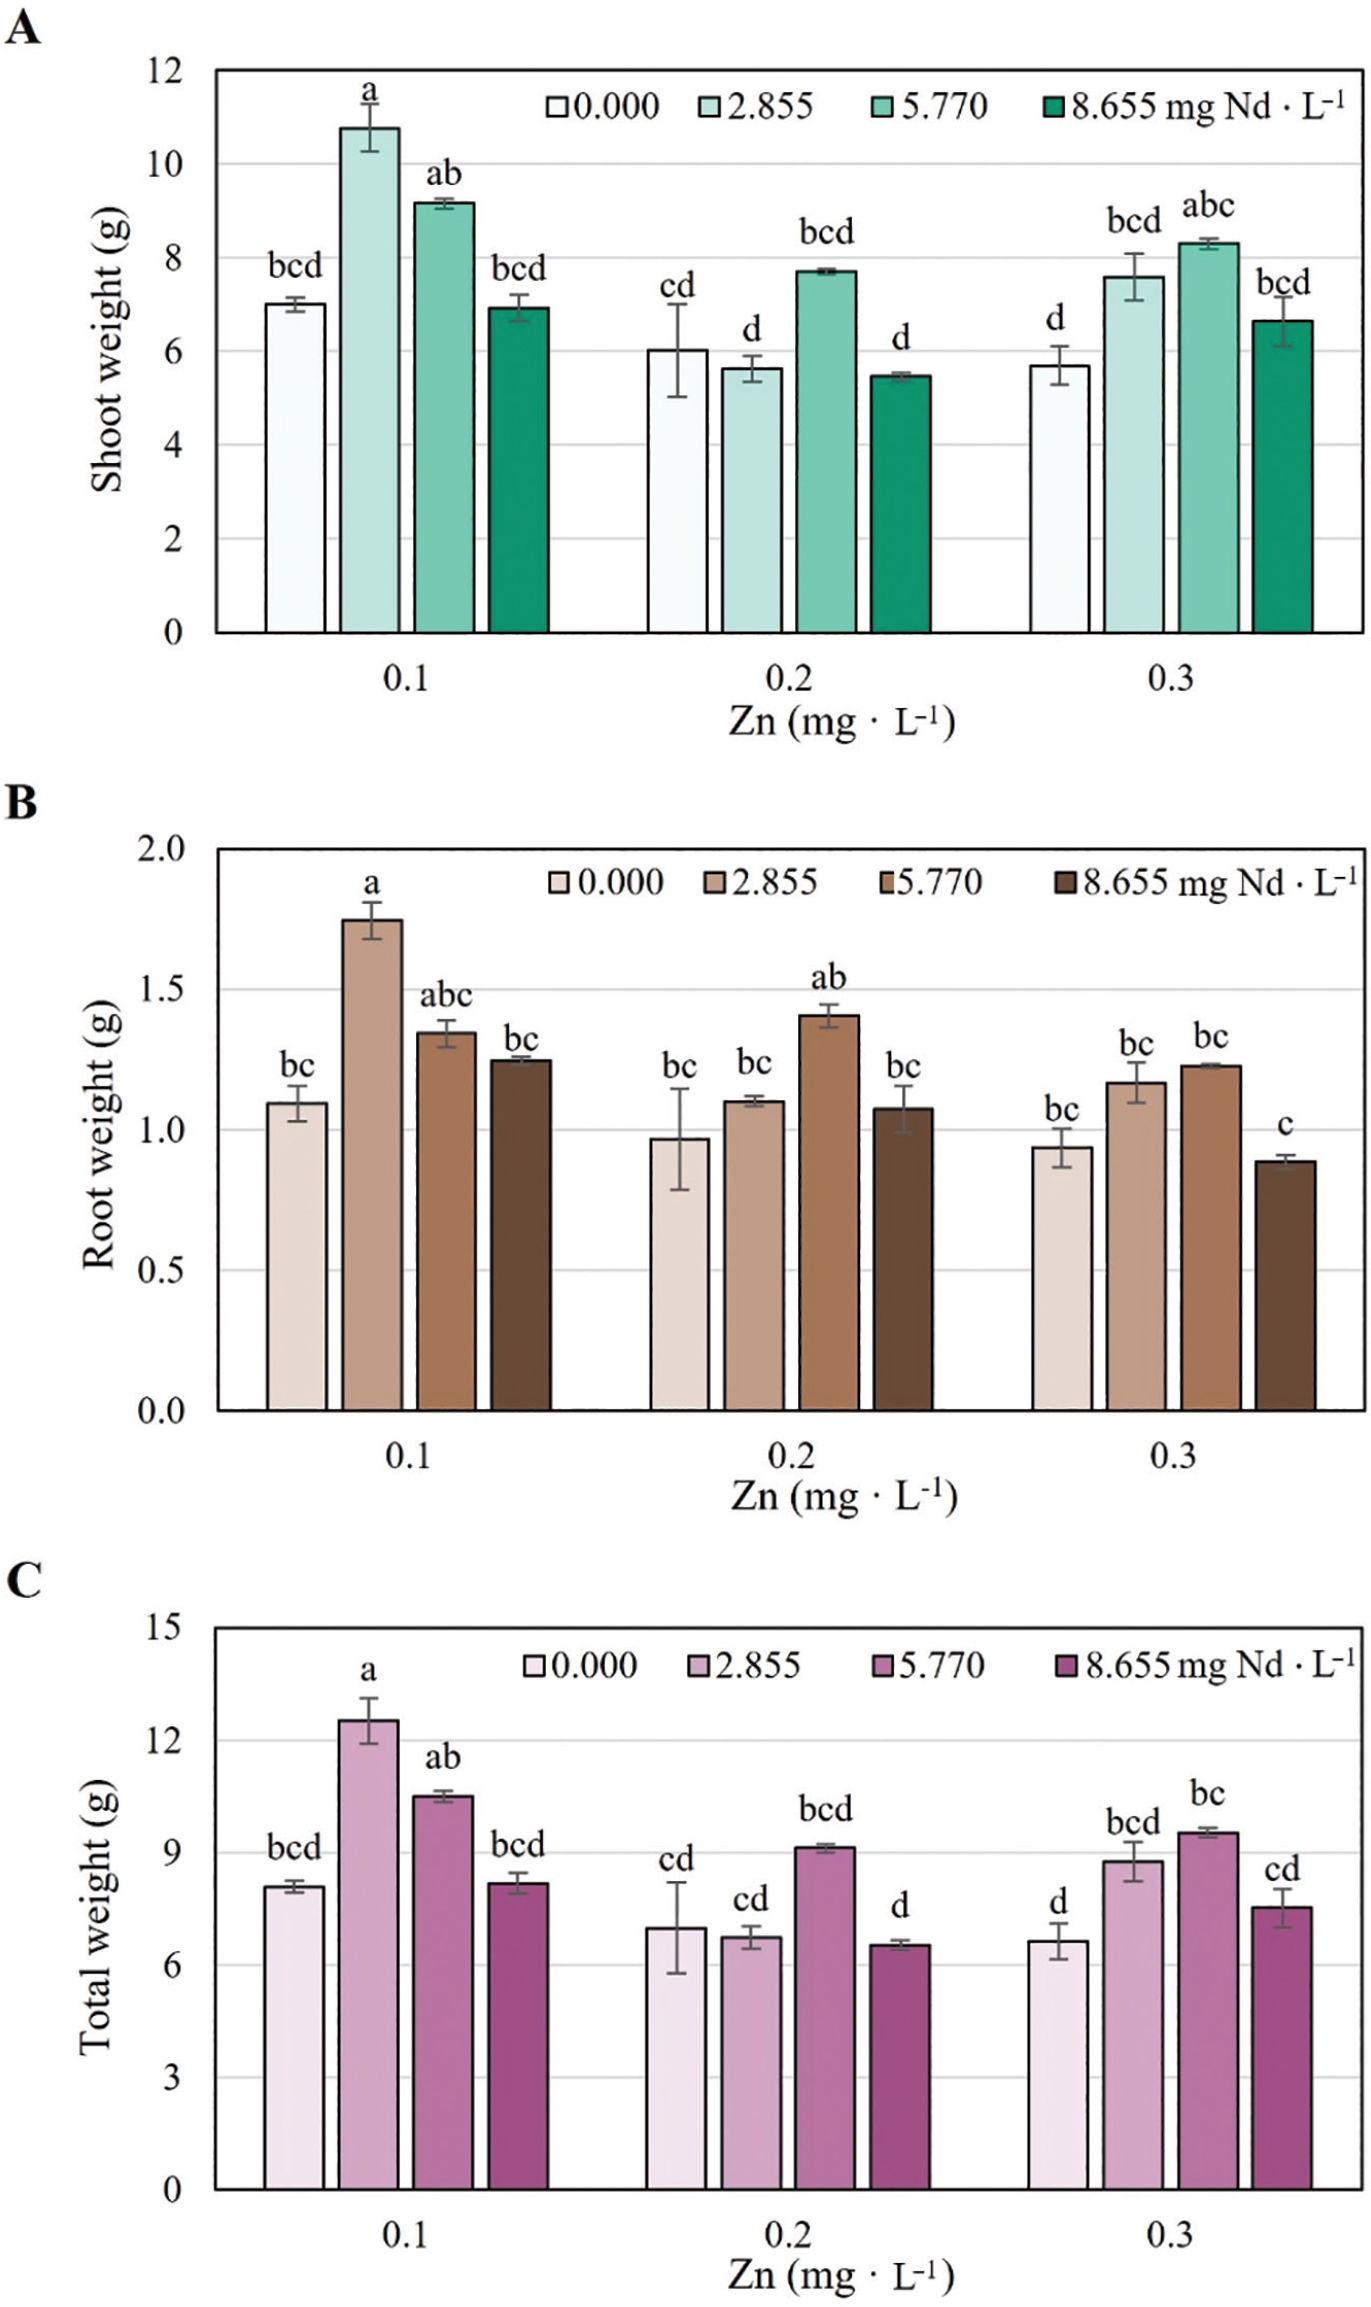
Figure 5.
Dry biomass of stem (A), root (B) and total (C) of lettuce (Lactuca sativa) cv. ‘Ruby Sky’ plants treated for 48 days with different concentrations of Nd (0.000, 2.885, 5.770 and 8.655 mg · L−1) and Zn (0.1, 0.2 and 0.3 mg · L−1). Bars ± SD (standard deviation) with different letters in each subfigure indicate significant statistical differences (Tukey, p ≤ 0.05).
Table 4.
Ratios of fresh and dry stem:root biomasses in lettuce (Lactuca sativa) cv. ‘Ruby Sky’ plants treated with Nd and Zn.
| Nd (mg · L−1) | Zn (mg · L−1) | Stem:root FM ratio | Stem:root DM ratio |
|---|---|---|---|
| 0.000 | 0.1 | 4.80 ± 0.21 ab | 6.47 ± 0.42 ab |
| 0.000 | 0.2 | 4.22 ± 0.19 b | 6.47 ± 0.41 ab |
| 0.000 | 0.3 | 4.49 ± 0.03 ab | 6.09 ± 0.09 ab |
| 2.885 | 0.1 | 4.65 ± 0.25 ab | 6.17 ± 0.24 ab |
| 2.885 | 0.2 | 4.82 ± 0.16 ab | 5.11 ± 0.19 b |
| 2.885 | 0.3 | 4.70 ± 0.06 ab | 6.54 ± 0.48 ab |
| 5.770 | 0.1 | 4.96 ± 0.09 ab | 6.84 ± 0.18 ab |
| 5.770 | 0.2 | 4.74 ± 0.09 ab | 5.50 ± 0.12 ab |
| 5.770 | 0.3 | 4.81 ± 0.11 ab | 6.77 ± 0.09 ab |
| 8.655 | 0.1 | 4.48 ± 0.13 b | 5.57 ± 0.29 ab |
| 8.655 | 0.2 | 4.53 ± 0.11 ab | 5.17 ± 0.38 b |
| 8.655 | 0.3 | 5.53 ± 0.35 a | 7.56 ± 0.71 a |
Table 5.
Significance of the study factors and their interaction in the foliar concentration of N, P and K, in lettuce (Lactuca sativa) cv. ‘Ruby Sky’ plants.
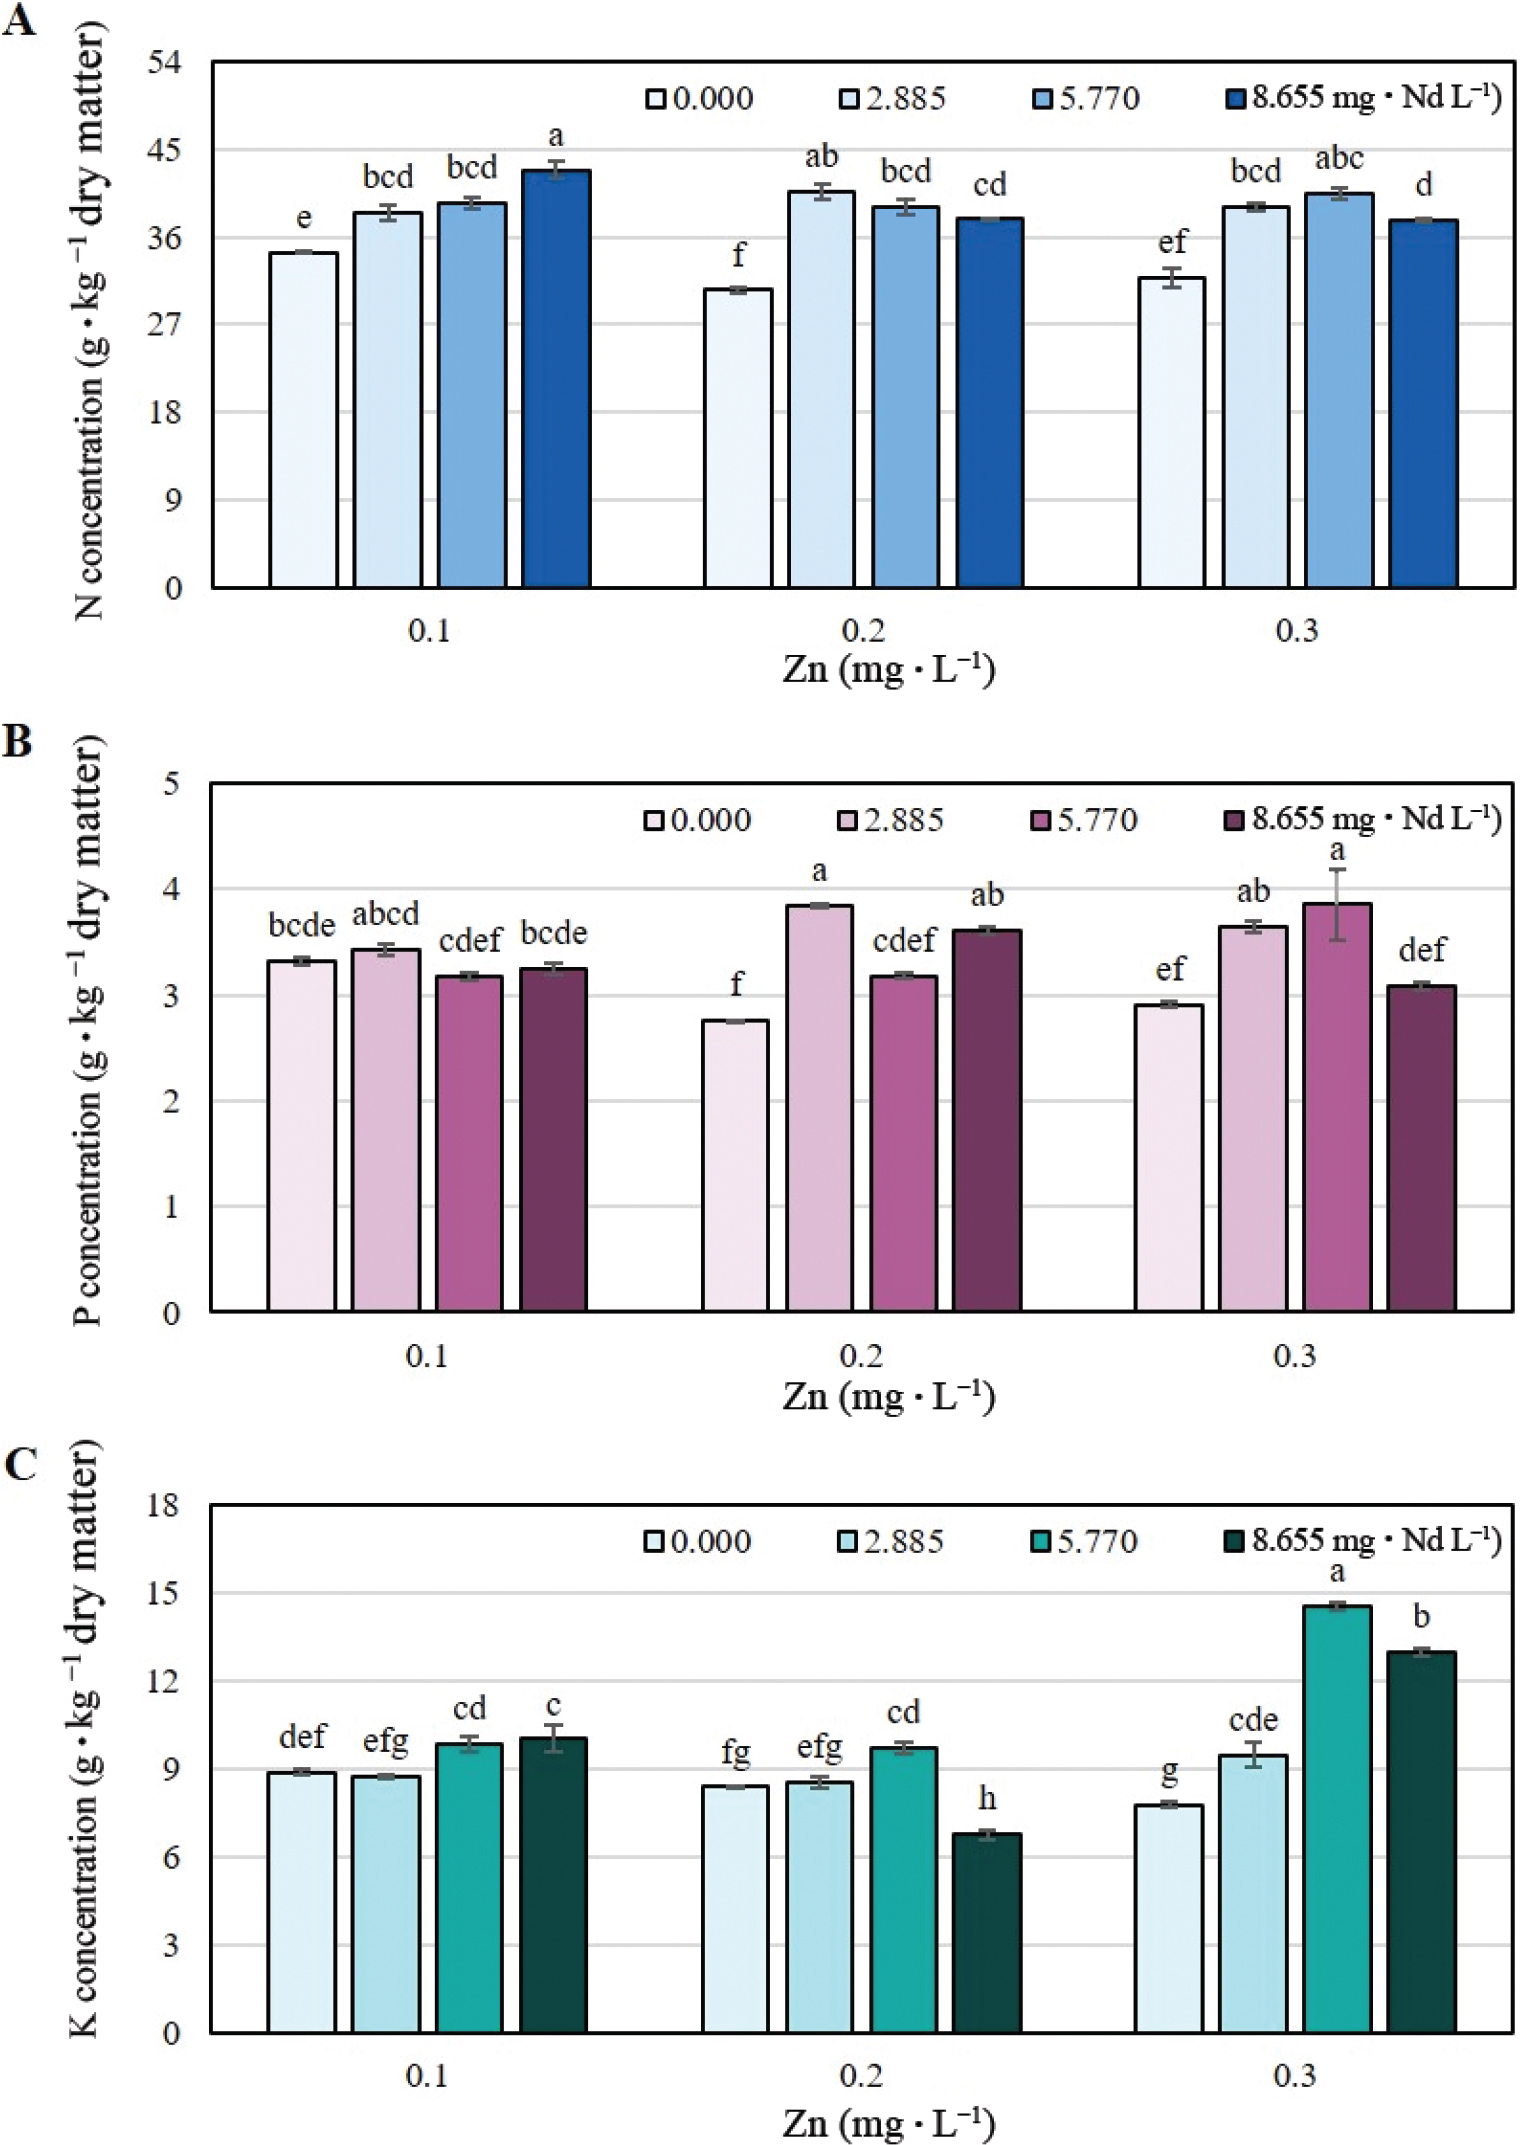
Figure 6.
Foliar concentration of nitrogen (A), phosphorus (B) and potassium (C) in lettuce (Lactuca sativa) cv. ‘Ruby Sky’ plants treated for 48 days with different concentrations of Nd (0.000, 2.885, 5.770 and 8.655 mg · L−1) and Zn (0.1, 0.2 and 0.3 mg · L−1). Bars ± SD (standard deviation) with different letters in each subfigure indicate significant statistical differences (Tukey, p ≤ 0.05).