
Table 1.
Breeding program phases, using the SSD method, for peppers with ornamental potential from the BAG of the State University of Montes Claros, Janauba, MG, Brazil, 2023.
| Phases | Activities | Periods |
|---|---|---|
| I | Crossing of parents and obtaining the F1 population | 2nd half of 2019 |
| II | Growth of the F1 population and obtaining the F2 population | 1st half of 2020 |
| III | Growth of the F2 population and obtaining the F3 population | 2nd half of 2020 |
| IV | Growth of the F3 population and obtaining the F4 population | 1st half of 2021 |
| V | Growth of the F4 population and obtaining the F5 population | 2nd half of 2021 |
| VI | Growth of the F5 pop. and selection of PIL for F5:6 generation | 1st half of 2022 |
Table 2.
Components of variance, genetic parameters, and ANADEV estimated in PIL for quantitative descriptors in an F5 population of pepper plants (Capsicum annuum L.) State University of Montes Claros, Janauba, MG, Brazil, 2023.
| Parameters | PIL (F5 population) | ||||
|---|---|---|---|---|---|
| PH | NFP | MFW | MFL | MFD | |
| σ2a | 8.43 | 5.45 | 0.17 | 17.32 | 1.36 |
| σ2e | 11.65 | 49.83 | 0.27 | 32.77 | 1.98 |
| σ2p | 20.08 | 55.29 | 0.44 | 50.09 | 3.34 |
| h2a | 0.41 | 0.09 | 0.38 | 0.34 | 0.40 |
| Acprog | 0.64 | 0.51 | 0.62 | 0.58 | 0.63 |
| CVgi% | 11.17 | 16.30 | 18.63 | 12.62 | 10.64 |
| CVe% | 13.14 | 49.28 | 23.48 | 17.36 | 12.83 |
| Overall mean | 25.97 | 14.32 | 2.22 | 32.97 | 10.97 |
| LRT | 68.7** | 13.14** | 57.26** | 42.44** | 64.6** |
1 Tabulated chi-square value = 6.63 for significance level of 1% (**). σ2a, genetic variance among progenies; σ2e, residual variance; σ2p, phenotypic variance; Acprog, accuracy of progeny selection, assuming complete survival; ANADEV, analysis of deviance; CVe, coefficient of residual variation; CVgi, coefficient of individual additive genetic variation; h2a, individual narrow-sense heritability; LRT, likelihood ratio test; MFD, mean fruit diameter (mm); MFL, mean fruit length (mm); MFW, mean fruit weight (g); NFP, number of fruits per plant (units); PH, plant height (cm); PIL, partially inbred lines.
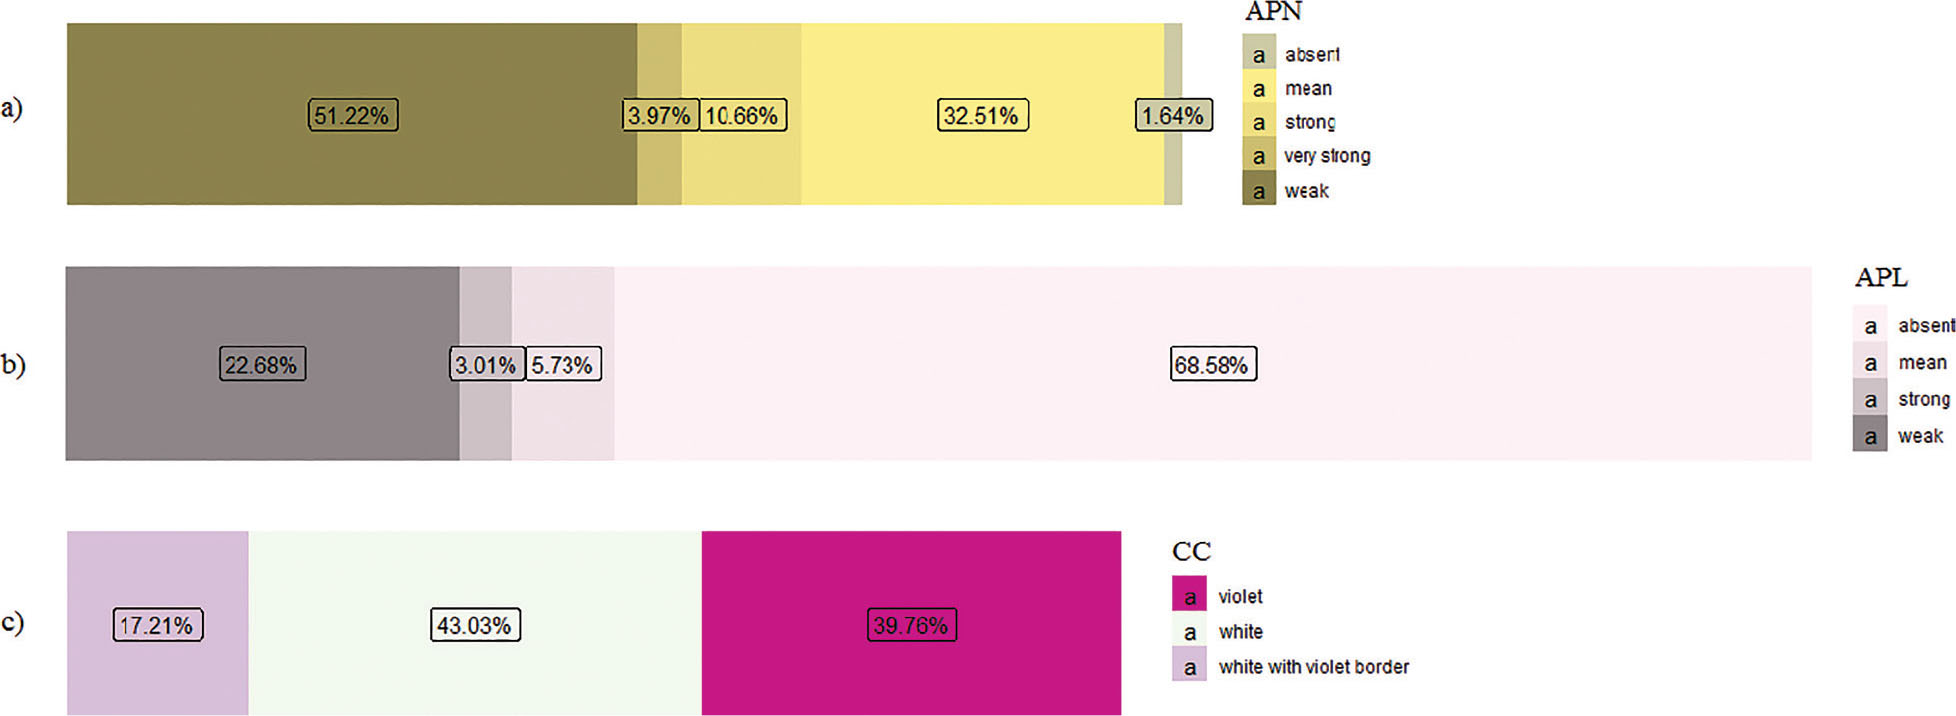
Figure 1.
Summary of percentages found for PIL of peppers (Capsicum annuum L.) considering the following qualitative descriptors: (A) APN; (B) APL; (C) CC. State University of Montes Claros, Janauba, MG, Brazil, 2023. APL, anthocyanin pigmentation in leaves; APN, Anthocyanin pigmentation at node height; CC, Corolla colour; PIL, Partially inbred lines.
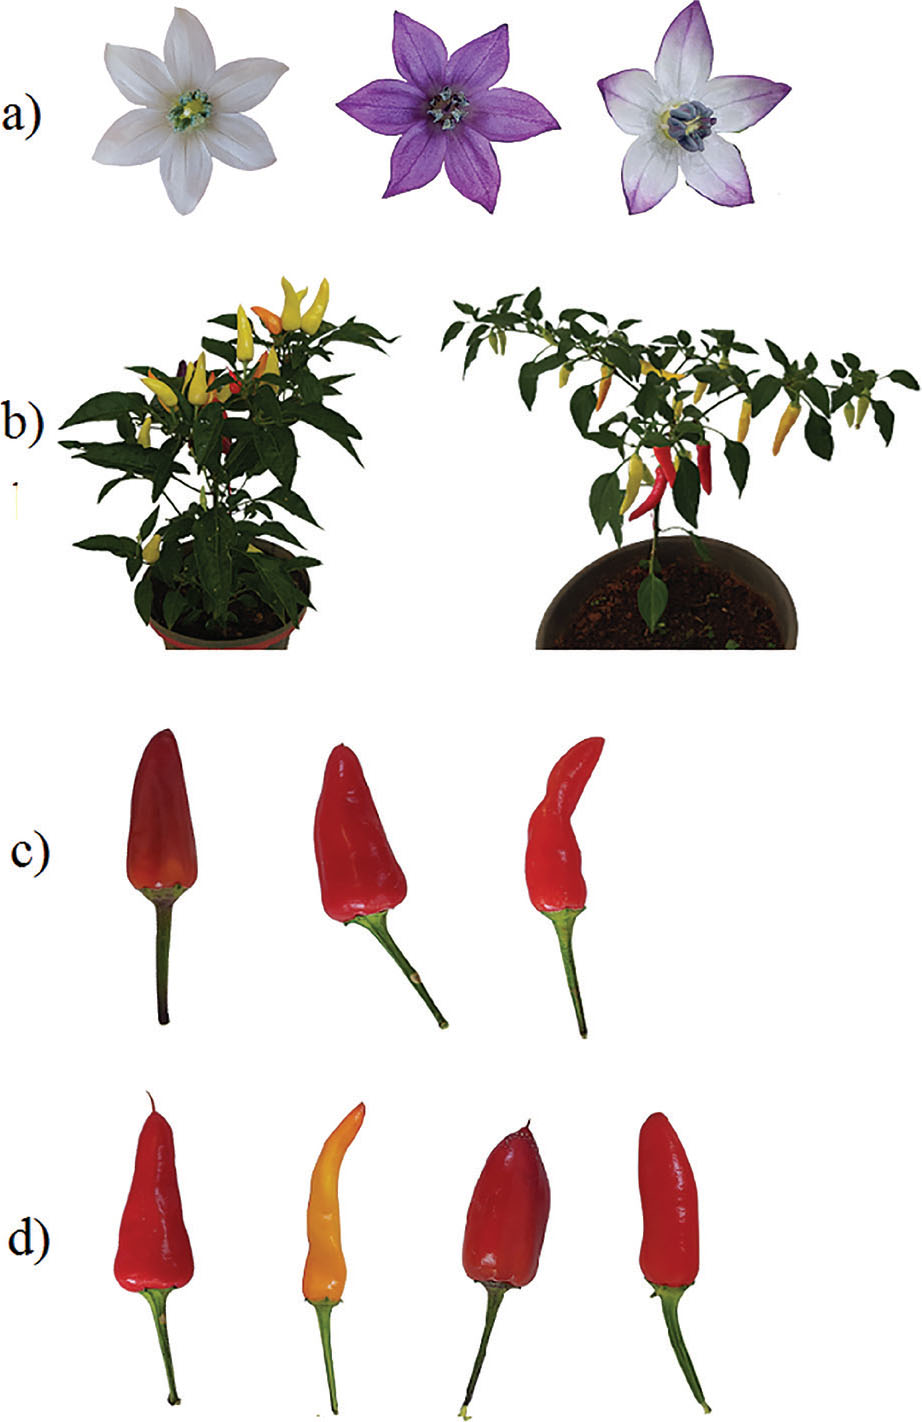
Figure 2.
(A) Flower CC: white, violet, and Wvb, respectively; (B) FP in the plant architecture: upright and pendant, respectively; (C) FT: smooth, slightly wrinkled, and strongly wrinkled, respectively; (D) PLS: triangular, narrow-triangular, oval, and elliptical, respectively. State University of Montes Claros, Janauba, MG, Brazil, 2023. CC, corolla colour; FP, fruit position; FT, fruit surface texture; PLS, predominant shape of the longitudinal fruit section; Wvb, white with violet borders.
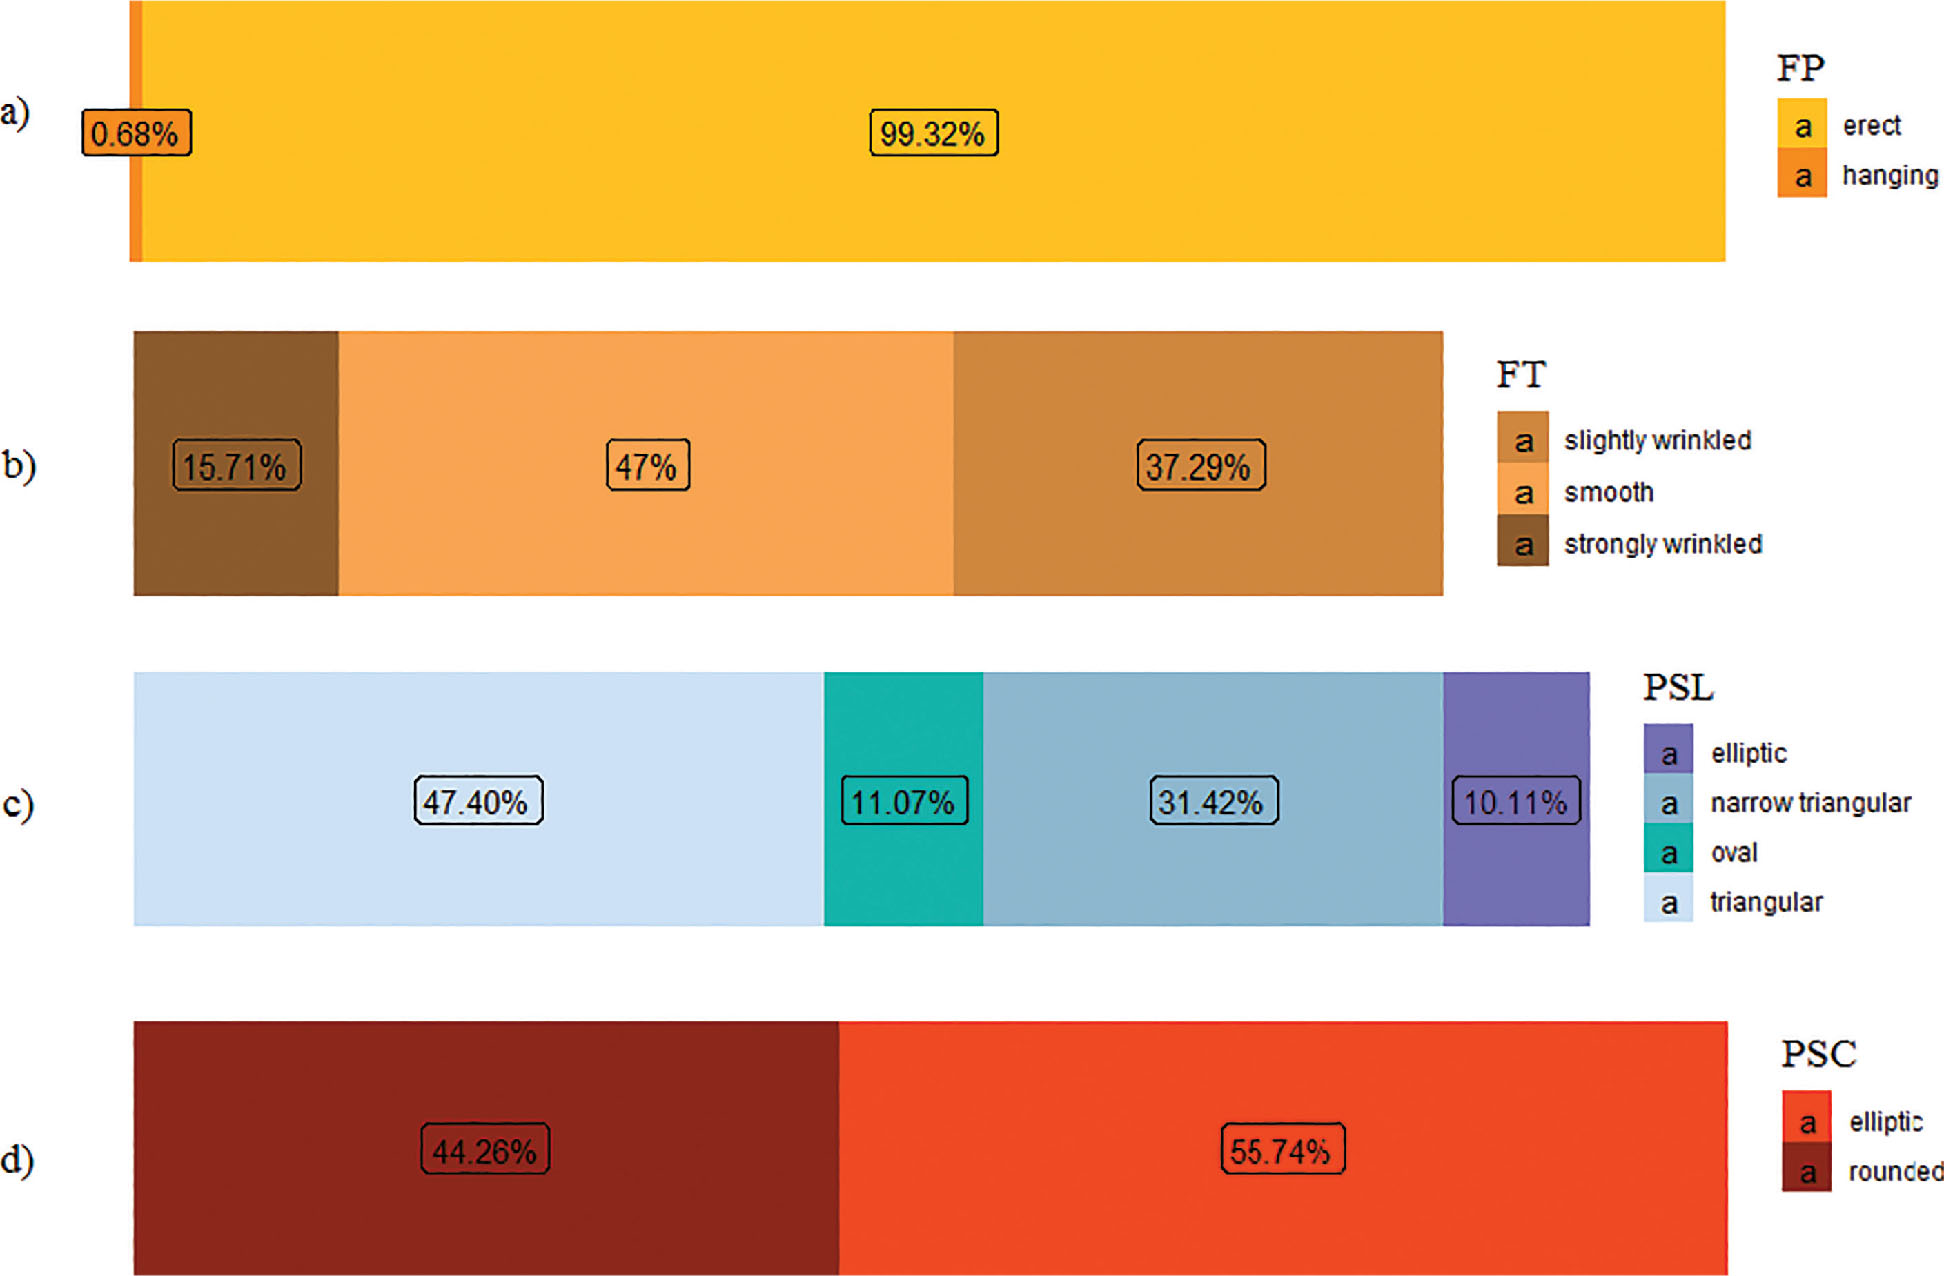
Figure 3.
Summary of percentages found for PIL of peppers (Capsicum annuum L.) considering the following qualitative descriptors: (A) FP in the plant architecture; (B) FT; (C) PLS; (D) PTS. State University of Montes Claros, Janauba, MG, Brazil, 2023. FP, fruit position; FT, fruit surface texture; PIL, partially inbred lines; PLS, predominant shape of the longitudinal fruit section; PTS, predominant shape of the transversal fruit section.
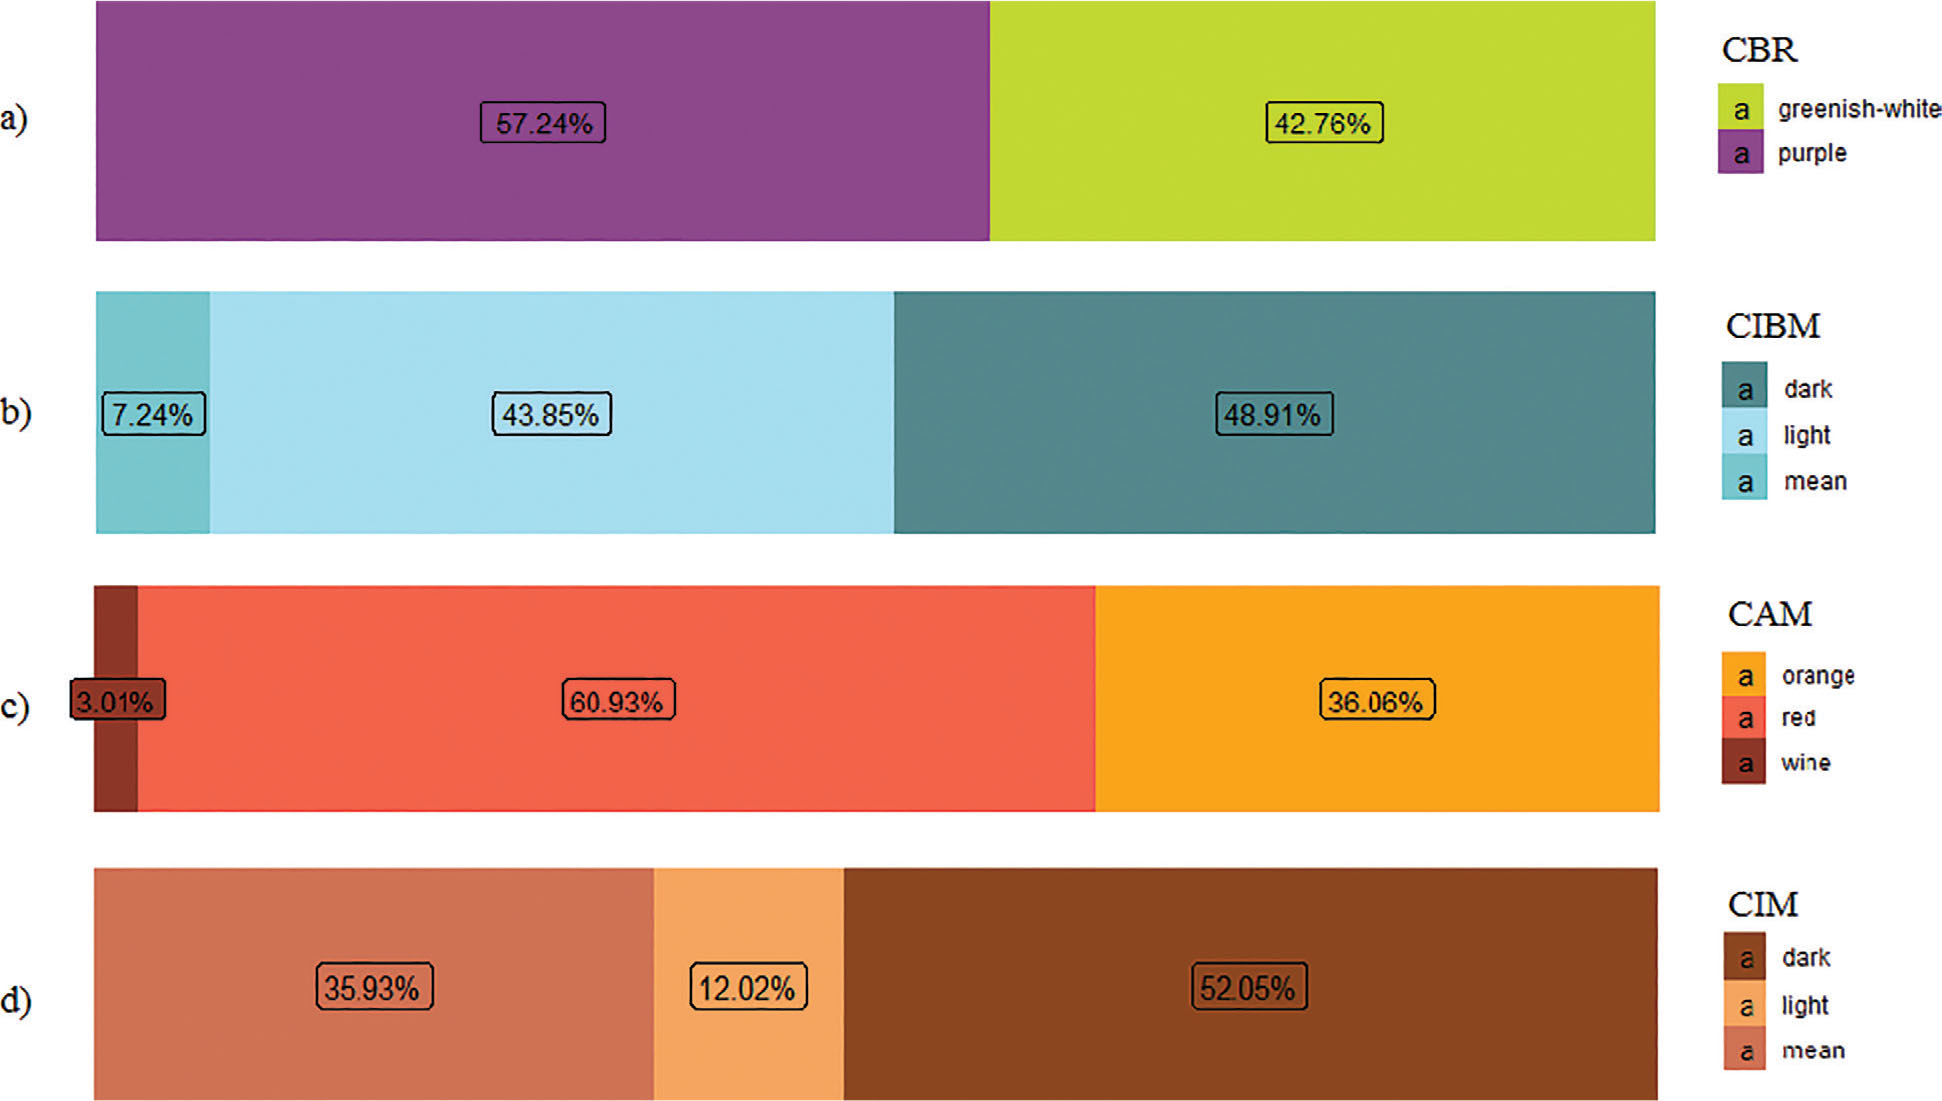
Figure 4.
Summary of percentages found for 732 PIL of peppers (Capsicum annuum L.) considering the following qualitative descriptors: (A) fruit CBM; (B) fruit CIBM; (C) FCM; (D) FCIM. State University of Montes Claros, Janauba, MG, Brazil, 2023. CBM, colour before maturation; CIBM, colour intensity before maturation; FCIM, fruit colour intensity at maturation; FCM, fruit colour at maturation; PIL, partially inbred lines.
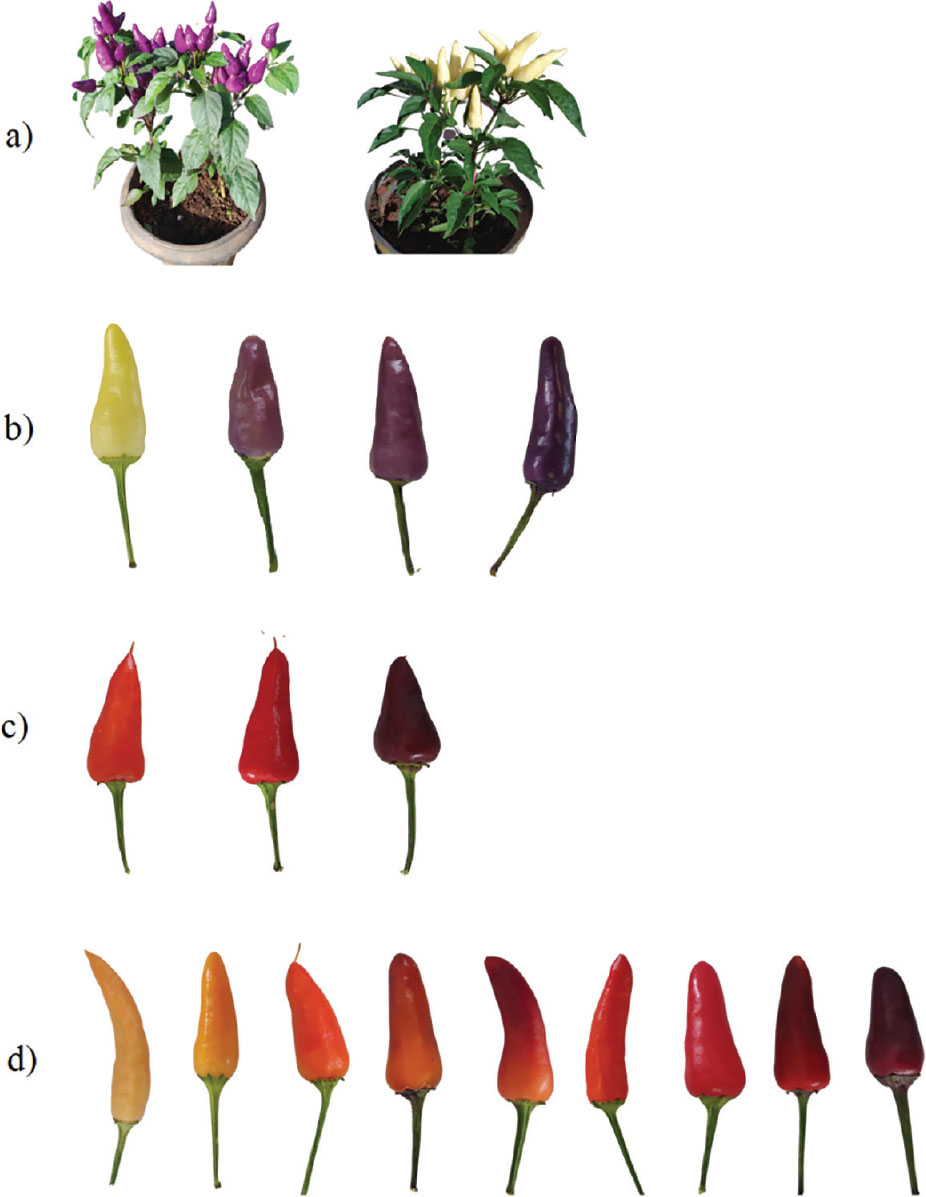
Figure 5.
(A) Fruit CBM: purple and white-greenish, respectively; (B) fruit CIBM; (C) FCM: orange, red, and wine, respectively; (D) FCIM. State University of Montes Claros, Janauba, MG, Brazil, 2023. CBM, colour before maturation; CIBM, colour intensity before maturation; FCM, fruit colour at maturation; FCIM, fruit colour intensity at maturation.
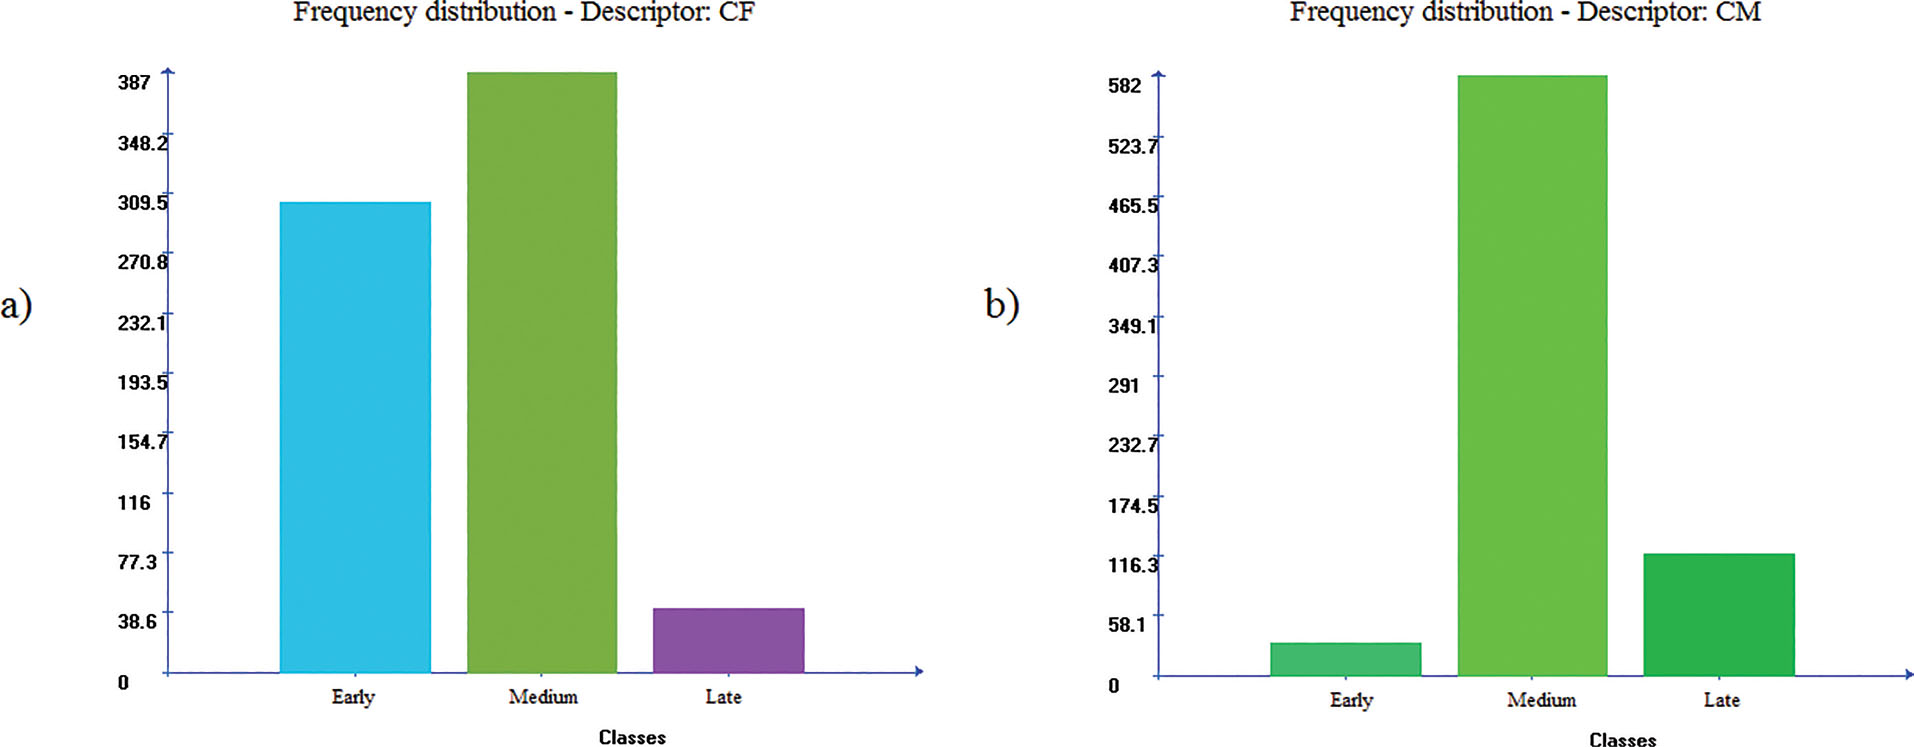
Figure 6.
Frequency distribution within class intervals (early, medium, and late cycles) for the following qualitative descriptors: (A) CF; (B) CM. State University of Montes Claros, Janauba, MG, Brazil, 2023. CF, cycle to flowering; CM, cycle to maturation.
Table 3.
Description of ideal genotype patterns for the F5 population of peppers with ornamental potential, considering qualitative descriptors. State University of Montes Claros, Janauba, MG, Brazil, 2023.
| Ideal genotype | APN | APL | CC | CBM | FP | PLS | FCM | FCIM |
|---|---|---|---|---|---|---|---|---|
| I | Present | Present | Violet or Wvb | Purple | Upright or pendant | Independent | Orange | Independent |
| II | Present | Present | Violet or Wvb | Purple | Upright or pendant | Narrow-triangular or triangular | Red | Dark |
| III | Independent | Independent | Violet or Wvb | Purple | Upright | Independent | Wine | Independent |
1 APL, anthocyanin pigmentation in leaves; APN, anthocyanin pigmentation at node height; CBM, fruit colour before maturation; CC, flower corolla colour; FCIM, fruit colour intensity at maturation; FCM, fruit colour at maturation; FP, fruit position in the plant architecture; PLS, predominant shape of the longitudinal fruit section; Wvb, white with violet borders.
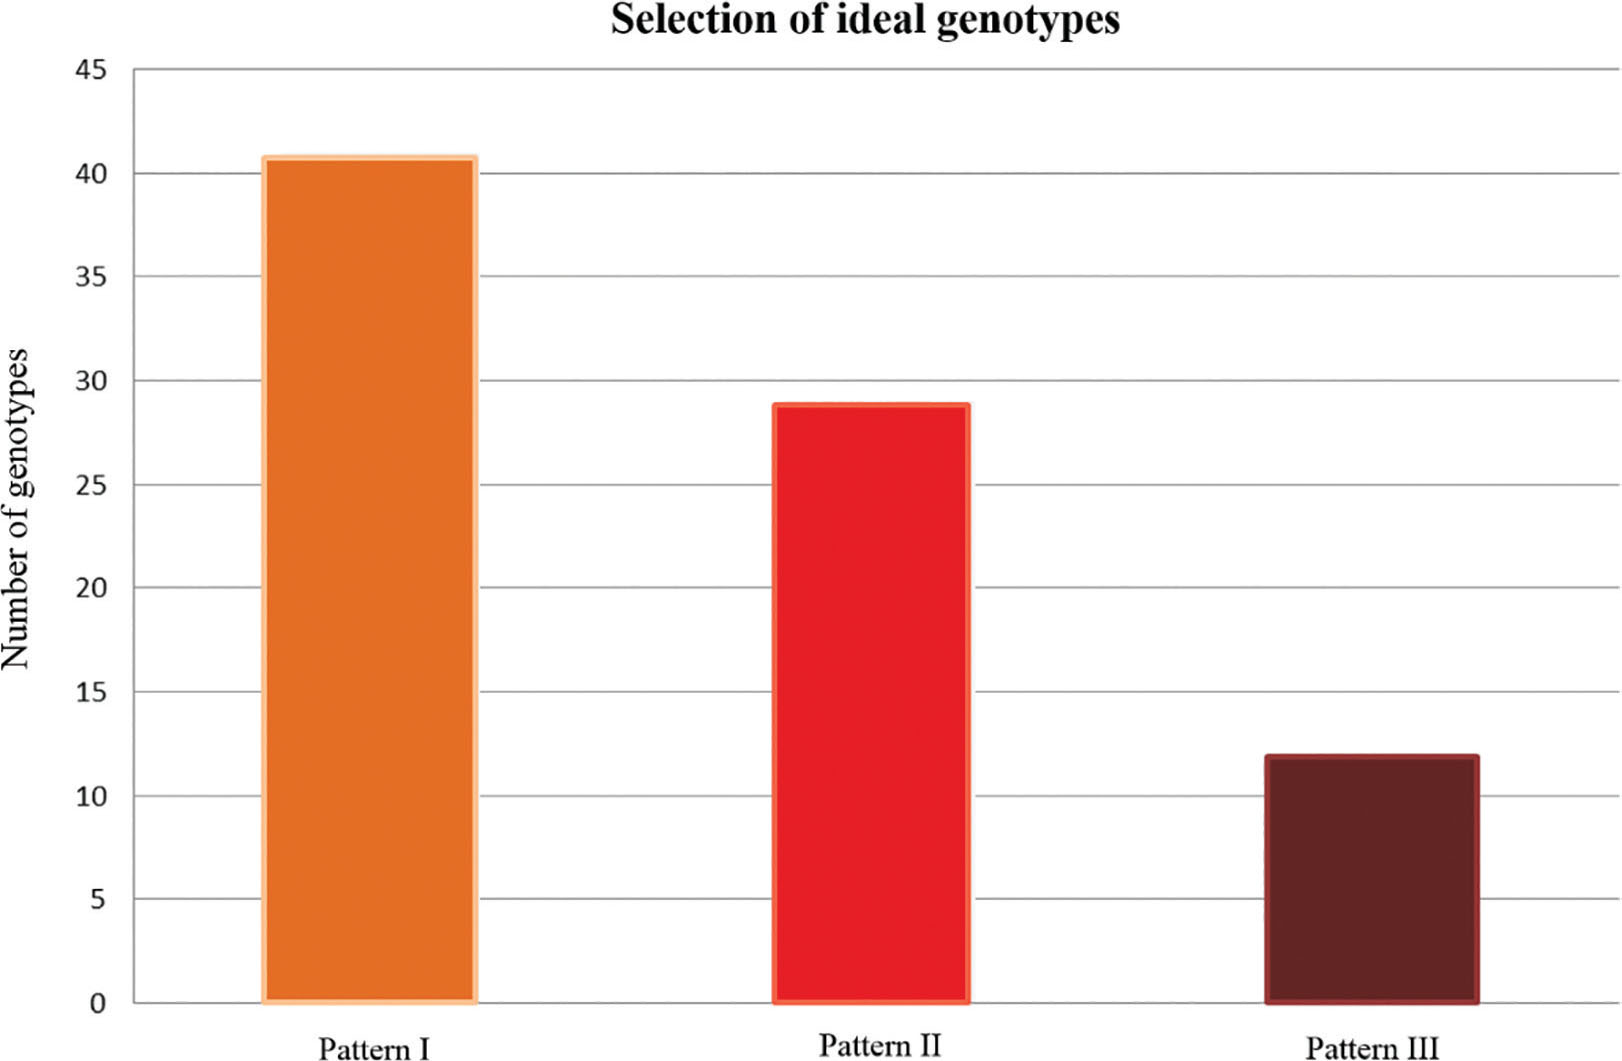
Figure 7.
Graph distribution of ideal genotypes selected according to the following patterns: ideal genotype I, ideal genotype II, and ideal genotype III. State University of Montes Claros, Janauba, MG, Brazil, 2023.