
Table 1.
Weather data of Al-Baramon, Mansoura, Dakahlia, Egypt from November 2019 to October 2021.
| Season | Temperature (°C) | Humidity (%) | Rainfall (mm · month–1) | Wind speed (km · h–1) | Cloud (%) | Sun (h · month–1) | UV index | |
|---|---|---|---|---|---|---|---|---|
| November | 2019 | 24 | 57 | 0.0 | 11.2 | 9 | 358 | 6 |
| 2020 | 22 | 63 | 9.7 | 10.4 | 28 | 339 | 6 | |
| December | 2019 | 18 | 62 | 12.2 | 13.2 | 23 | 360 | 5 |
| 2020 | 19 | 62 | 4.7 | 10.3 | 20 | 350 | 4 | |
| January | 2020 | 14 | 70 | 9.6 | 14.0 | 32 | 349 | 4 |
| 2021 | 17 | 64 | 3.7 | 13.1 | 20 | 365 | 5 | |
| February | 2020 | 16 | 69 | 9.6 | 12.3 | 32 | 308 | 4 |
| 2021 | 18 | 66 | 8.9 | 12.6 | 28 | 298 | 4 | |
| March | 2020 | 19 | 63 | 20.6 | 14.7 | 24 | 345 | 7 |
| 2021 | 20 | 60 | 0.6 | 14.3 | 15 | 368 | 5 | |
| April | 2020 | 23 | 60 | 0.9 | 13.4 | 16 | 356 | 7 |
| 2021 | 24 | 52 | 0.0 | 15.4 | 10 | 360 | 8 | |
| May | 2020 | 28 | 51 | 0.6 | 14.3 | 11 | 367 | 7 |
| 2021 | 30 | 46 | 0.0 | 13.4 | 4 | 372 | 8 | |
| June | 2020 | 30 | 56 | 0.1 | 13.6 | 8 | 360 | 8 |
| 2021 | 31 | 52 | 0.0 | 13.0 | 2 | 360 | 9 | |
| July | 2020 | 33 | 63 | 0.0 | 12.6 | 9 | 372 | 8 |
| 2021 | 34 | 54 | 0.0 | 13.3 | 3 | 372 | 9 | |
| August | 2020 | 33 | 64 | 0.0 | 12.9 | 5 | 372 | 8 |
| 2021 | 35 | 55 | 0.0 | 11.9 | 2 | 372 | 8 | |
| September | 2020 | 32 | 65 | 0.0 | 12.2 | 6 | 359 | 7 |
| 2021 | 30 | 60 | 0.0 | 13.3 | 6 | 358 | 7 | |
| October | 2020 | 28 | 61 | 14.1 | 11.1 | 11 | 369 | 6 |
| 2021 | 26 | 61 | 1.3 | 11.9 | 12 | 369 | 5 | |
Table 2.
Soil and water analysis of the experimental site at Al-Baramon, Mansoura, Dakahlia, Egypt.
| Soil depth (cm) | 0–30 | 30–60 | 60–90 | Water | |
|---|---|---|---|---|---|
| Clay (%) | 49.25 | 50.55 | 51.15 | Transparency (cm) | 132.5 |
| Silt (%) | 27.69 | 26.72 | 26.11 | Permeability index (%) | 55.64 |
| Sand (%) | 23.06 | 22.66 | 21.55 | Water quality index | 21.54 |
| Texture | Clay | Clay | Clay | pH | 8.27 |
| Field capacity (%) | 15.3 | 15.7 | 15.8 | Total dissolved salts (mg · L–1) | 204.9 |
| Permanent wilting point (%) | 7.4 | 7.6 | 7.7 | EC (μmhos · cm–1) | 558.8 |
| pH (1:2.5 extract) | 7.7 | 7.11 | 7.11 | O2 (%) | 95.8 |
| Organic material (%) | 2.3 | 0.55 | 0.35 | CaCO3 (mg · L–1) | 100.6 |
| EC (dS · m–1) [1:5 extract] | 0.61 | 0.61 | 0.61 | HCO3– (mg · L–1) | 159.5 |
| CaCO3 (%) | 1.83 | 1.41 | 1.88 | CO32– (mg · L–1) | 7.0 |
| HCO3– (meq · 100 g–1) | 0.30 | 0.37 | 0.40 | SO42- (mg · L–1) | 15.13 |
| CO32– (meq · 100 g–1) | 0.0 | 0.0 | 0.0 | SiO2 (mg · L–1) | 1.21 |
| SO42– (meq · 100 g–1) | 3.17 | 4.04 | 4.13 | Cl– (mg · L–1) | 32.4 |
| Cl- (meq · 100 g–1) | 0.96 | 0.98 | 1.08 | Na+ (mg · L–1) | 29.2 |
| Na+ (meq · 100 g–1) | 0.48 | 0.66 | 1.42 | Ca2+ (mg · L–1) | 27.8 |
| Ca2+ (meq · 100 g–1) | 0.80 | 0.20 | 1.25 | Mg2+ (mg · L–1) | 14.7 |
| Mg2+ (meq · 100 g–1) | 0.33 | 0.97 | 1.16 | N (mg · L–1) | 1.56 |
| N (mg · kg–1) | 32 | 24 | 18 | P (mg · L–1) | 0.094 |
| P (mg · kg–1) | 13 | 22 | 13 | K (mg · L–1) | 8.81 |
| K (mg · kg–1) | 271 | 240 | 230 | Fe (mg · L–1) | 0.23 |
| Fe (mg · kg–1) | 2.48 | 2.21 | 2.11 | Mn (mg · L–1) | 0.005 |
| Mn (mg · kg–1) | 4.10 | 3.50 | 3.21 | Zn (mg · L–1) | 0.60 |
| Zn (mg · kg–1) | 1.18 | 0.61 | 0.51 | Cu (mg · L–1) | 0.018 |
| Cu (mg · kg–1) | 4.24 | 2.10 | 0.75 | Co (mg · L–1) | 1.56 |
| Pb (mg · L–1) | 0.77 | ||||
| B (mg · L–1) | 0.03 | ||||
| Mo (mg · L–1) | 0.009 | ||||
| Al (mg · L–1) | 0.03 | ||||
| Ni (mg · L–1) | 0.014 | ||||
| Se (mg · L–1) | 0.021 | ||||
| As (mg · L–1) | 0.044 | ||||
| V (mg · L–1) | 0.014 |
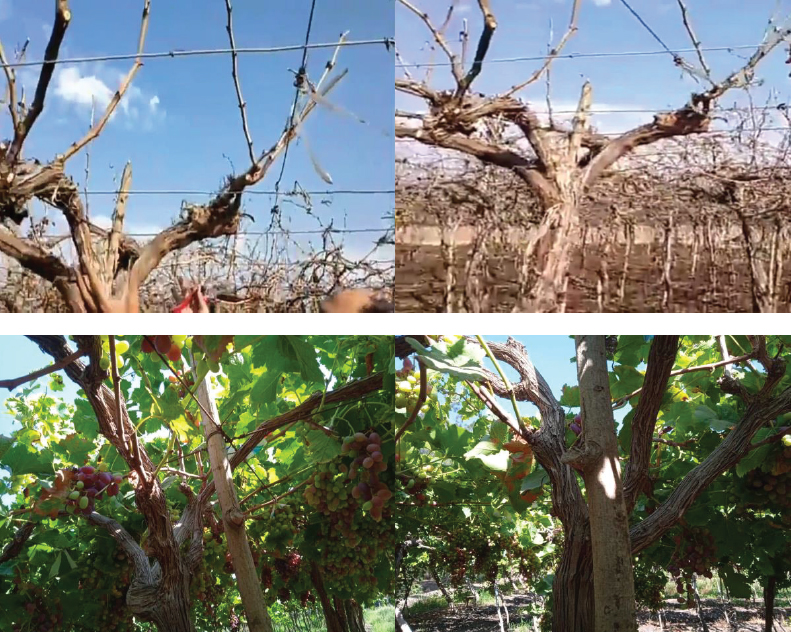
Figure 1.
The quadrilateral cordon training system of ‘Crimson Seedless’ grapevines.
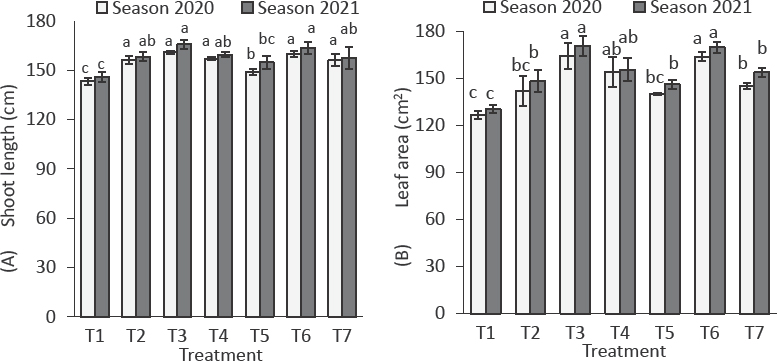
Figure 2.
Effect of BD alone or combined with FS of either SA or CCA on shoot length (A) and leaf area (B) of ‘Crimson Seedless’ grapevines. T1 = distilled water (control), T2 = BDPB, T3 = BDPB + 200 mg · L–1 SA, T4 = BDPB + 20 mg · L–1 CCA, T5 = BDFB, T6 = BDFB + 200 mg · L–1 SA and T7 = BDFB + 20 mg · L–1 CCA. Values are the means of three replicates (n = 9) ± SD. Means with the same letters in each season are insignificantly different at probability (p) ≤ 0.05 using Tukey’s HSD test. BD, basal defoliation; BDFB, basal defoliation at full bloom; BDPB, basal defoliation at pre-bloom; CCA, cyanocobalamin; FS, foliar spray; HSD, honestly significant difference; SA, salicylic acid; SD, standard deviation.
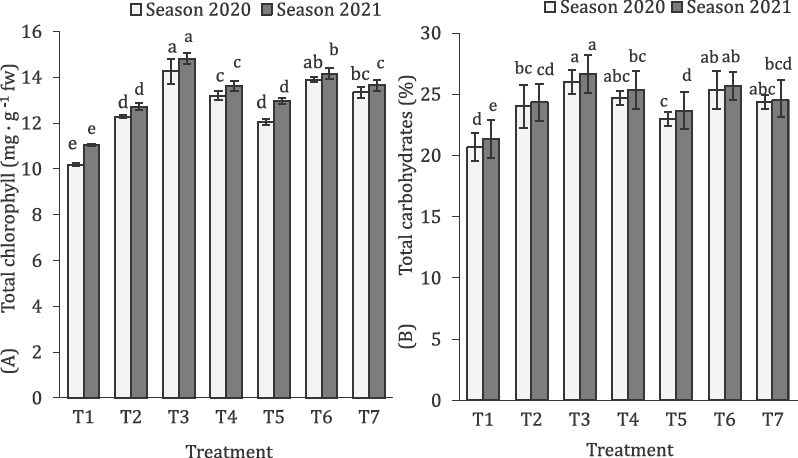
Figure 3.
Effect of BD alone or combined with FS of either SA or CCA on total chlorophyll (A) and carbohydrate (B) contents of ‘Crimson Seedless’ grapevines. T1 = control, T2 = BDPB, T3 = BDPB + 200 mg · L–1 SA, T4 = BDPB + 20 mg · L–1 CCA, T5 = BDFB, T6 = BDFB + 200 mg · L–1 SA and T7 = BDFB + 20 mg · L–1 CCA. Values are the means of three replicates (n = 9) ± SD. Means with the same letters in each season are insignificantly different at p ≤ 0.05 using Tukey’s HSD test. BD, basal defoliation; BDFB, basal defoliation at full bloom; BDPB, basal defoliation at pre-bloom; CCA, cyanocobalamin; FS, foliar spray; HSD, honestly significant difference; SA, salicylic acid; SD, standard deviation.
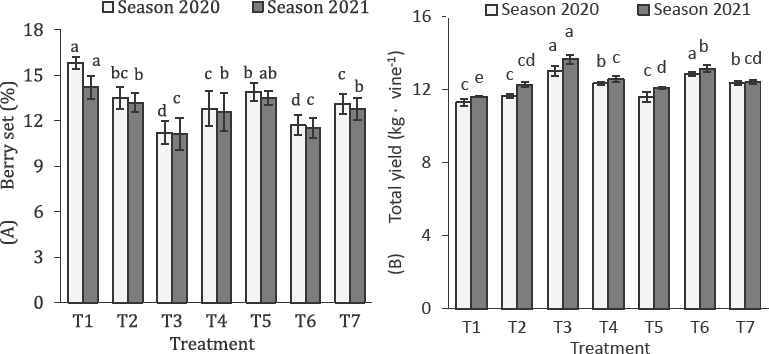
Figure 4.
Effect of BD alone or combined with FS of either SA or CCA on berry set (A) and total yield (B) of ‘Crimson Seedless’ grapevines. T1 = control, T2 = BDPB, T3 = BDPB + 200 mg · L–1 SA, T4 = BDPB + 20 mg · L–1 CCA, T5 = BDFB, T6 = BDFB + 200 mg · L–1 SA and T7 = BDFB + 20 mg · L–1 CCA. Values are the means of three replicates (n = 9) ± SD. Means with the same letters in each season are insignificantly different at p ≤ 0.05 using Tukey’s HSD test. BD, basal defoliation; BDFB, basal defoliation at full bloom; BDPB, basal defoliation at pre-bloom; CCA, cyanocobalamin; FS, foliar spray; HSD, honestly significant difference; SA, salicylic acid; SD, standard deviation.
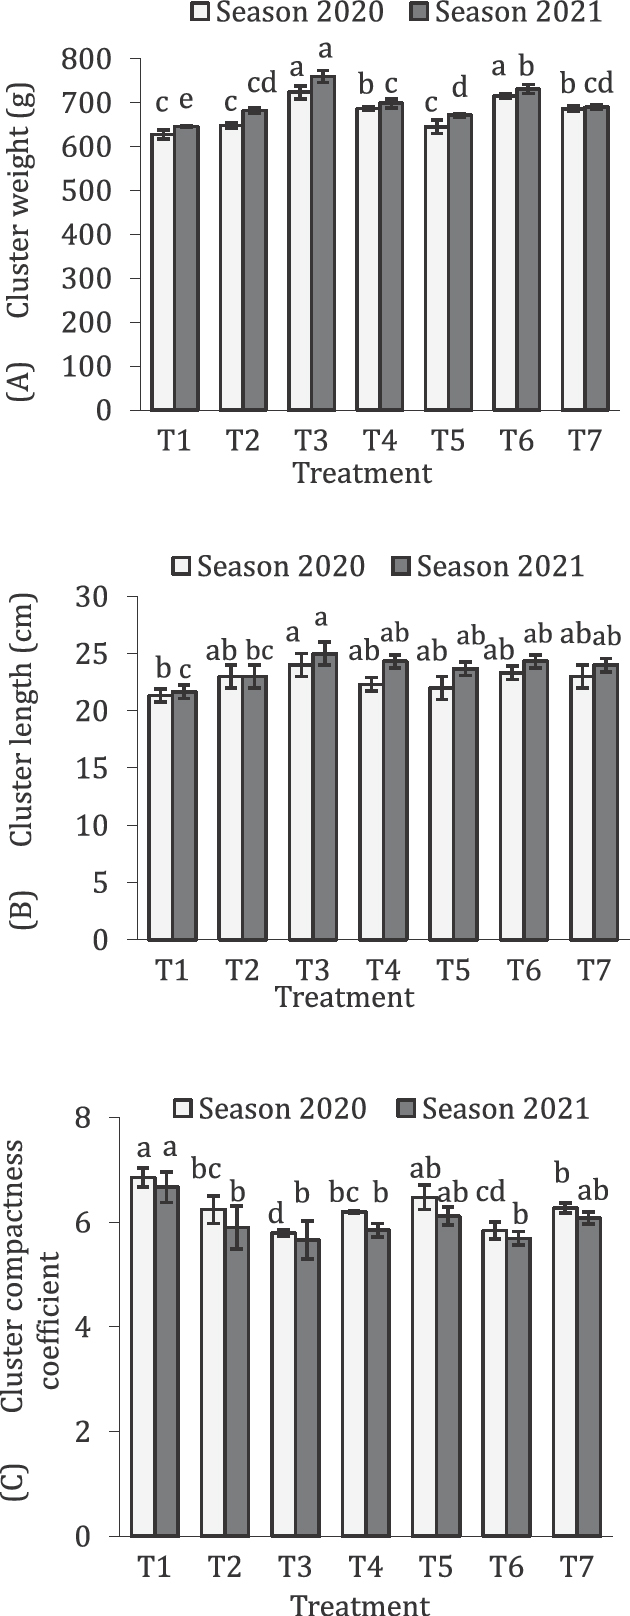
Figure 5.
Effect of BD alone or combined with FS of either SA or CCA on cluster weight (A), length (B) and compactness (C) of ‘Crimson Seedless’ grapes. T1 = control, T2 = BDPB, T3 = BDPB + 200 mg · L–1 SA, T4 = BDPB + 20 mg · L–1 CCA, T5 = BDFB, T6 = BDFB + 200 mg · L–1 SA and T7 = BDFB + 20 mg · L–1 CCA. Values are the means of three replicates (n = 9) ± SD. Means with the same letters in each season are insignificantly different at p ≤ 0.05 using Tukey’s HSD test. BD, basal defoliation; BDFB, basal defoliation at full bloom; BDPB, basal defoliation at pre-bloom; CCA, cyanocobalamin; FS, foliar spray; HSD, honestly significant difference; SA, salicylic acid; SD, standard deviation.
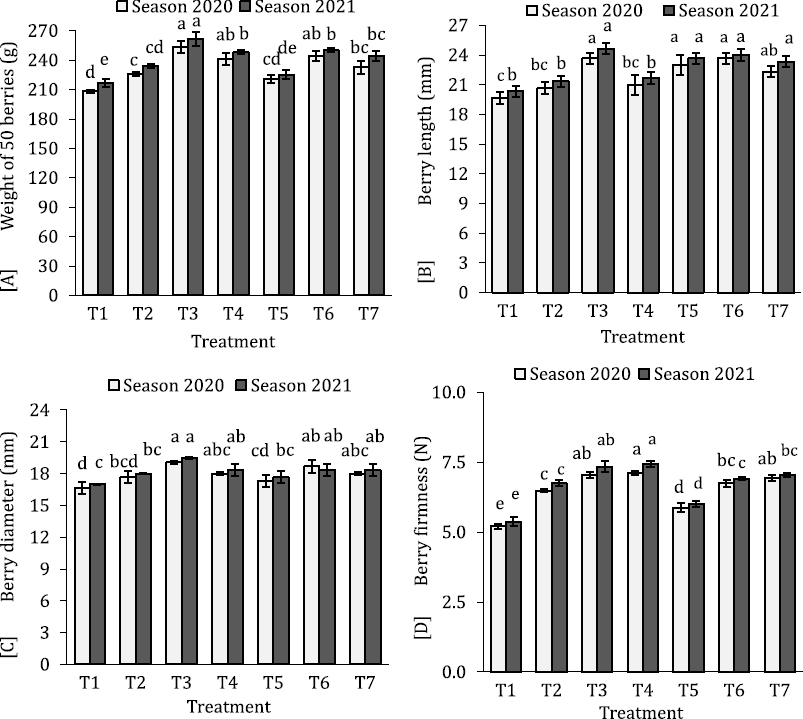
Figure 6.
Effect of BD alone or combined with FS of either SA or CCA on berry weight (A), length (B), diameter (C) and firmness (D) of ‘Crimson Seedless’ grapes. T1 = control, T2 = BDPB, T3 = BDPB + 200 mg · L–1 SA, T4 = BDPB + 20 mg · L–1 CCA, T5 = BDFB, T6 = BDFB + 200 mg · L–1 SA and T7 = BDFB + 20 mg · L–1 CCA. Values are the means of three replicates (n = 9) ± SD. Means with the same letters in each season are insignificantly different at p ≤ 0.05 using Tukey’s HSD test. BD, basal defoliation; BDFB, basal defoliation at full bloom; BDPB, basal defoliation at pre-bloom; CCA, cyanocobalamin; FS, foliar spray; HSD, honestly significant difference; SA, salicylic acid; SD, standard deviation.
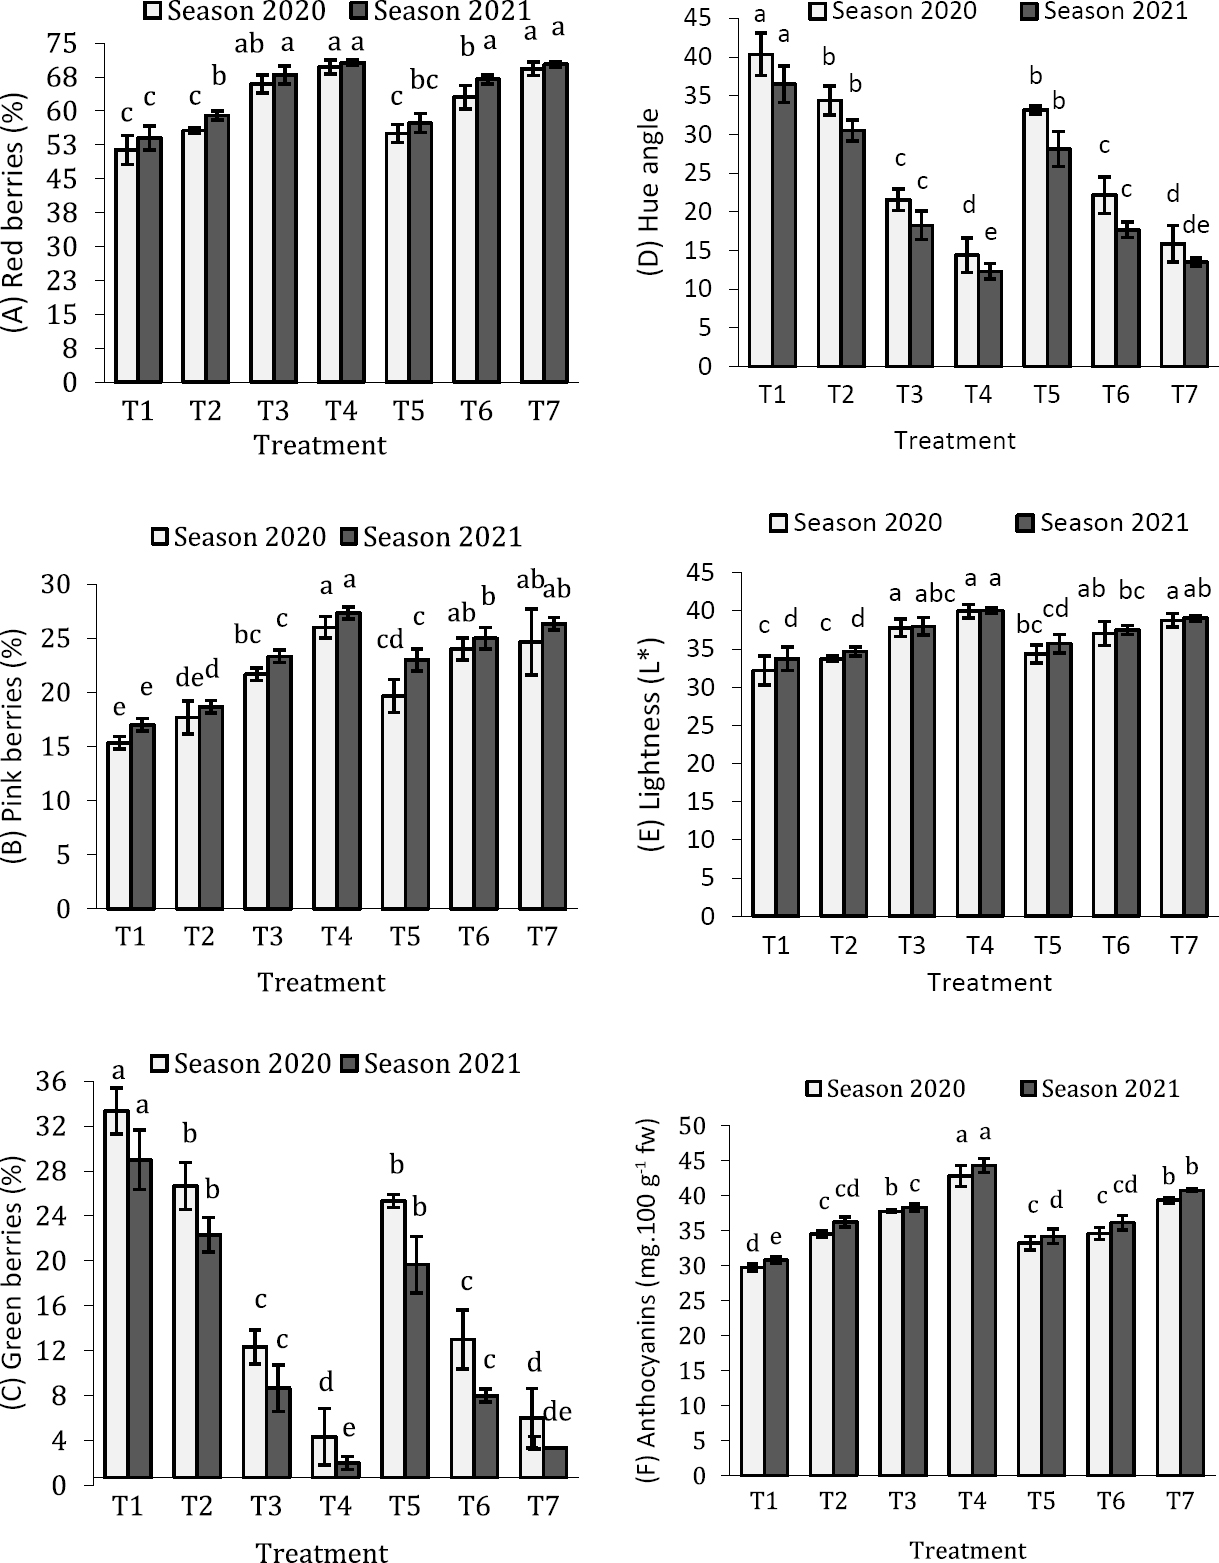
Figure 7.
Effect of BD alone or combined with FS of either SA or CCA on berry colour (red [A], pink [B], green [C]), hue angle (D), lightness (E), and anthocyanin contents (F) of ‘Crimson Seedless’ grapes. T1 = control, T2 = BDPB, T3 = BDPB + 200 mg · L–1 SA, T4 = BDPB + 20 mg · L–1 CCA, T5 = BDFB, T6 = BDFB + 200 mg · L–1 SA and T7 = BDFB + 20 mg · L–1 CCA. Values are the means of three replicates (n = 9) ± SD. Means with the same letters in each season are insignificantly different at p ≤ 0.05 using Tukey’s HSD test. BD, basal defoliation; BDFB, basal defoliation at full bloom; BDPB, basal defoliation at pre-bloom; CCA, cyanocobalamin; FS, foliar spray; HSD, honestly significant difference; SA, salicylic acid; SD, standard deviation.
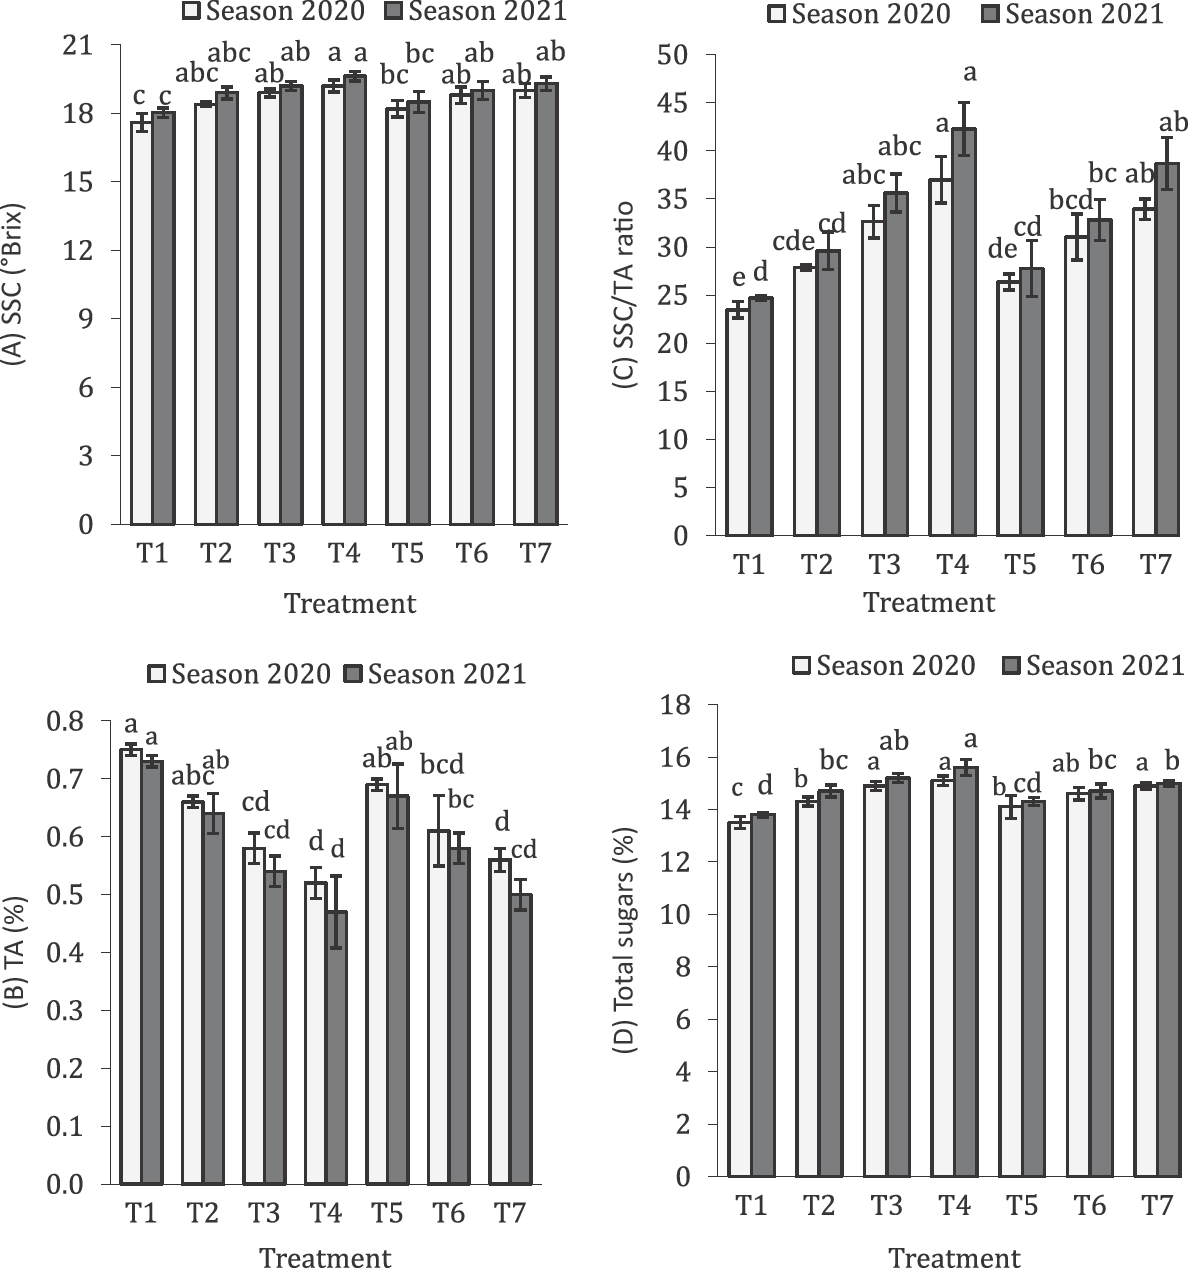
Figure 8.
Effect of BD alone or combined with FS of either SA or CCA on berry SSC (A), TA (B), SSC/TA ratio (C) and total sugars (D) of ‘Crimson Seedless’ grapes. T1 = control, T2 = BDPB, T3 = BDPB + 200 mg · L–1 SA, T4 = BDPB + 20 mg · L–1 CCA, T5 = BDFB, T6 = BDFB + 200 mg · L–1 SA and T7 = BDFB + 20 mg · L–1 CCA. Values are the means of three replicates (n = 9) ± SD. Means with the same letters in each season are insignificantly different at p ≤ 0.05 using Tukey’s HSD test. BD, basal defoliation; BDFB, basal defoliation at full bloom; BDPB, basal defoliation at pre-bloom; CCA, cyanocobalamin; FS, foliar spray; HSD, honestly significant difference; SA, salicylic acid; SD, standard deviation; SSC, soluble solid contents; TA, titratable acidity.
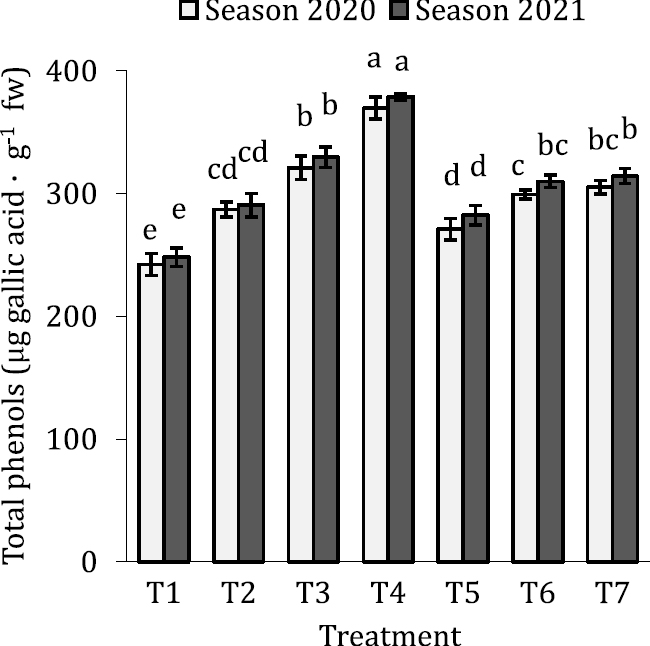
Figure 9.
Effect of BD alone or combined with FS of either SA or CCA on berry total phenol contents of ‘Crimson Seedless’ grapevines. T1 = control, T2 = BDPB, T3 = BDPB + 200 mg · L–1 SA, T4 = BDPB + 20 mg · L–1 CCA, T5 = BDFB, T6 = BDFB + 200 mg · L–1 SA and T7 = BDFB + 20 mg · L–1 CCA. Values are the means of three replicates (n = 9) ± SD. Means with the same letters in each season are insignificantly different at p ≤ 0.05 using Tukey’s HSD test. BD, basal defoliation; BDFB, basal defoliation at full bloom; BDPB, basal defoliation at pre-bloom; CCA, cyanocobalamin; FS, foliar spray; HSD, honestly significant difference; SA, salicylic acid; SD, standard deviation.
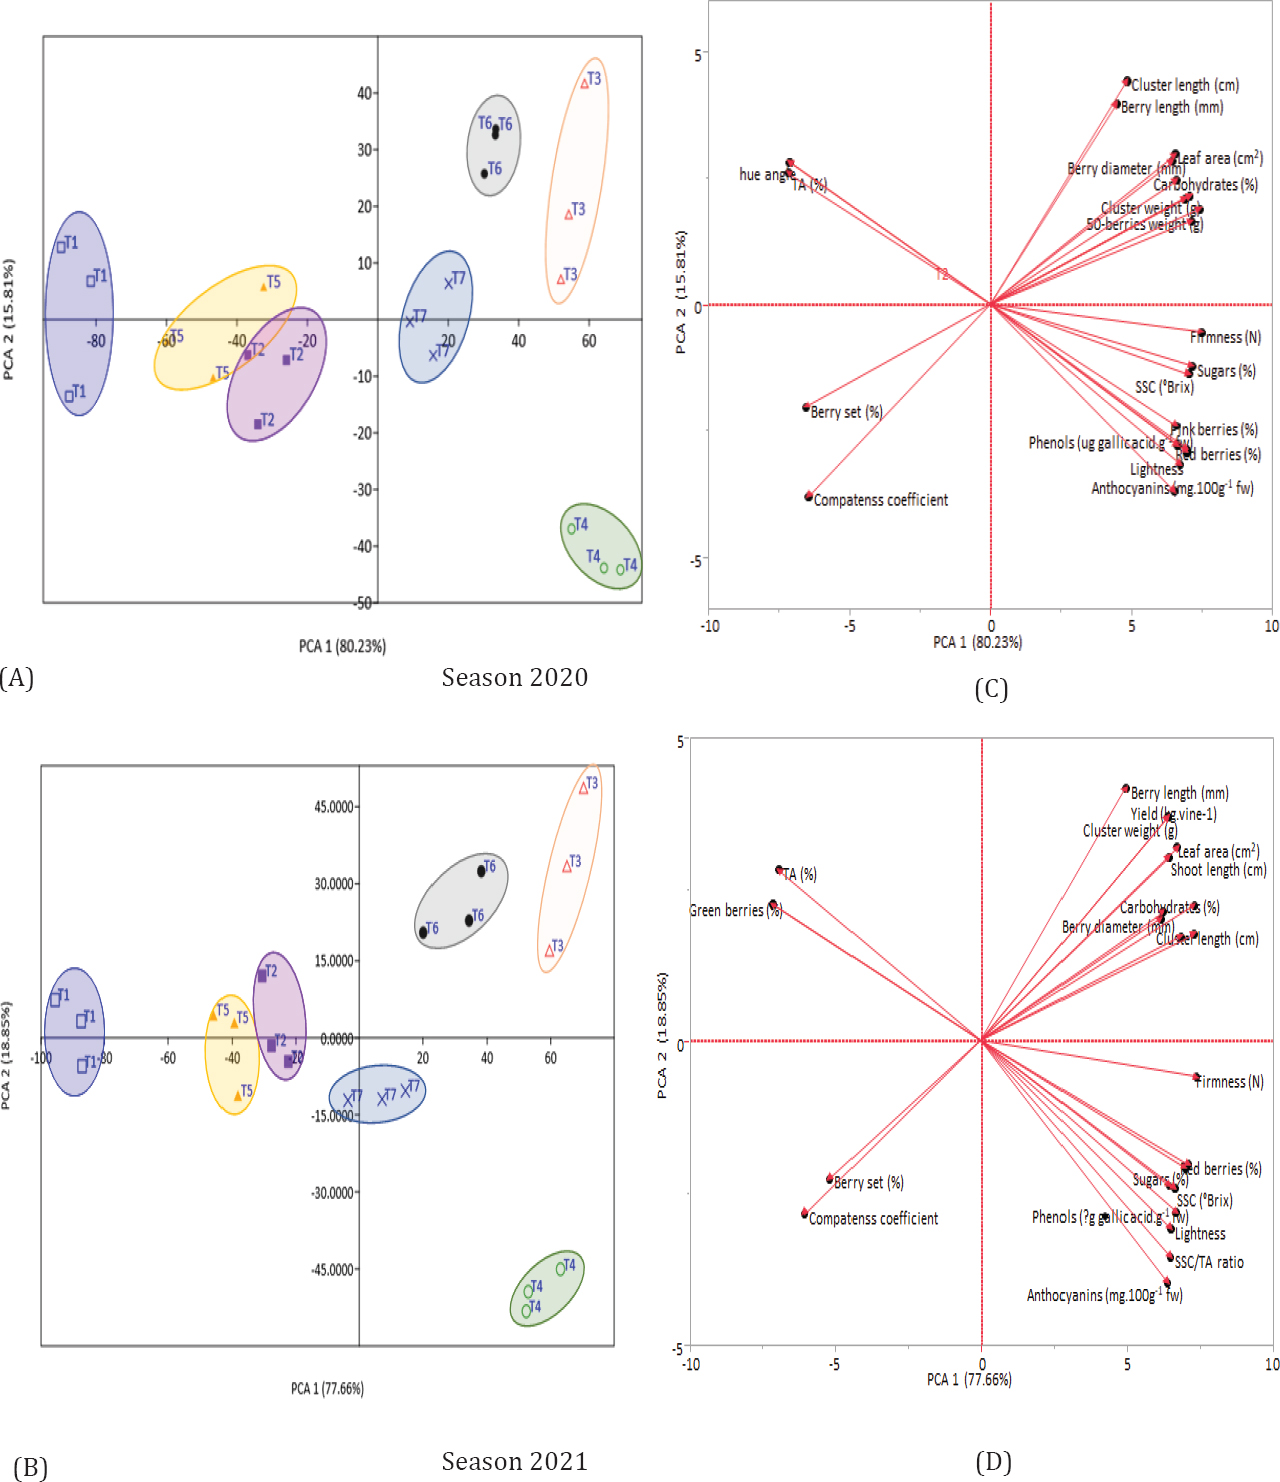
Figure 10.
PCA showing the score plots (A, B) of the treatments: T1 = control, T2 = BDPB, T3 = BDPB + 200 mg · L–1 SA, T4 = BDPB + 20 mg · L–1 CCA, T5 = BDFB, T6 = BDFB + 200 mg · L–1 SA and T7 = BDFB + 20 mg · L–1 CCA (n = 9), and their associated loading plots (C, D) of various ‘Crimson Seedless’ plant and fruit characteristics during the 2020 and 2021 seasons, respectively. BD, basal defoliation; BDFB, basal defoliation at full bloom; BDPB, basal defoliation at pre-bloom; CCA, cyanocobalamin; FS, foliar spray; HCA, hierarchical cluster analysis; HSD, honestly significant difference; PCA, principal component analysis; SA, salicylic acid; SD, standard deviation.
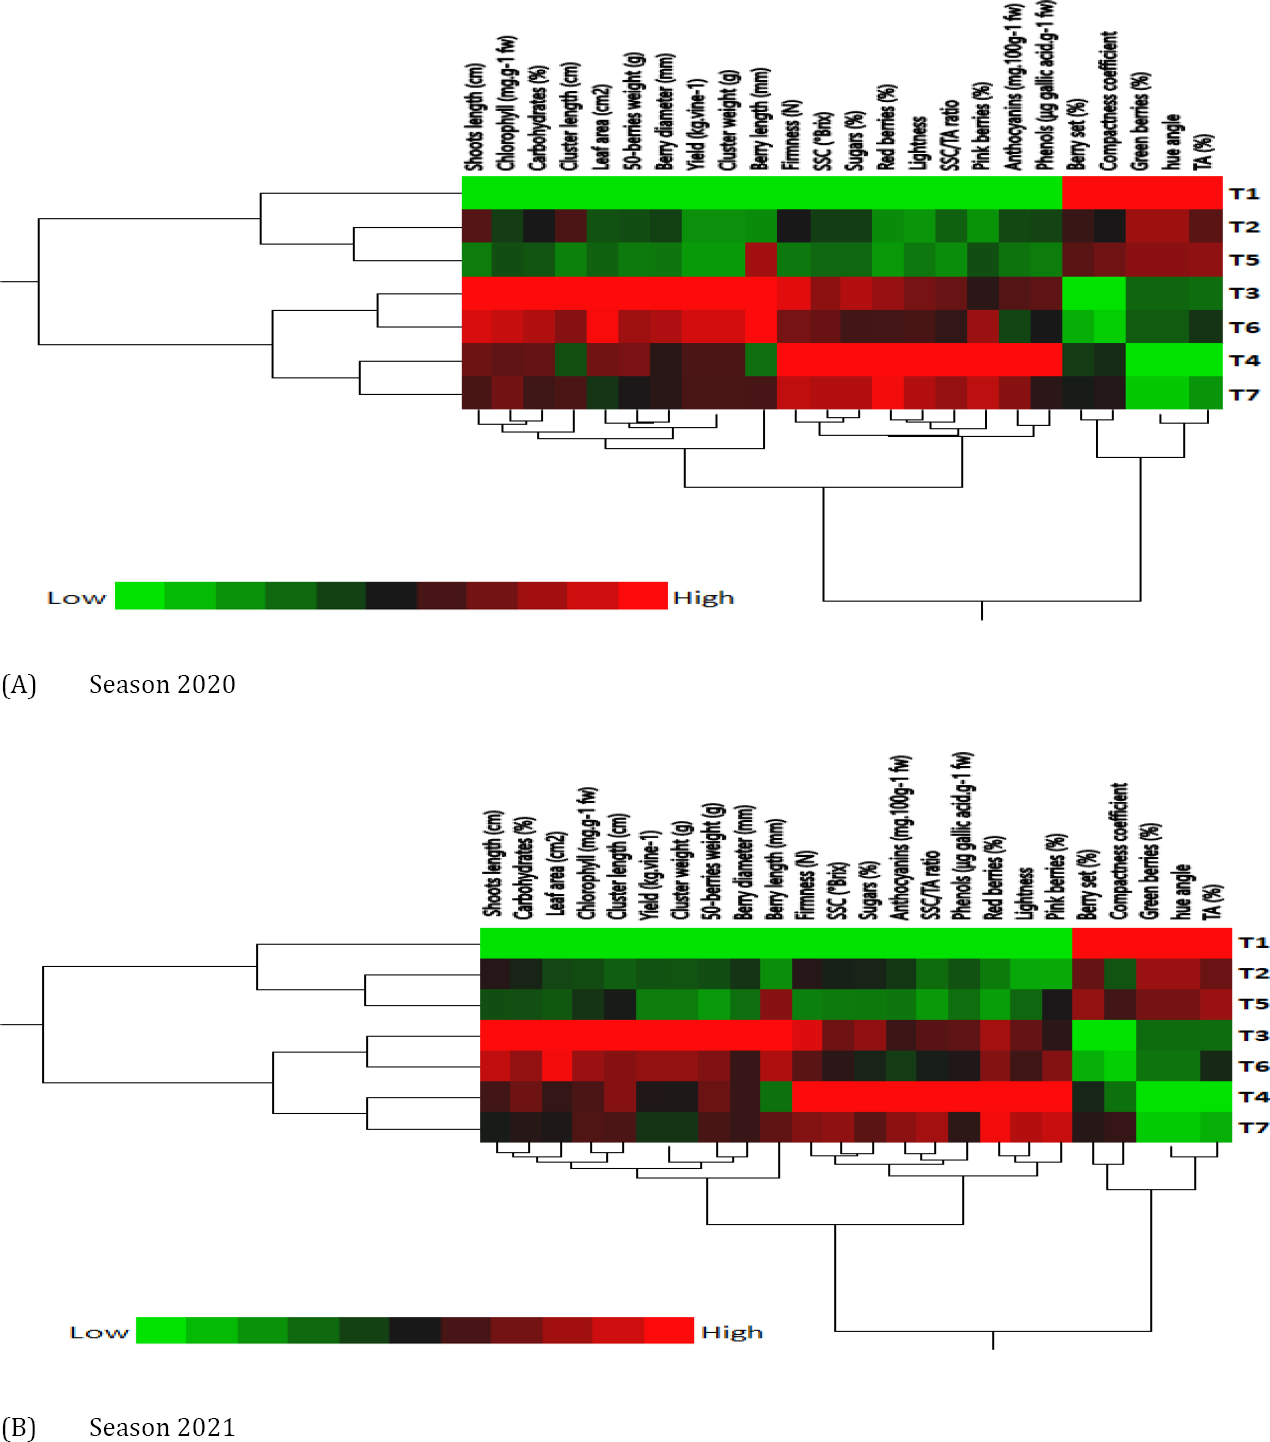
Figure 11.
Two-way HCA and heat map showing the effect of BD alone or combined with FS of either SA or CCA on various ‘Crimson Seedless’ plant and fruit characteristics during the 2020 (A) and 2021 (B) seasons. Rows represent the treatments: T1 = control, T2 = BDPB, T3 = BDPB + 200 mg · L–1 SA, T4 = BDPB + 20 mg · L–1 CCA, T5 = BDFB, T6 = BDFB + 200 mg · L–1 SA and T7 = BDFB + 20 mg · L–1 CCA. Columns represent the plant and fruit characteristics. Higher peak areas are coloured red, and lower peak areas are coloured green. BD, basal defoliation; BDFB, basal defoliation at full bloom; BDPB, basal defoliation at pre-bloom; CCA, cyanocobalamin; FS, foliar spray; HCA, hierarchical cluster analysis; HSD, honestly significant difference; SA, salicylic acid; SD, standard deviation.