
Table 1.
The 13 substrate formulations.
| Group | Treatment | Substrate formulations | Formulation ratio |
|---|---|---|---|
| CK | CK1 | Coconut coir:peat | 2:1 |
| CK2 | Peat:perlite | 2:1 | |
| CK3 | Peat:perlite: vermiculite | 3:1:1 | |
| Basic | T1 | Mushroom waste: sawdust | 4:1 |
| T3 | Mushroom waste: chicken manure: sawdust | 5:1:1 | |
| T5 | Mushroom waste: chicken manure: sawdust | 3:1:1 | |
| T7 | Mushroom waste: chicken manure: sawdust | 2:1:1 | |
| T9 | Mushroom waste: urea:sawdust | 4:1:1 | |
| Advanced | T2 | T1:perlite: vermiculite | 2:1:1 |
| T4 | T3:perlite: vermiculite | 2:1:1 | |
| T6 | T5:perlite: vermiculite | 2:1:1 | |
| T8 | T7:perlite: vermiculite | 2:1:1 | |
| T10 | T9:perlite: vermiculite | 2:1:1 |
Table 2.
Optimisation of the mushroom waste percentage in the composite substrate formulation.
| Treatment | Substrate formulations | Formulations ratio |
|---|---|---|
| F1 | T1:perlite:vermiculite | 3:1:1 |
| F2 (T2) | T1:perlite:vermiculite | 2:1:1 |
| F3 | T1:perlite:vermiculite | 1:1:1 |
| CK1 | Coconut coir:peat | 2:1 |
| CK2 | Peat:perlite | 2:1 |
Table 3.
The physical property determination methods.
| Physical properties | Calculation formula |
|---|---|
| Weight capacity (g · cm–3) | (W2–W1)/V |
| Total porosity (%) | (W3–W2)/V × 100% |
| Ventilation porosity (%) | (W3–W4)/V × 100% |
| Water-holding porosity (%) | (W4–W2)/V × 100% |
| Air-to-water ratio | Ventilation porosity (%)/Water-holding porosity (%) |
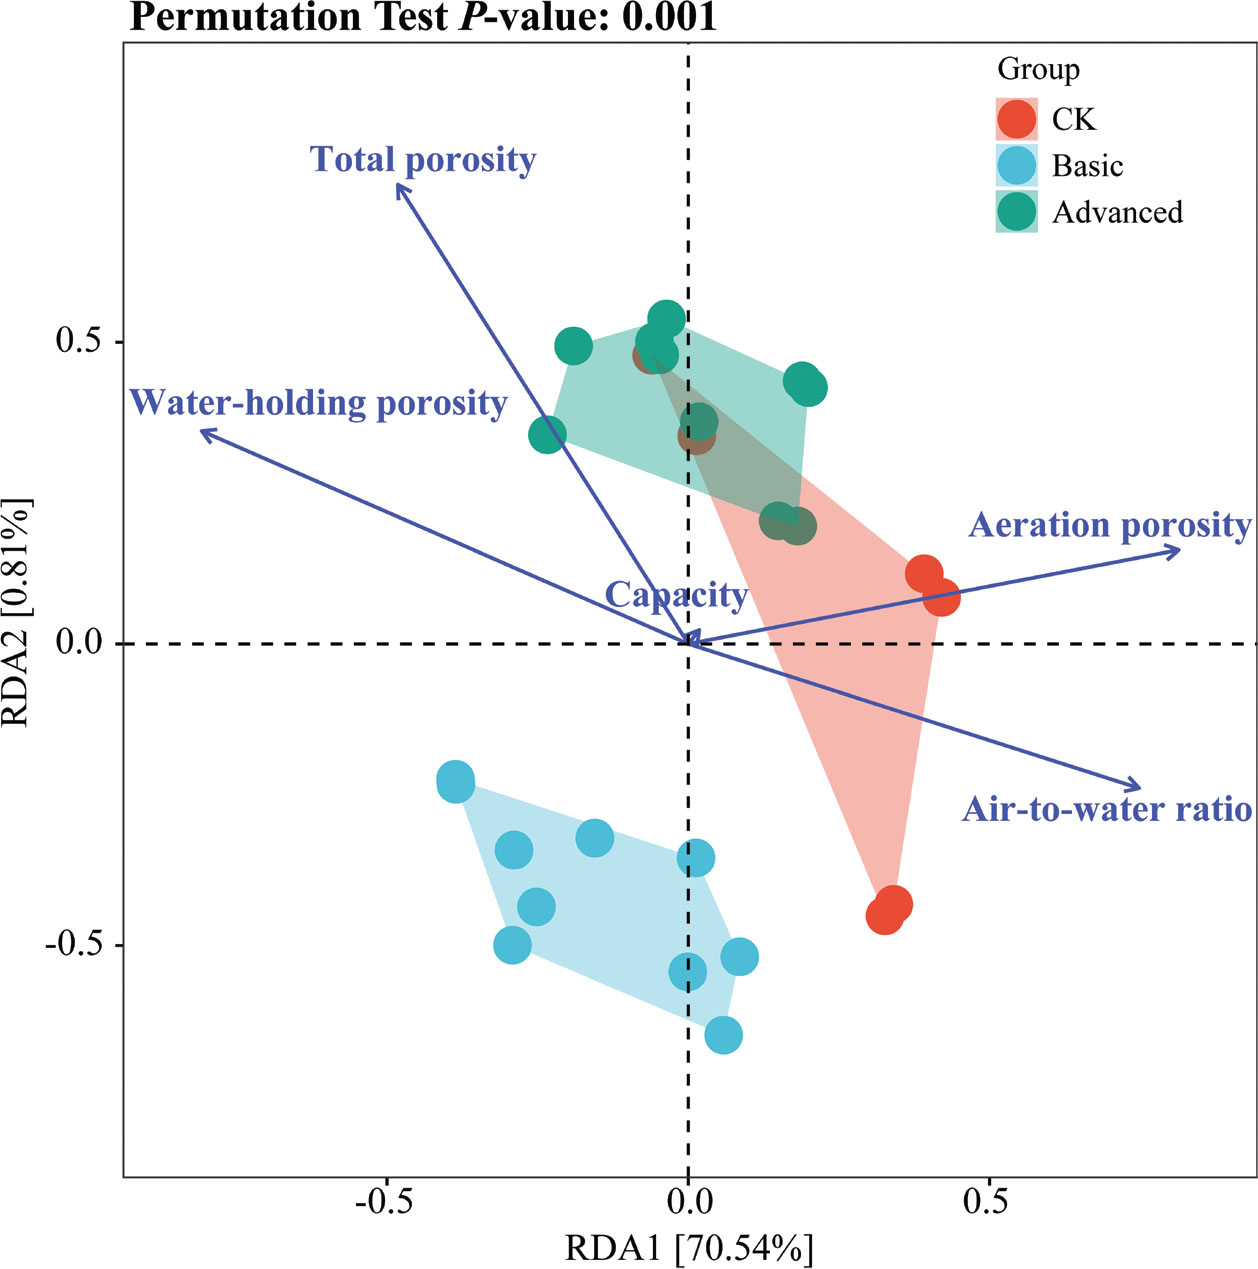
Figure 1.
The RDA of the different substrate formulations and physical properties. RDA, redundancy analysis.
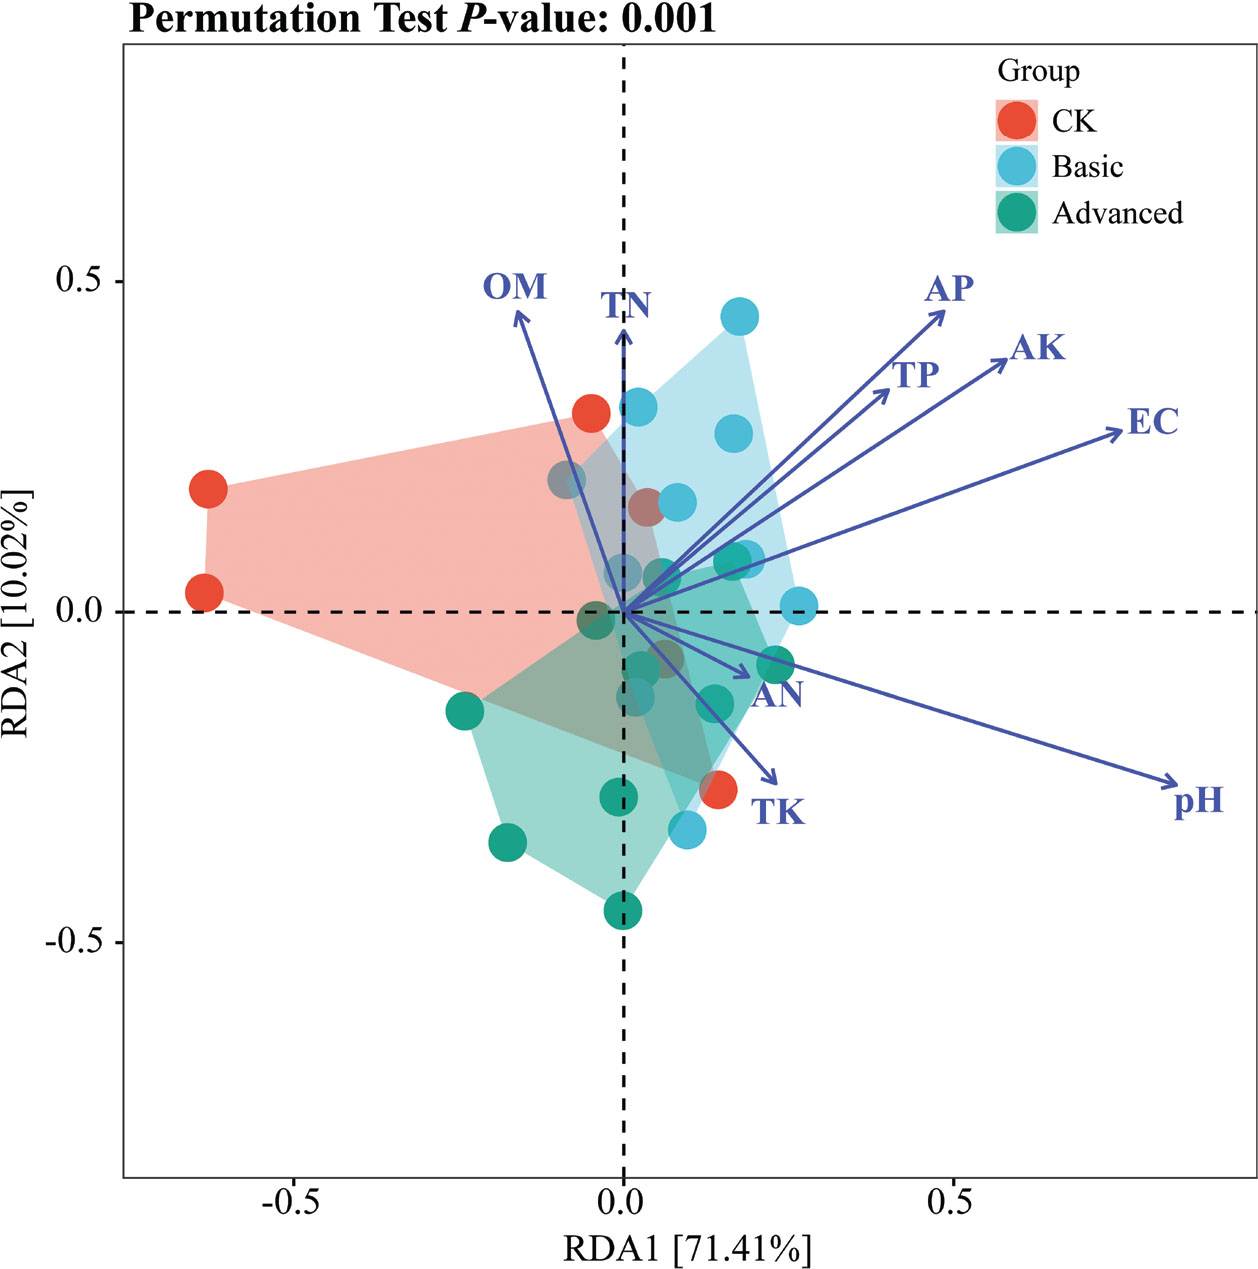
Figure 2.
The RDA of the different substrate formulations and chemical properties. RDA, redundancy analysis.
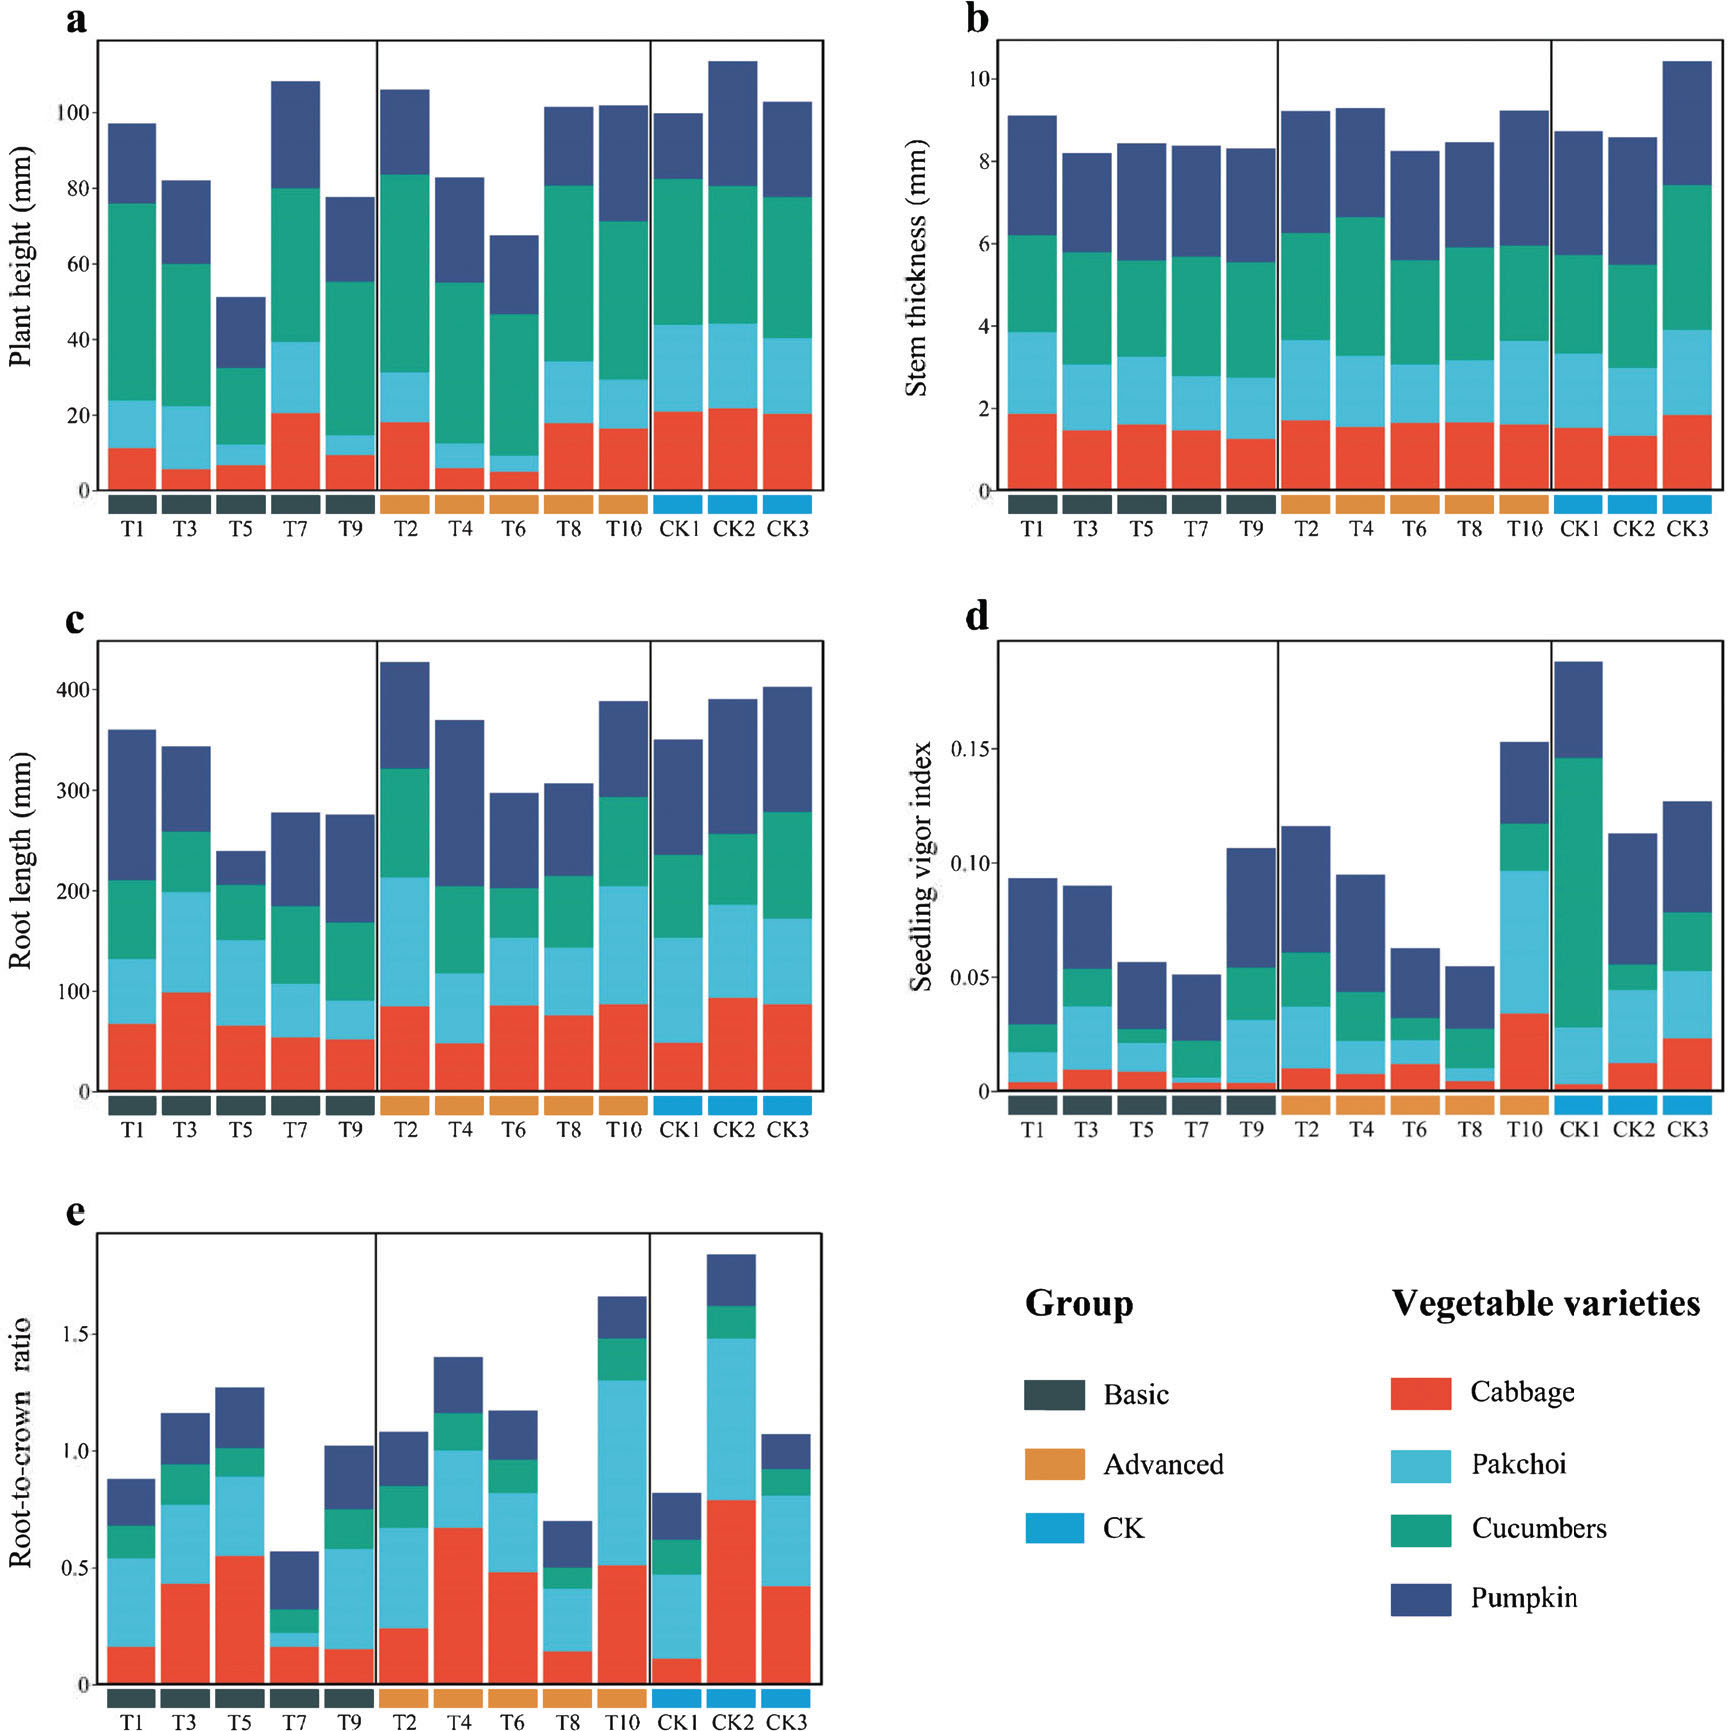
Figure 3.
The effect of the different substrate formulations on the biological traits of the four vegetable seedlings: (A) plant height; (B) stem thickness; (C) root length; (D) seedling vigour index; and (E) root-to-crown ratios.
Table 4.
The explanatory variables obtained via RFF analysis.
| The explanatory degree of model variables var% (% var explained). | |||||
|---|---|---|---|---|---|
| Types | Plant height (mm) | Stem thickness (mm) | Root length (mm) | Seedling vigour index | Root-to-crown ratio |
| Cabbage | 27.57 | 4.25 | −72.22 | −43.45 | −45.83 |
| Pakchoi | 14.20 | 21.75 | −17.84 | 4.56 | −2.12 |
| Cucumber | −27.13 | −76.81 | 10.27 | −36.96 | 7.31 |
| Pumpkin | −43.86 | 0.56 | 7.22 | 16.97 | −10.69 |
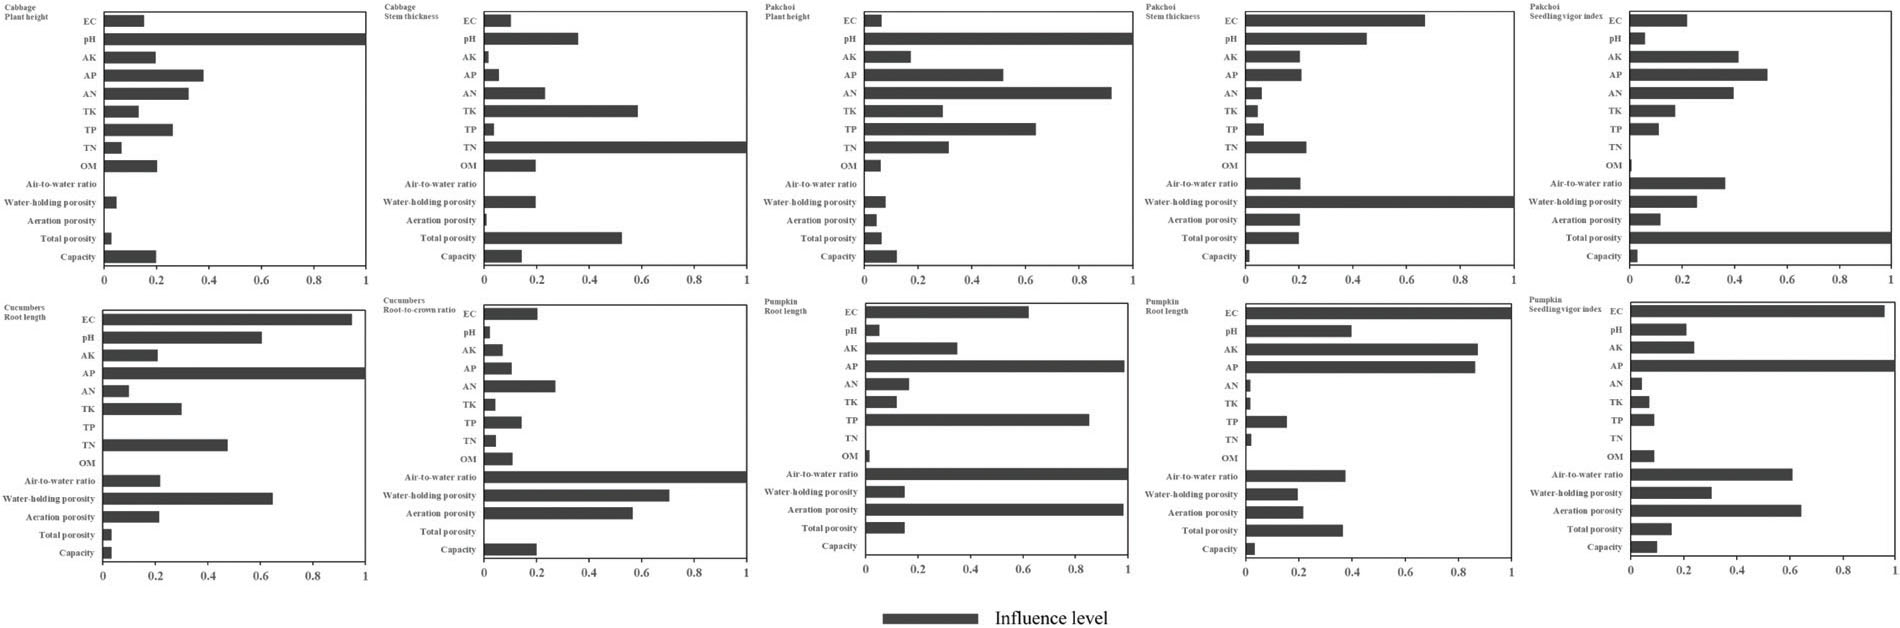
Figure 4.
The correlation between the biological traits of the vegetable seedlings and each influencing factor. The correlation between the biological traits of the vegetable seedlings and each influencing factor.
Table 5.
The physicochemical substrate properties used to optimise the mushroom waste percentage.
| Physicochemical properties | F1 | F2 | F3 | CK1 | CK2 | |
|---|---|---|---|---|---|---|
| Physical properties | Bulk weights (g · cm−3 | 0.27 ± 0.03 a | 0.15 ± 0.02 b | 0.13 ± 0.02 b | 0.11 ± 0.01 b | 0.28 ± 0.03 a |
| Total porosity (%) | 68.27 ± 0.48 b | 69.09 ± 2.07 b | 69.42 ± 0.02 ab | 55.76 ± 1.34 c | 74.45 ± 2.23 a | |
| Aeration porosity (%) | 21.30 ± 0.00 d | 22.94 ± 0.53 c | 24.58 ±0.00 b | 26.54 ± 0.61 a | 15.81 ± 0.36 e | |
| Water-holding porosity (%) | 56.75 ± 9.26 a | 46.15 ± 1.15 ab | 55.56 ± 10.74 a | 29.22 ± 0.56 b | 58.64 ± 1.47 a | |
| Air-water ratio | 0.39 ± 0.07 bc | 0.50 ± 0.01 b | 0.46 ± 0.09 b | 0.91 ± 0.03 a | 0.27 ± 0.00 c | |
| Chemical properties | OM (%) | 37.62 ± 1.71 b | 35.19 ± 1.09 b | 26.86 ± 1.22 c | 55.76 ± 0.32 a | 26.66 ± 2.15 c |
| TN (g · kg−1) | 5.20 ± 0.70 a | 6.19 ± 0.19 a | 6.15 ± 0.08 a | 3.74 ± 0.04 b | 3.18 ± 0.14 b | |
| TP (g · kg−1) | 4.00 ± 0.00 a | 4.56 ± 0.04 a | 6.28 ± 1.55 a | 1.23 ± 0.01 b | 0.59 ± 0.07 b | |
| TK (g · kg−1) | 16.47 ± 0.72 c | 26.78 ± 1.60 a | 23.70 ± 0.47 b | 9.79 ± 0.02 d | 9.06 ± 0.24 d | |
| pH | 6.88 ± 0.16 a | 6.85 ± 0.00 a | 6.83 ± 0.09 a | 4.50 ± 0.01 b | 7.08 ± 0.03 a | |
| EC (mS · cm–1) | 0.120 ± 0.001 b | 0.110 ± 0.002 bc | 0.099 ± 0.002 c | 0.072 ± 0.002 d | 0.171 ± 0.010 a | |
1 The data in the table are expressed as the means (±SD) of three biological replicates. Different lowercase letters after peer data represent significant differences between the treatments at the P < 0.05 level.
CK1, control group substrate 1; CK2, control group substrate 2; EC, electrical conductivity; OM, organic matter; TK, total potassium; TN, total nitrogen; TP, total phosphorus.
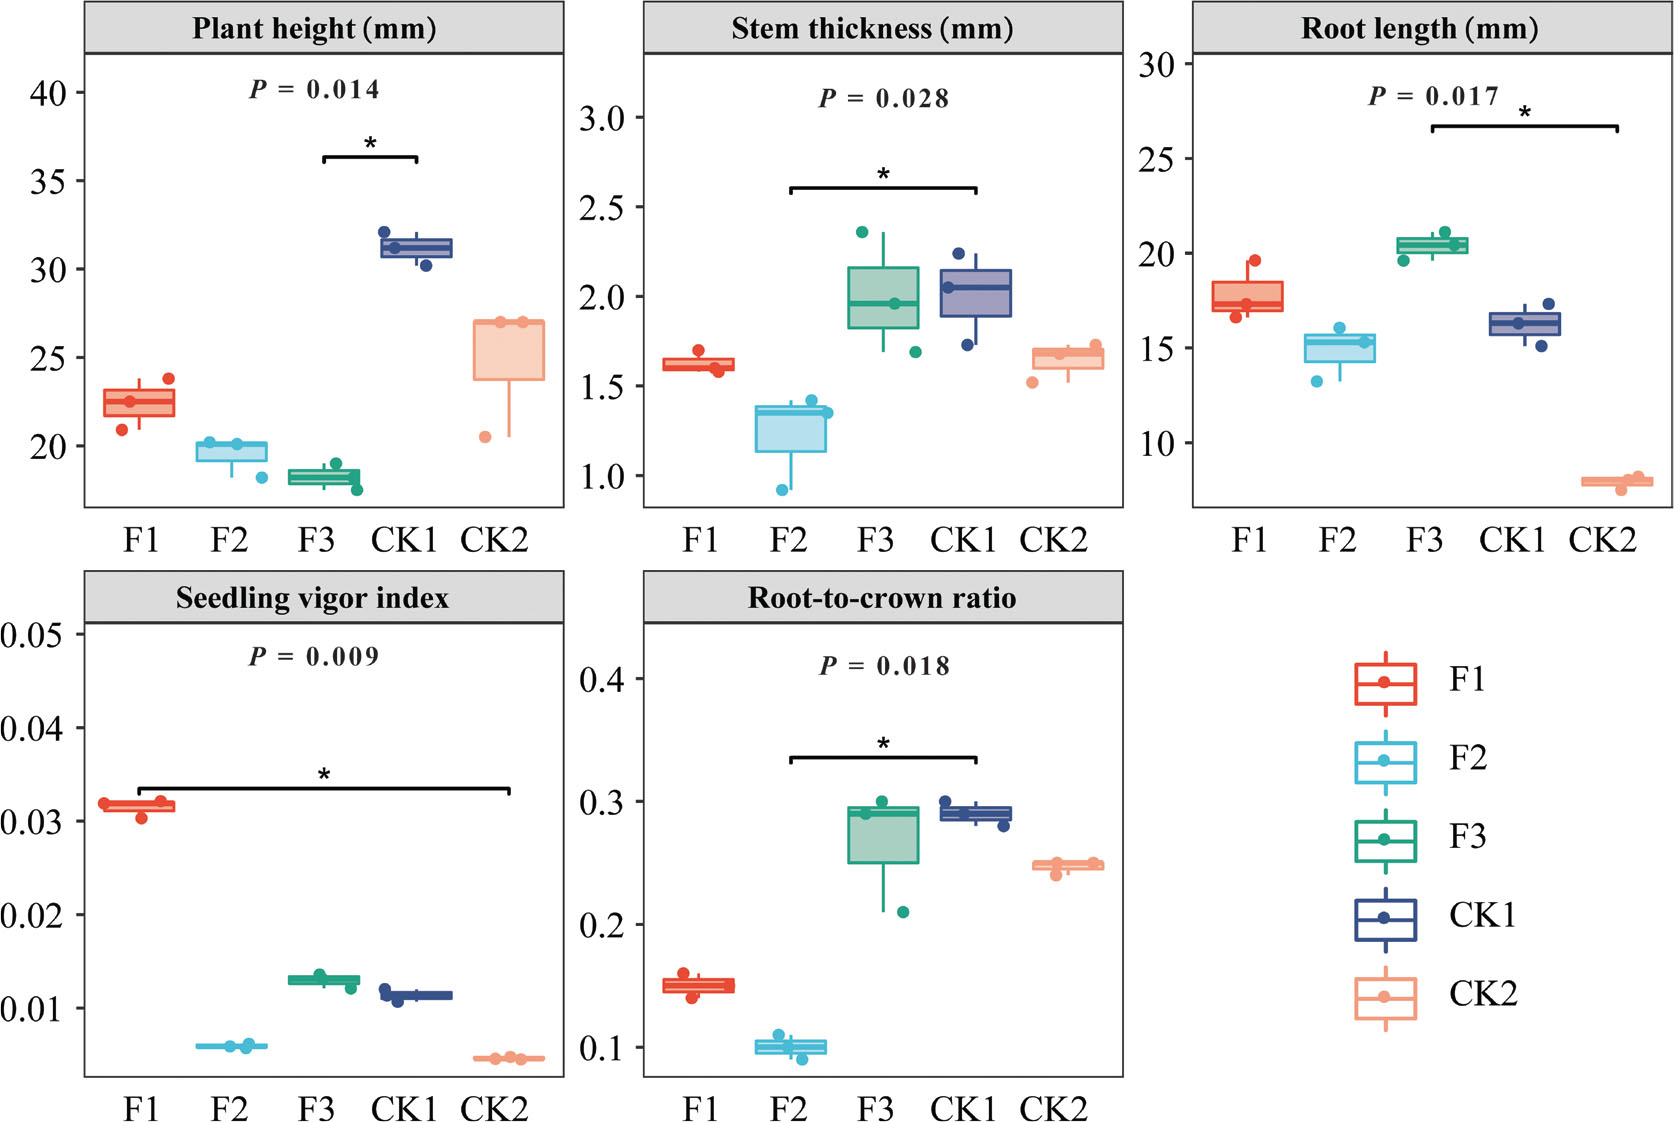
Figure 5.
The box plot of the differences between the biological traits of the pakchoi seedlings.