
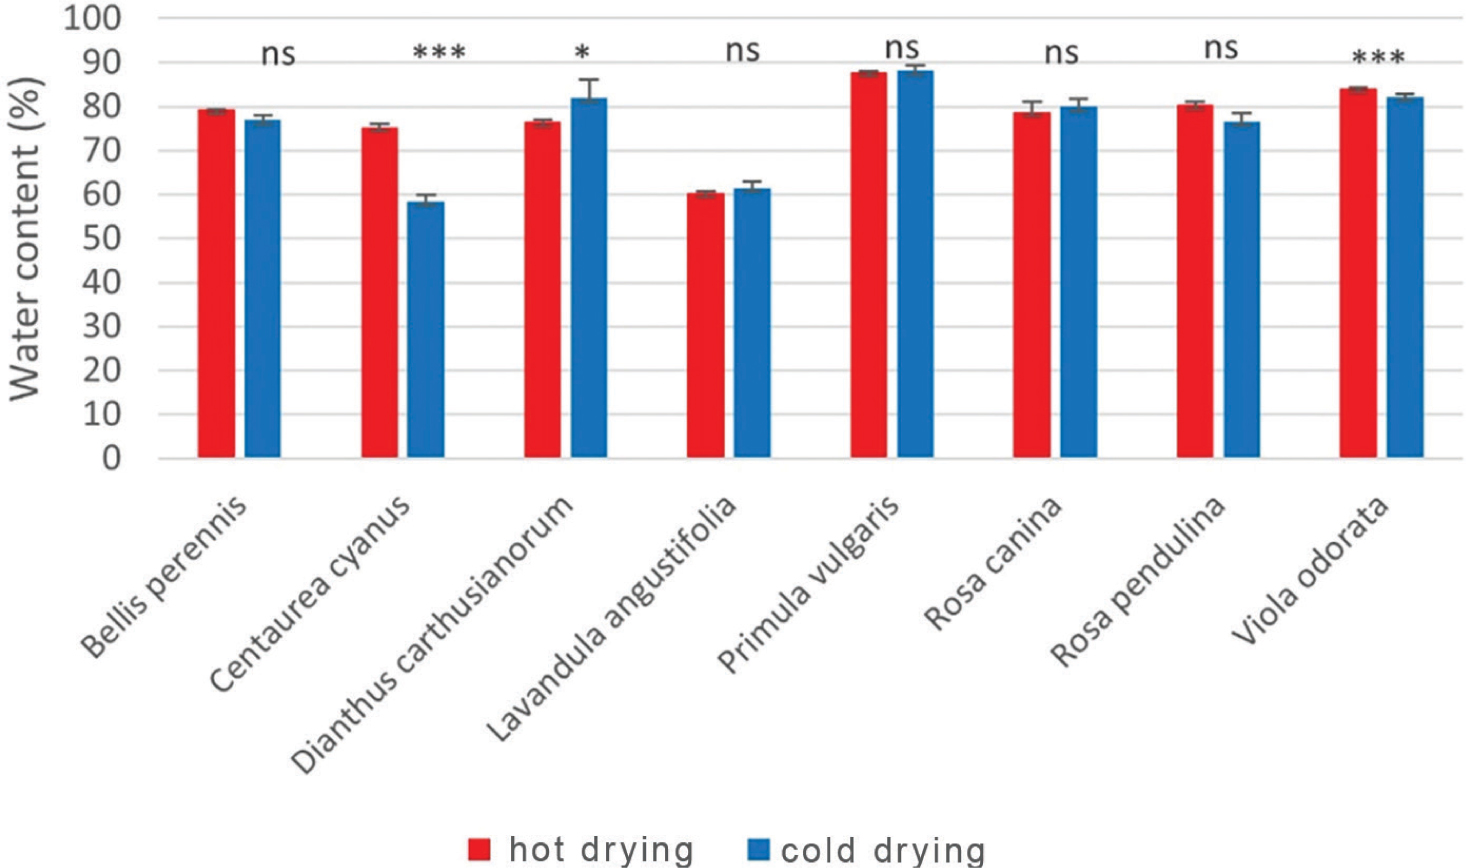
Figure 1.
Percentage of water (%) extracted from edible flowers after 24 h of HD and CD. Significance of the Kruskal–Wallis post hoc test is provided. * = p < 0.05, *** = p < 0.001, CD, cold drying; ns, not significant.
Table 1.
Effects of different drying and extraction methods, species and their interactions on TAC, TPC and antioxidant activity of edible flowers according to GLM.
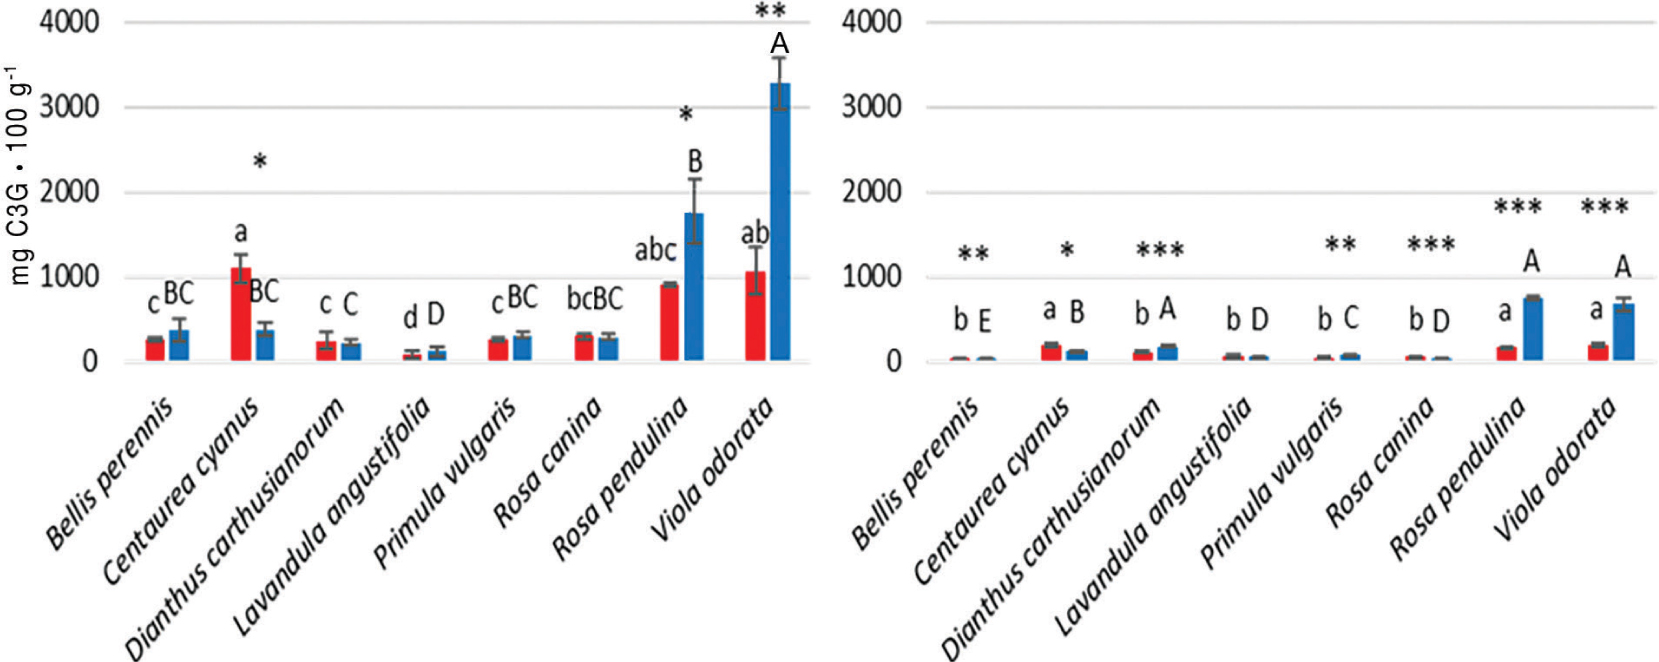
Figure 2.
TAC of edible flower extracts (UAE, left) and DEC (right) after HD (red bars) and CD (blue bars). Small case letters indicate significant differences between species along HD, while capital letters between species along CD. Asterisks indicate significant differences between HD and CD considering the single species. *** = p < 0.001, ** = p < 0.01, * = p < 0.05. CD, cold drying; DEC, decoctions; HD, hot drying; TAC, total anthocyanin content; UAE, ultrasound-assisted extract.
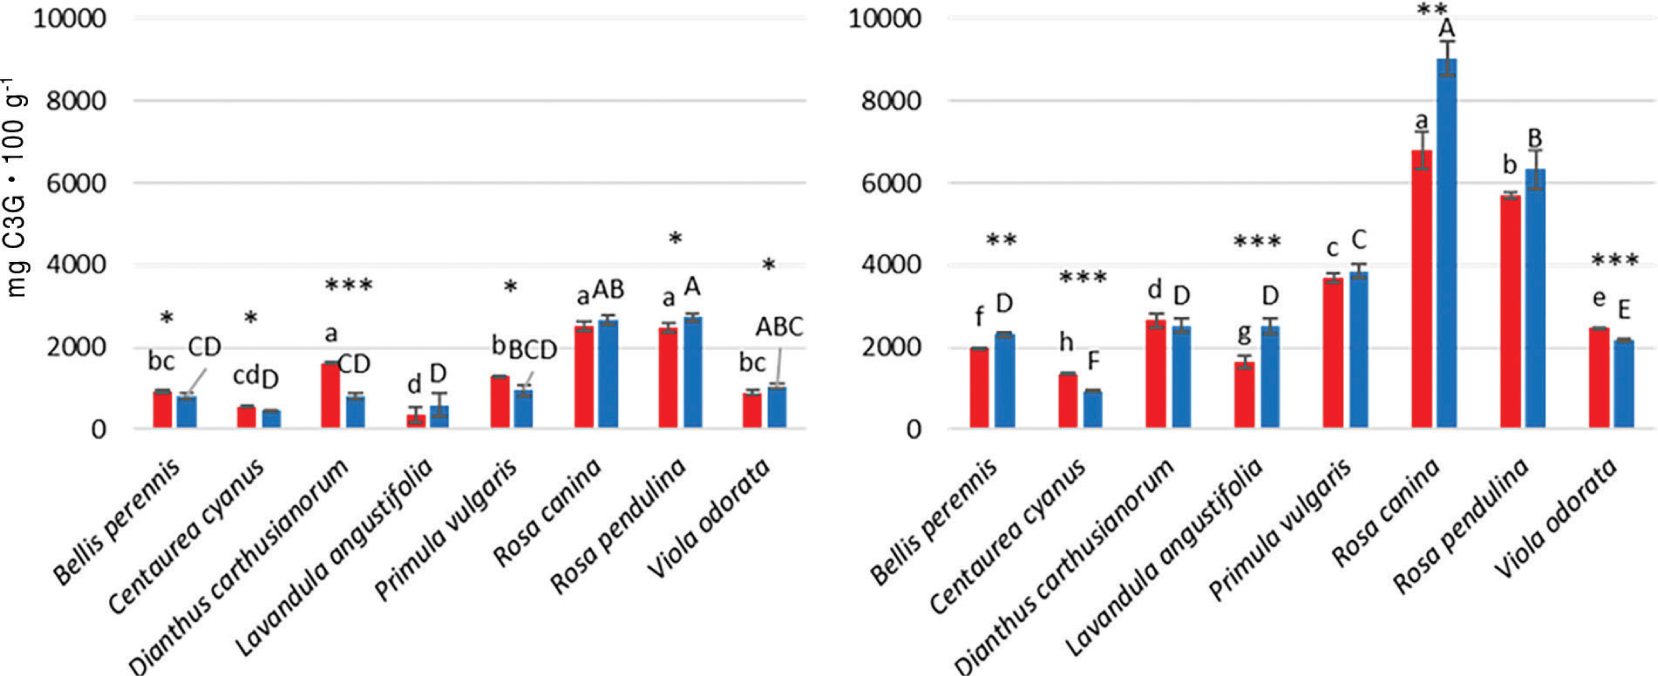
Figure 3.
TPC of edible flower extracts (UAE, left) and DEC (right) after HD (red bars) and CD (blue bars). Small case letters indicate significant differences between species along HD, while capital letters between species along CD. Asterisks indicate significant differences between HD and CD considering the single species. *** = p < 0.001, ** = p < 0.01, * = p < 0.05. CD, cold drying; DEC, decoctions; HD, hot drying; TPC, total phenolic content.
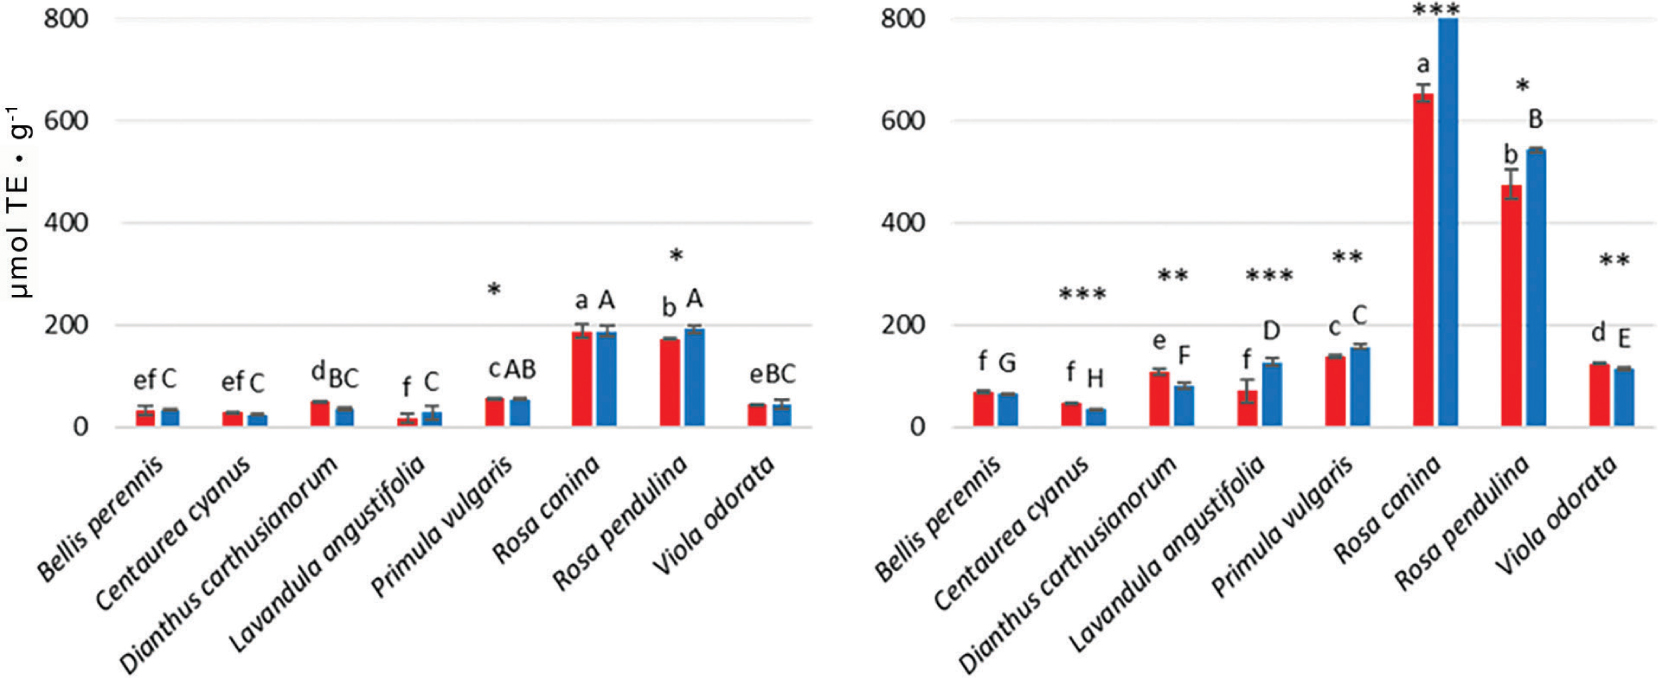
Figure 4.
Antioxidant activity evaluated through the ABTS assay of edible flower extracts (UAE, left) and DEC (right) after HD (red bars) and CD (blue bars). Small case letters indicate significant differences between species along HD, while capital letters between species along CD. Asterisks indicate significant differences between HD and CD considering the single species. *** = p < 0.001, ** = p < 0.01, * = p < 0.05. ABTS, 2,2′-azino-bis (3-ethylbenzthiazoline-6-sulphonic acid; CD, cold drying; DEC, decoctions; HD, hot drying; UAE, ultrasound-assisted extract.
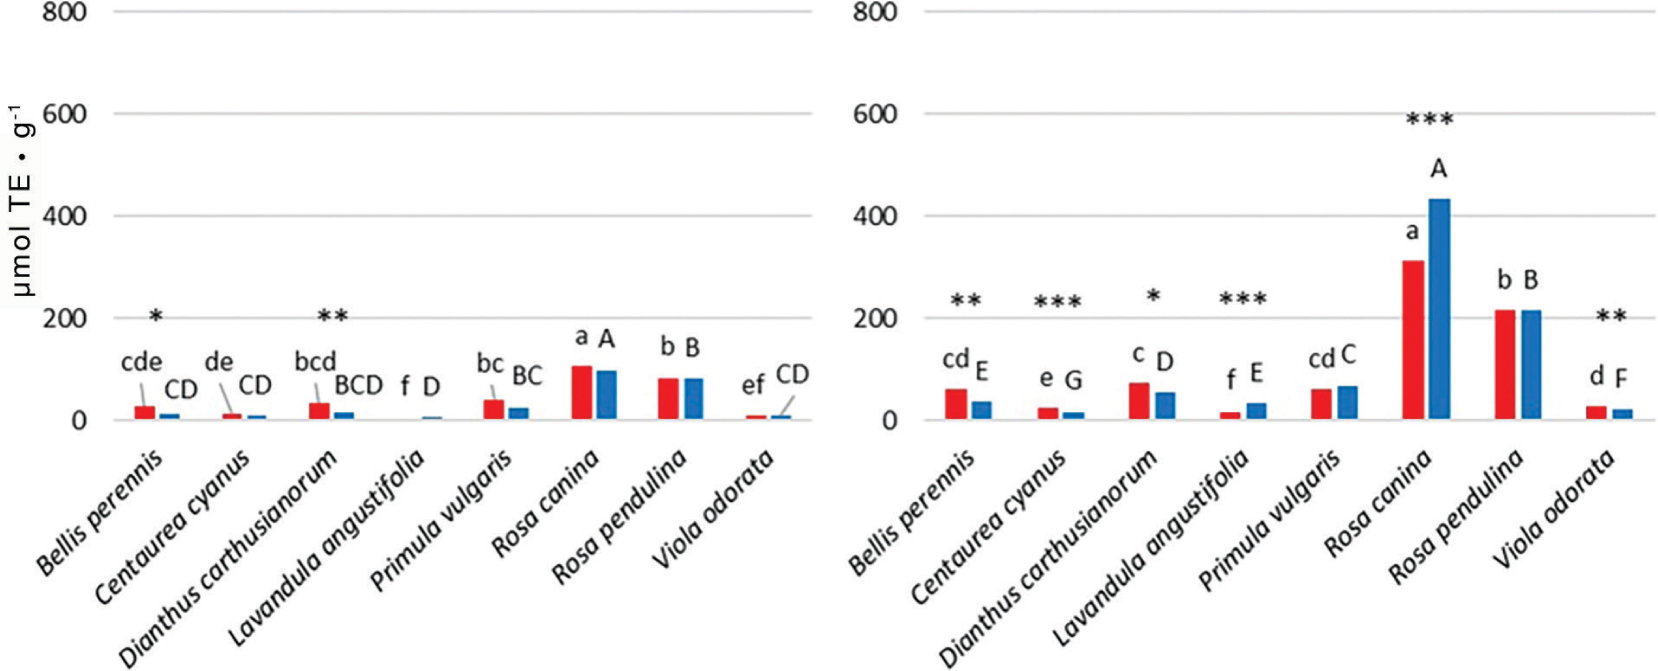
Figure 5.
Antioxidant activity evaluated through the DPPH assay of edible flower extracts (UAE, left) and DEC (right) after HD (red bars) and CD (blue bars). Small case letters indicate significant differences between species along HD, while capital letters between species along CD. Asterisks indicate significant differences between HD and CD considering the single species. *** = p < 0.001, ** = p < 0.01, * = p < 0.05. CD, cold drying; DEC, decoction; DPPH, 2,2-diphenyl-1-picrylhydrazyl; HD, hot drying; UAE, ultrasound-assisted extract.
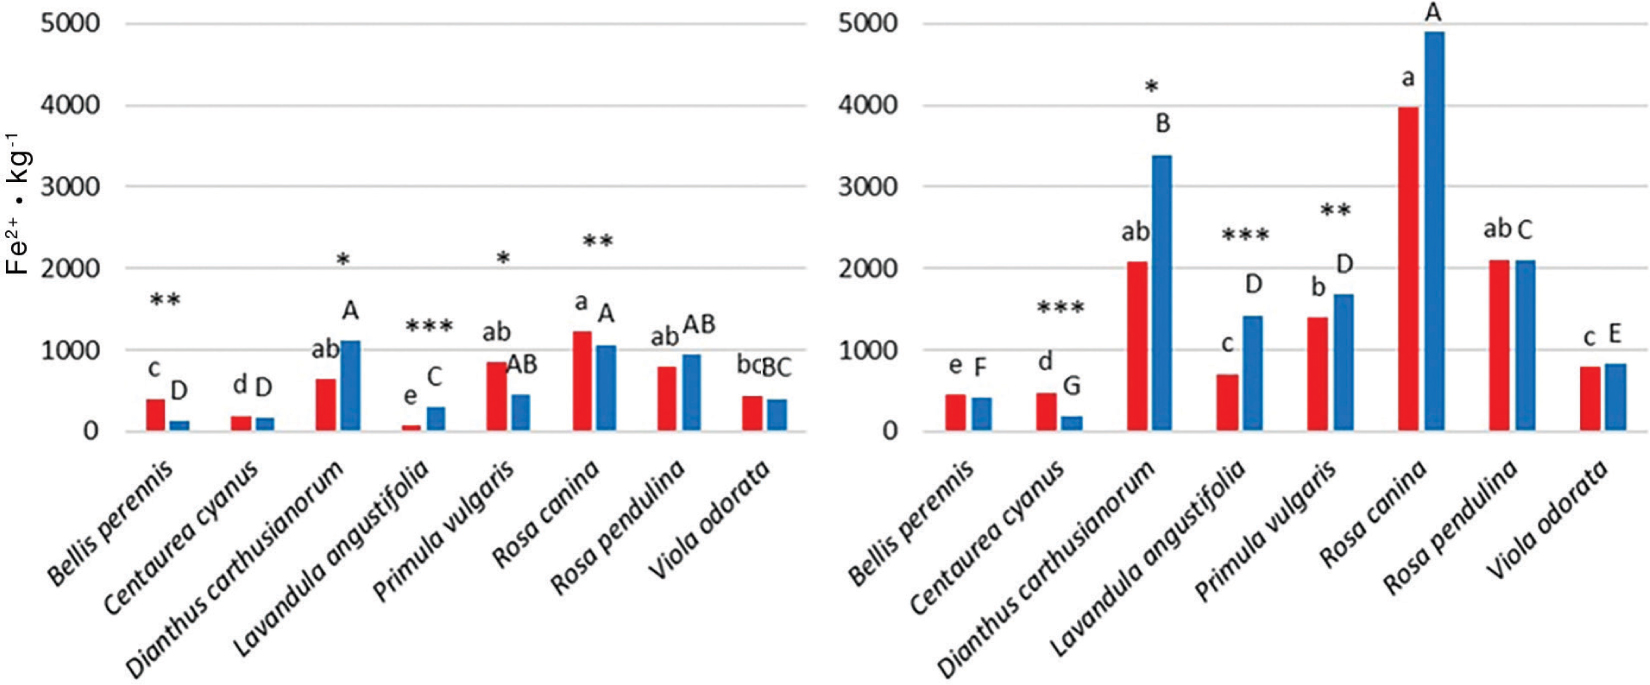
Figure 6.
Antioxidant activity evaluated through the FRAP assay of edible flower extracts (UAE, left) and DEC (right) after HD (red bars) and CD (blue bars). Small case letters indicate significant differences between species along HD, while capital letters between species along CD. Asterisks indicate significant differences between HD and CD considering the single species. *** = p < 0.001, ** = p < 0.01, * = p < 0.05. CD, cold drying; DEC, decoctions; FRAP, ferric reducing antioxidant power; HD, hot drying; UAE, ultrasound-assisted extract.
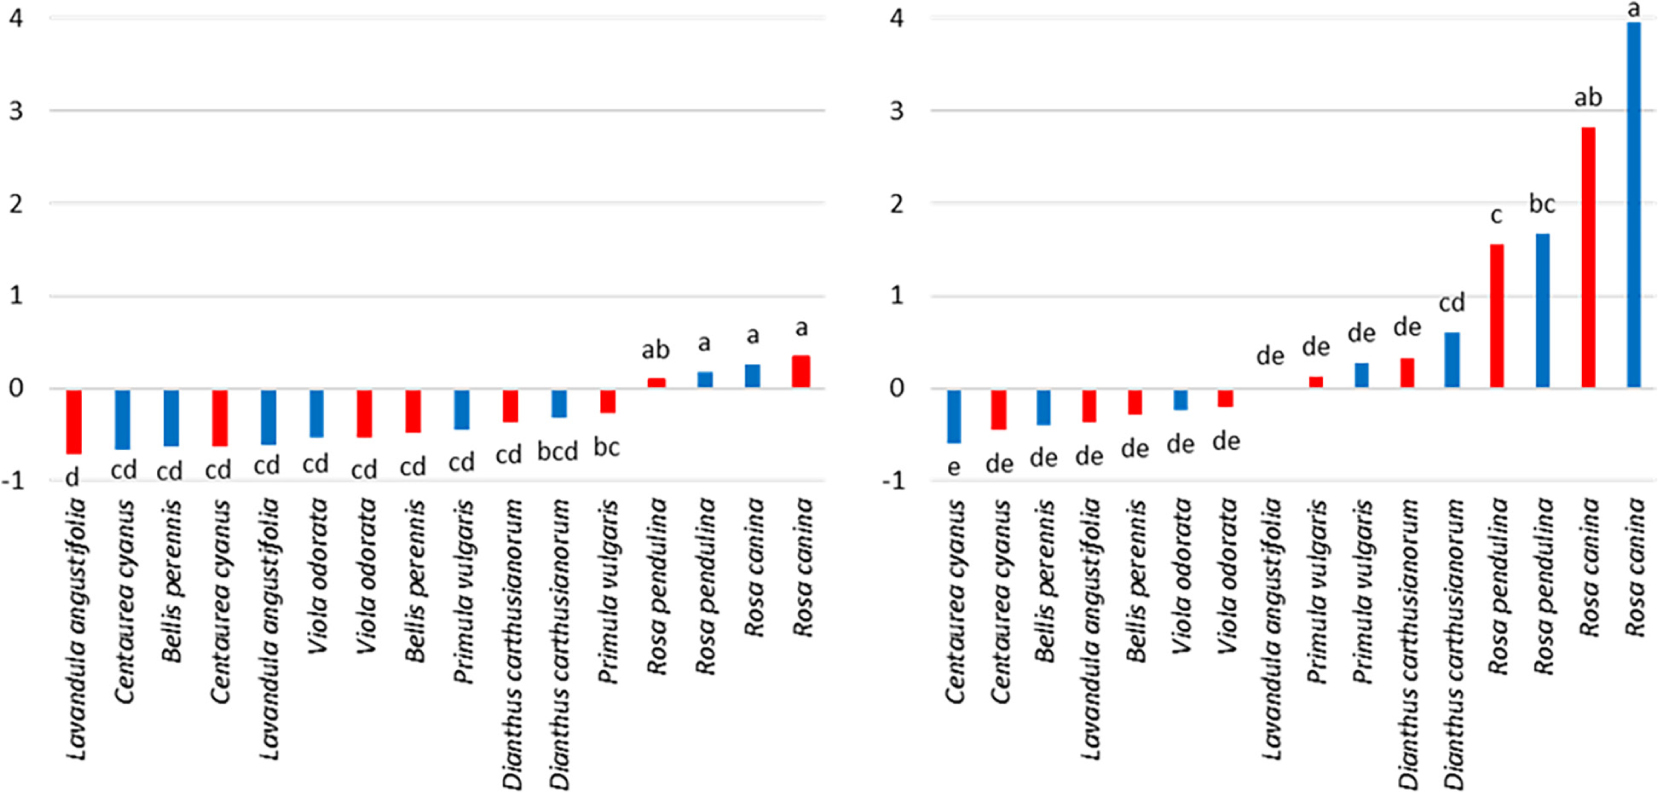
Figure 7.
RACI of edible flower extracts (UAE, left) and DEC (right) after HD (red bars) and CD (blue bars). Small case letters indicate significant differences between species, according to the nonparametric Kruskal–Wallis test (p < 0.05). CD, cold drying; DEC, decoctions; HD, hot drying; RACI, relative antioxidant capacity index; UAE, ultrasound-assisted extract.
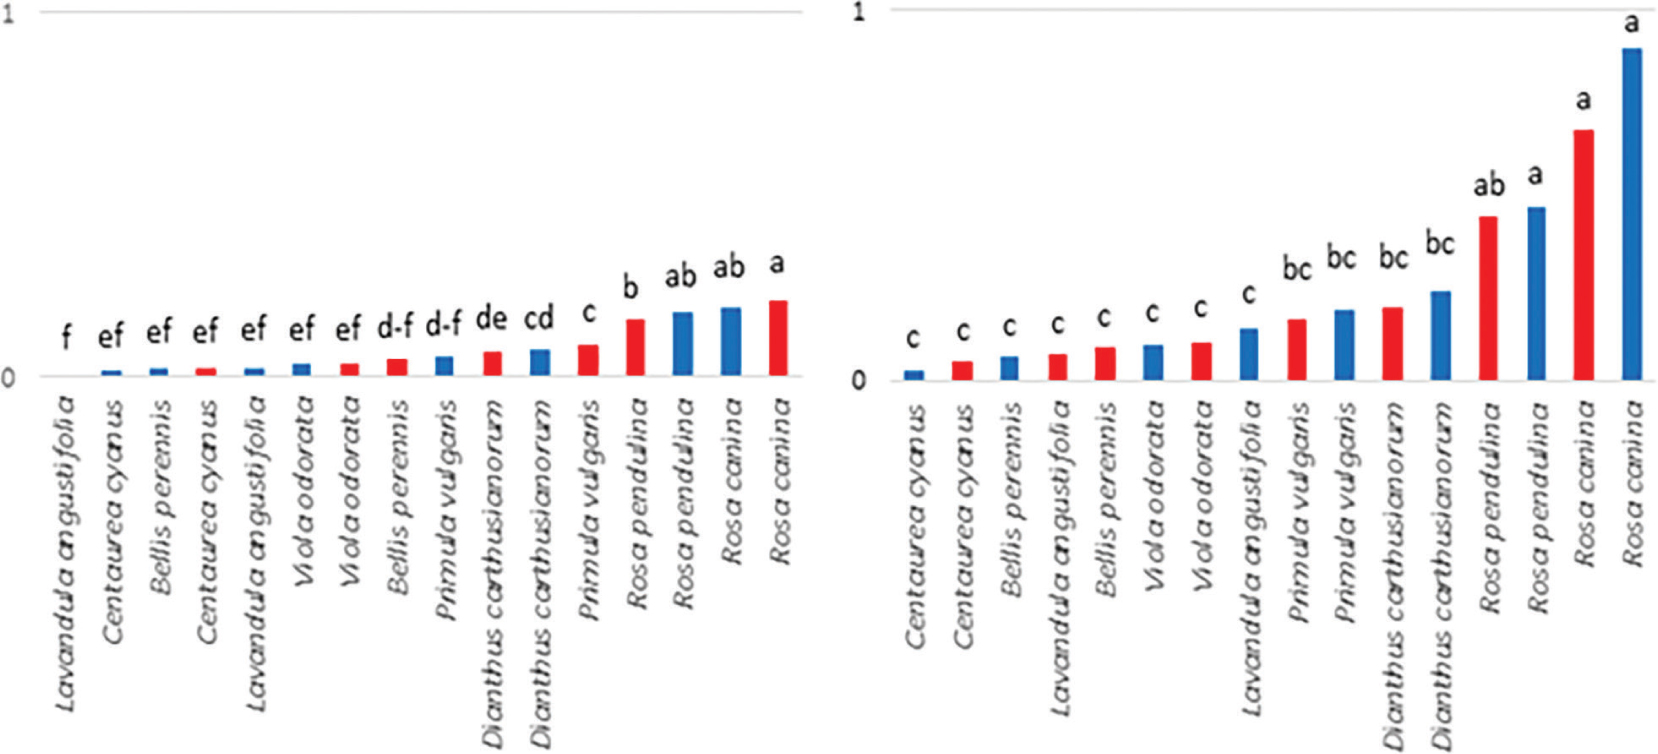
Figure 8.
GAS of edible flower extracts (UAE, left) and DEC (right) after HD (red bars) and CD (CD, blue bars). Small case letters indicate significant differences between species, according to the nonparametric Kruskal–Wallis test (p < 0.05). CD, cold drying; DEC, decoction; GAS, global antioxidant score; HD, hot drying; UAE, ultrasound-assisted extract.
Table 2.
Effect of HD and CD on the content (mg · 100 g-1) of different classes of phenolic compounds in edible flower extracts (UAEs) and DECs.
Table 3.
Effects of HD and CD in the yield of phenolic compounds (mg · 100 g-1) in edible flower extracts.
| HD | CD | Sign. | |
|---|---|---|---|
| Cinnamic acids | |||
| Lavandula angustifolia | 62.4 | 9.6 | * |
| Primula vulgaris | 5.6 | 66.8 | ** |
| Viola odorata | 100.8 | 392.7 | *** |
| Flavonols | |||
| Centaurea cyanus | 45.5 | 372.0 | *** |
| Dianthus carthusianorum | 9.2 | 28.0 | ** |
| Lavandula angustifolia | 47.4 | 22.6 | ns |
| Primula vulgaris | 598.9 | 386.2 | ns |
| Rosa canina | 560.8 | 510.2 | * |
| Rosa pendulina | 1,737.5 | 1,772.8 | ns |
| Viola odorata | 286.7 | 49.2 | *** |
| Benzoic acids | |||
| Dianthus carthusianorum | 116.1 | 56.7 | *** |
| Flavanols | |||
| Centaurea cyanus | 219.3 | 270.7 | ** |
| Rosa pendulina | 132.4 | 288.3 | * |
| Viola odorata | 833.8 | 294.4 | *** |
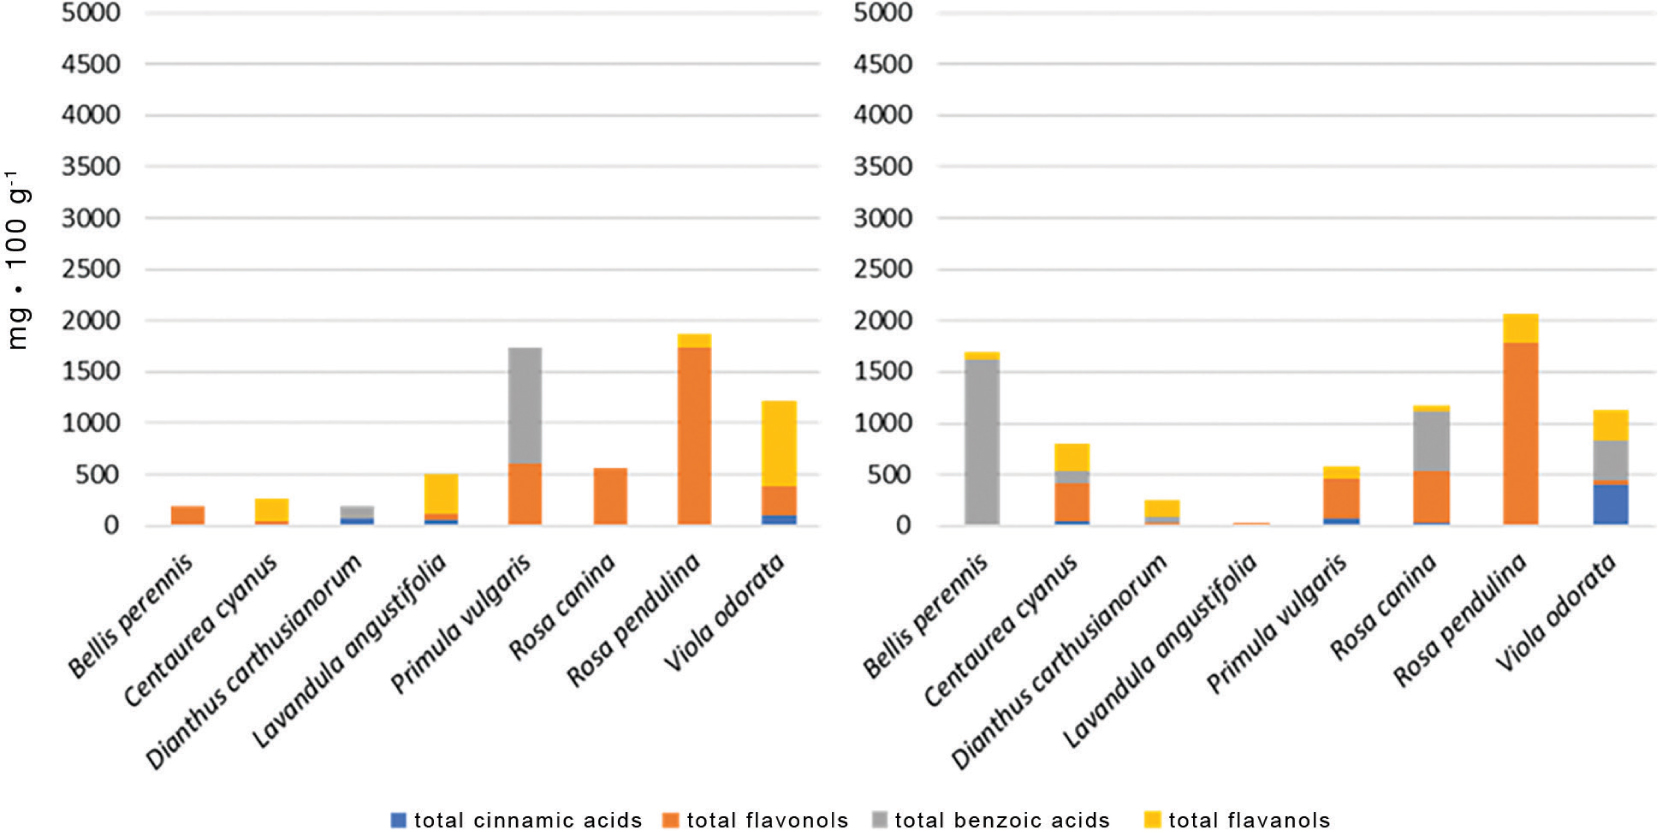
Figure 9.
Distribution of different phenolic classes (cinnamic acids, flavonols, benzoic acid, and flavanols) in extracts (UAE) after HD (left) and CD (right). CD, cold drying; HD, hot drying.
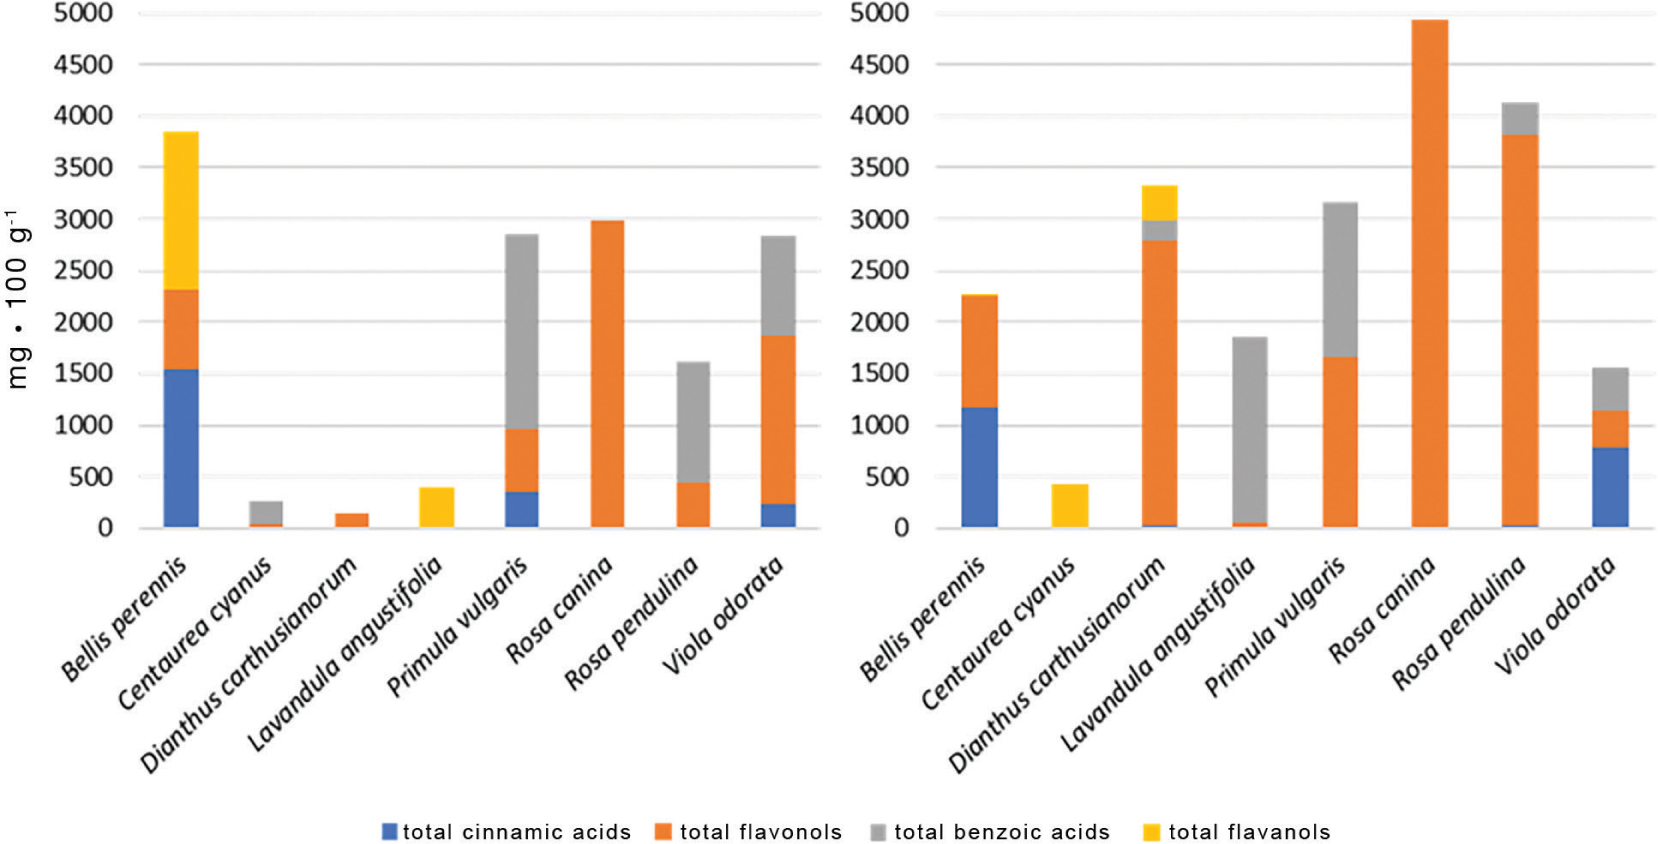
Figure 10.
Distribution of different phenolic classes (cinnamic acids, flavonols, benzoic acids and flavanols) in DEC after HD (left), and CD (right). CD, cold drying; DEC, decoctions; HD, hot drying.
Table 4.
Effects of HD and CD in the yield of phenolic compounds (mg · 100 g-1) in edible flower DEC.
| HD | CD | Sign. | |
|---|---|---|---|
| Cinnamic acids | |||
| Bellis perennis | 1,548.8 | 1,172.9 | ** |
| Viola odorata | 238.8 | 790.9 | *** |
| Flavonols | |||
| Bellis perennis | 768.2 | 1,081.8 | * |
| Dianthus carthusianorum | 150.0 | 2,762.4 | *** |
| Primula vulgaris | 609.4 | 1,663.7 | *** |
| Rosa canina | 2,987.0 | 4,939.6 | * |
| Rosa pendulina | 447.8 | 3,793.9 | *** |
| Viola odorata | 1,627.7 | 354.1 | *** |
| Benzoic acids | |||
| Primula vulgaris | 1,895.1 | 1,501.6 | * |
| Rosa pendulina | 1,176.6 | 314.5 | *** |
| Viola odorata | 965.4 | 412.3 | *** |
| Flavanols | |||
| Bellis perennis | 1,538.2 | 23.5 | *** |
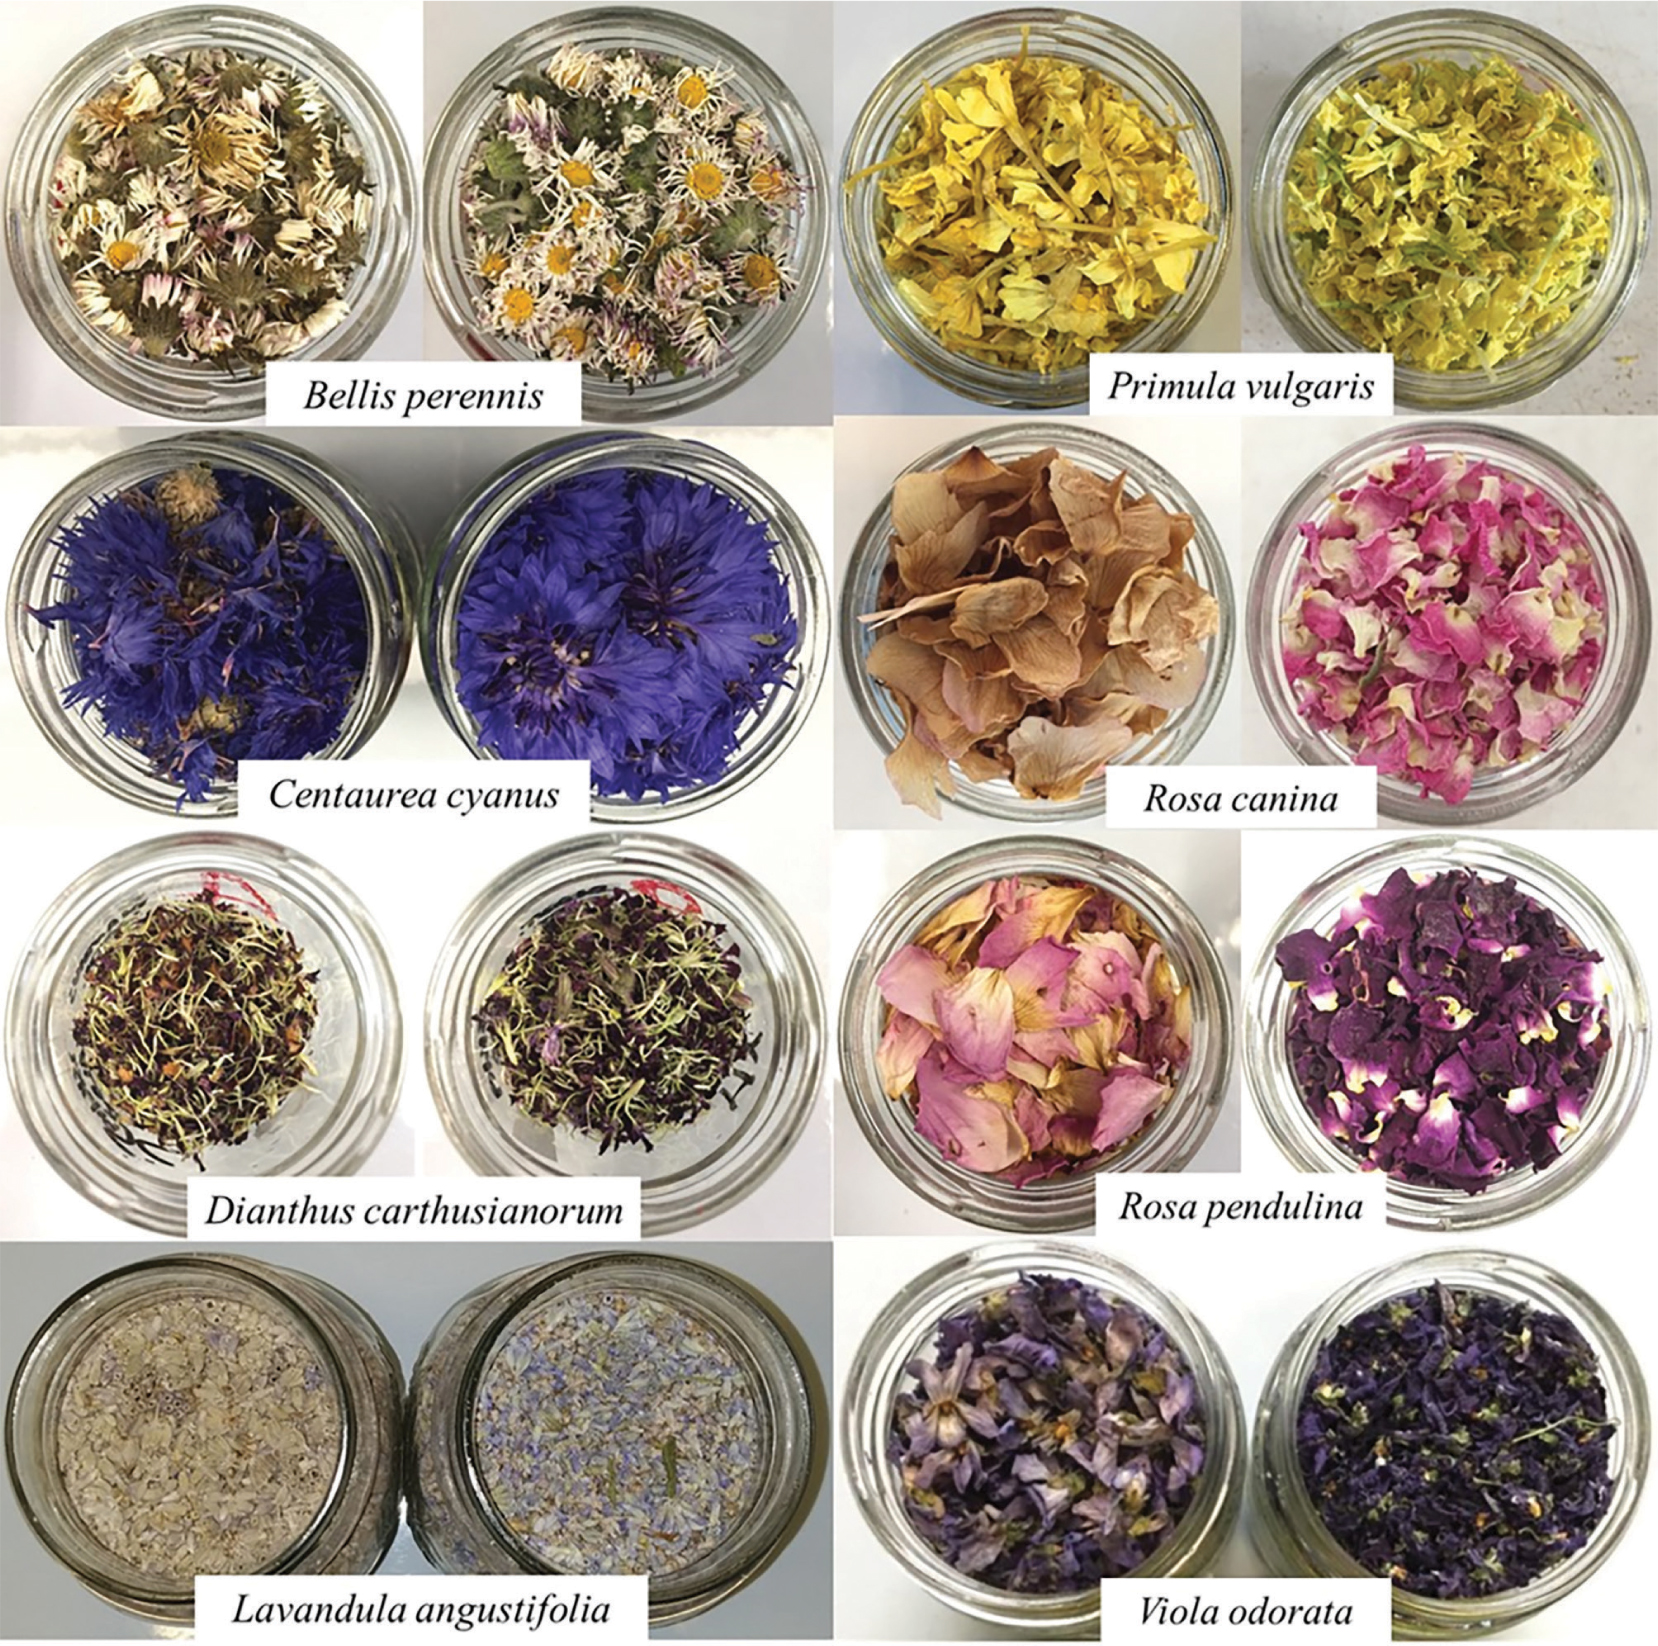
Figure 11.
Appearance of dry flowers of Bellis perennis, Centaurea cyanus, Dianthus carthusianorum, Lavandula angustifolia, Primula vulgaris, Rosa canina, Rosa pendulina and Viola odorata after 24 h of HD (left jar) and CD (right jar). CD, cold drying; HD, hot drying.