
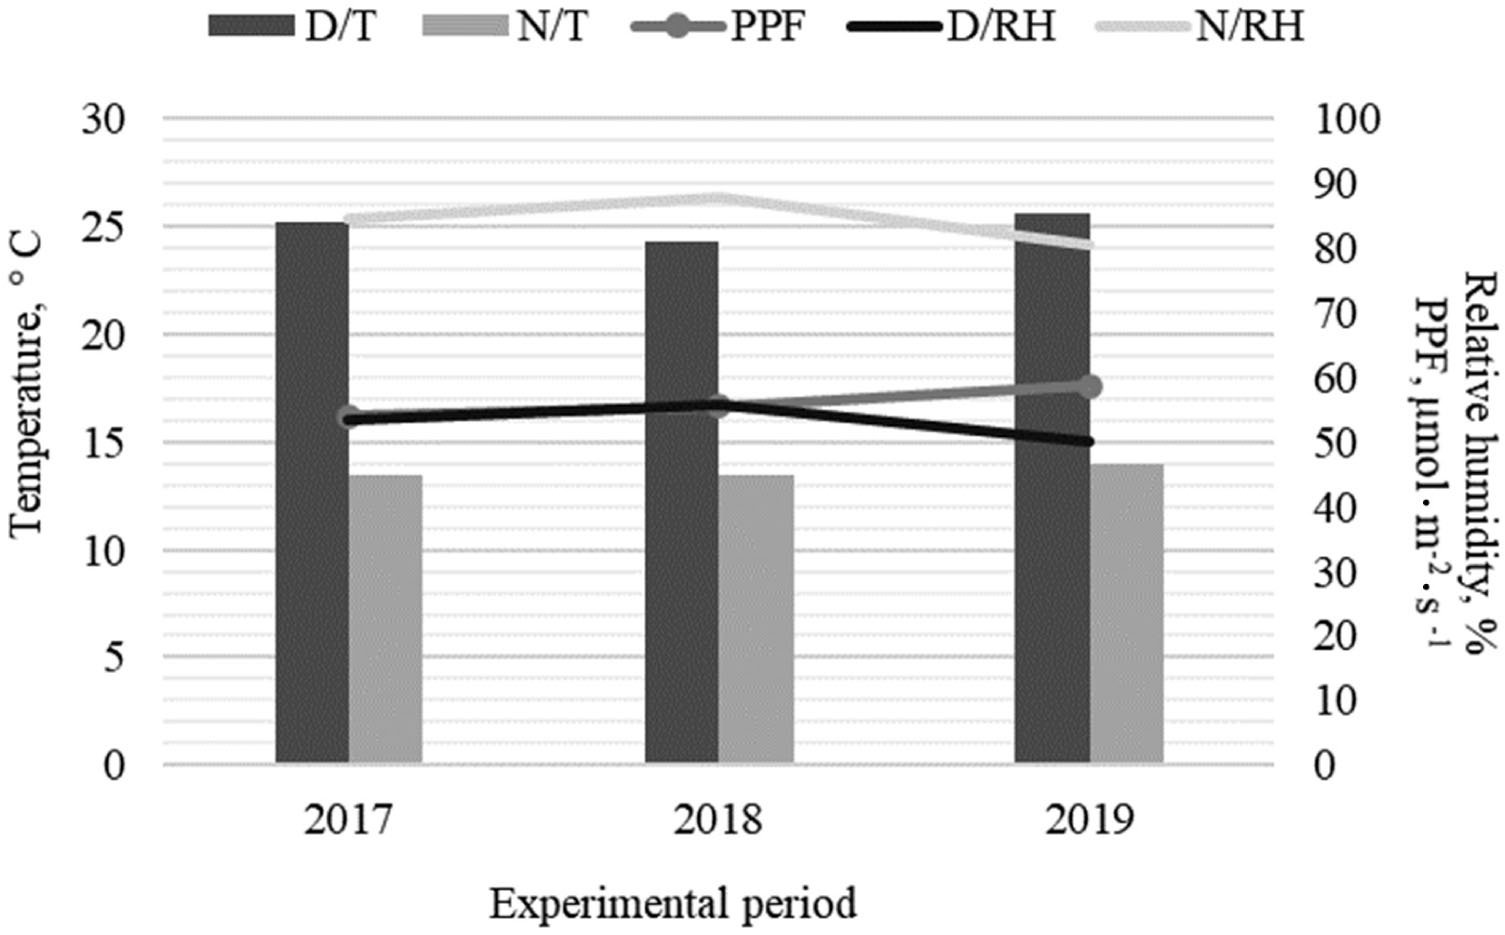
Figure 1
Average D/T and N/T;°C, percentage of D/RH and N/RH, and PPF; μmmol · m−2 · s−1, by experimental period (2017 to 2019). D/T, day-time temperature; D/RH, day-time relative humidity; N/T, nights temperatures; N/RH, night relative humidity; PPF, photosynthetic photon flux.
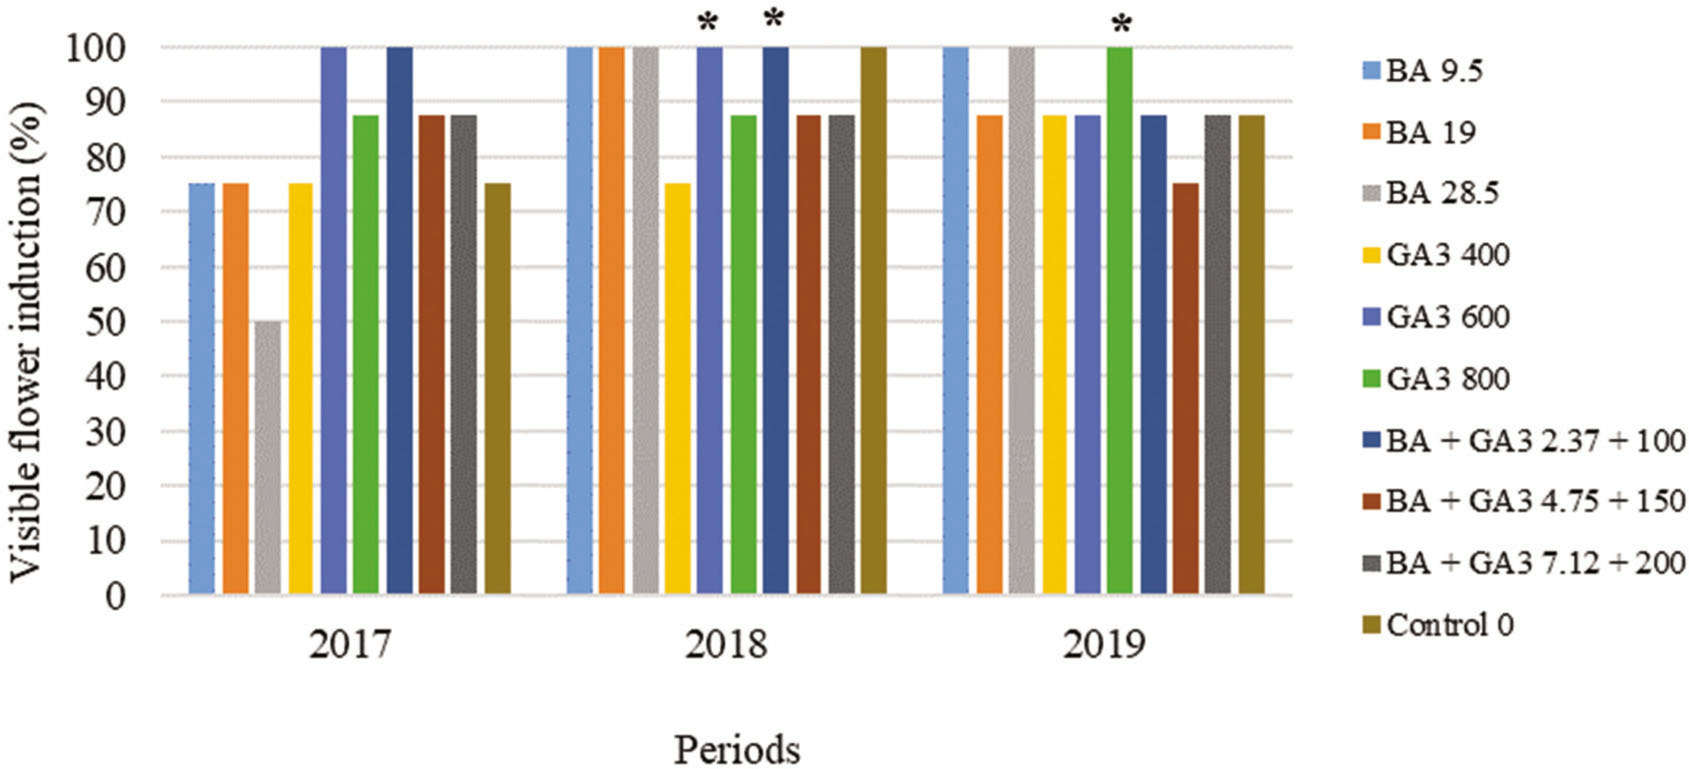
Figure 2
Percentage of visible floral induction of L. anceps in three experimental periods, by effect of different doses of BA and GA3. BA, 6-benzyladenine; GA3, gibberellic acid. *Indicates an abortion in treatment.
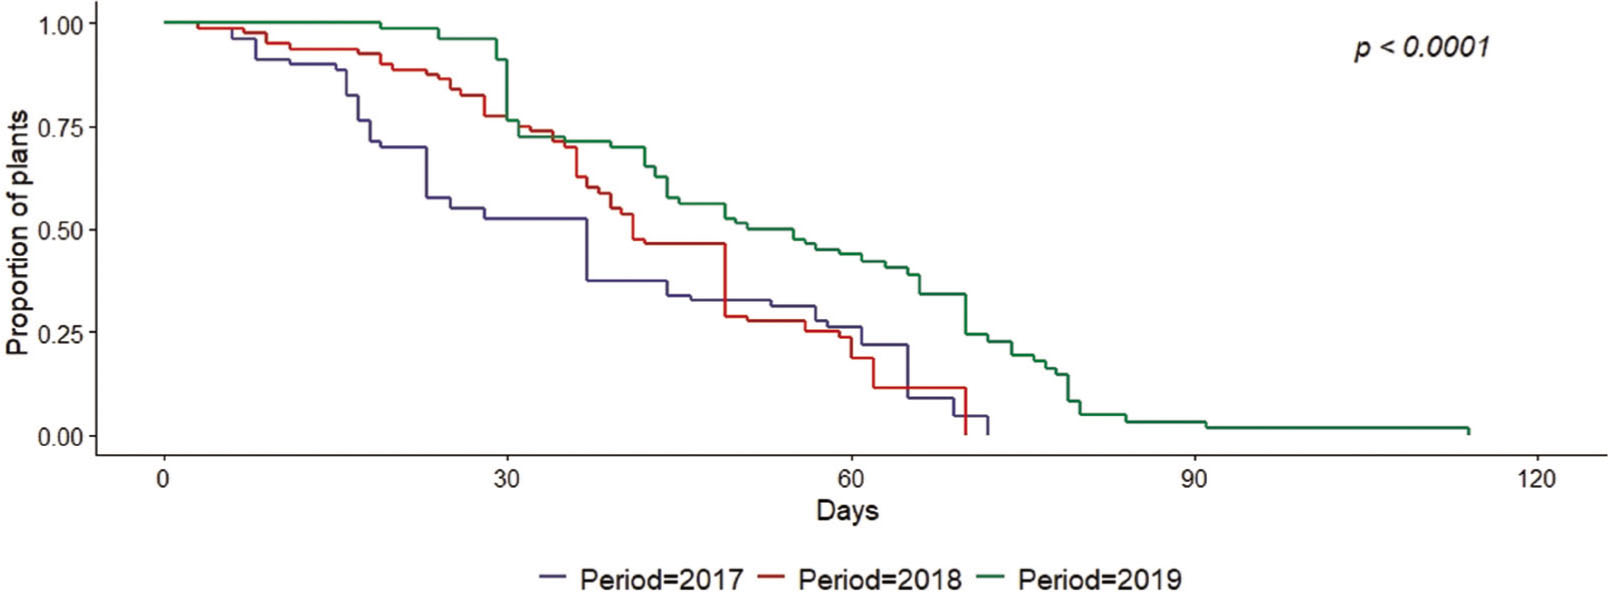
Figure 3
Survival curves represent the proportion of L. anceps plants induced to flowering per day, with the effect of different doses of PGRs: GA3 and BA, in three experimental periods. Differences in the survival curves are significant with the log-rank test (p ≤ 0.05). BA, 6-benzyladenine; GA3, gibberellic acid; PGRs, plant growth regulators.
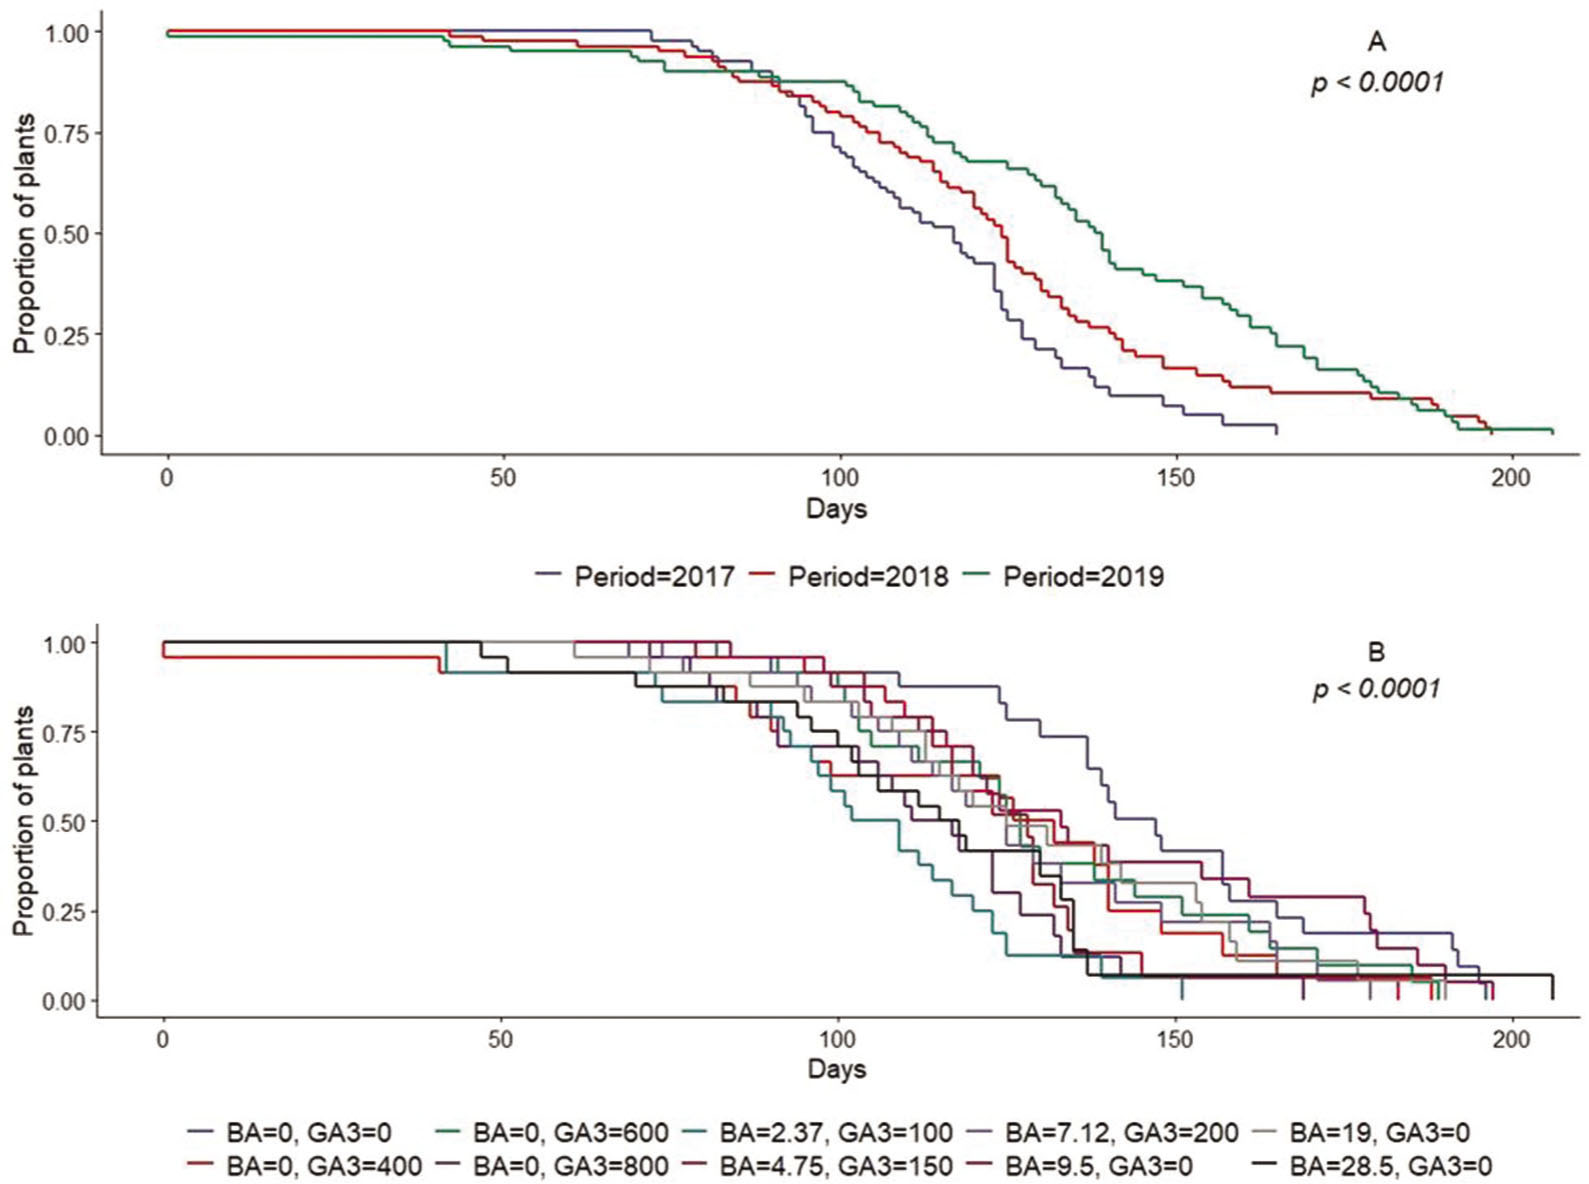
Figure 4
Survival curves represent the proportion of L. anceps plants that reached anthesis per day, in each experimental period (A), and by effect of treatments in the global analysis period (B), with the application of different doses of PGRs: GA3 and BA. Differences in the survival curves are significant with the log-rank test (p ≤ 0.05). BA, 6-benzyladenine; GA3, gibberellic acid; PGRs, plant growth regulators.
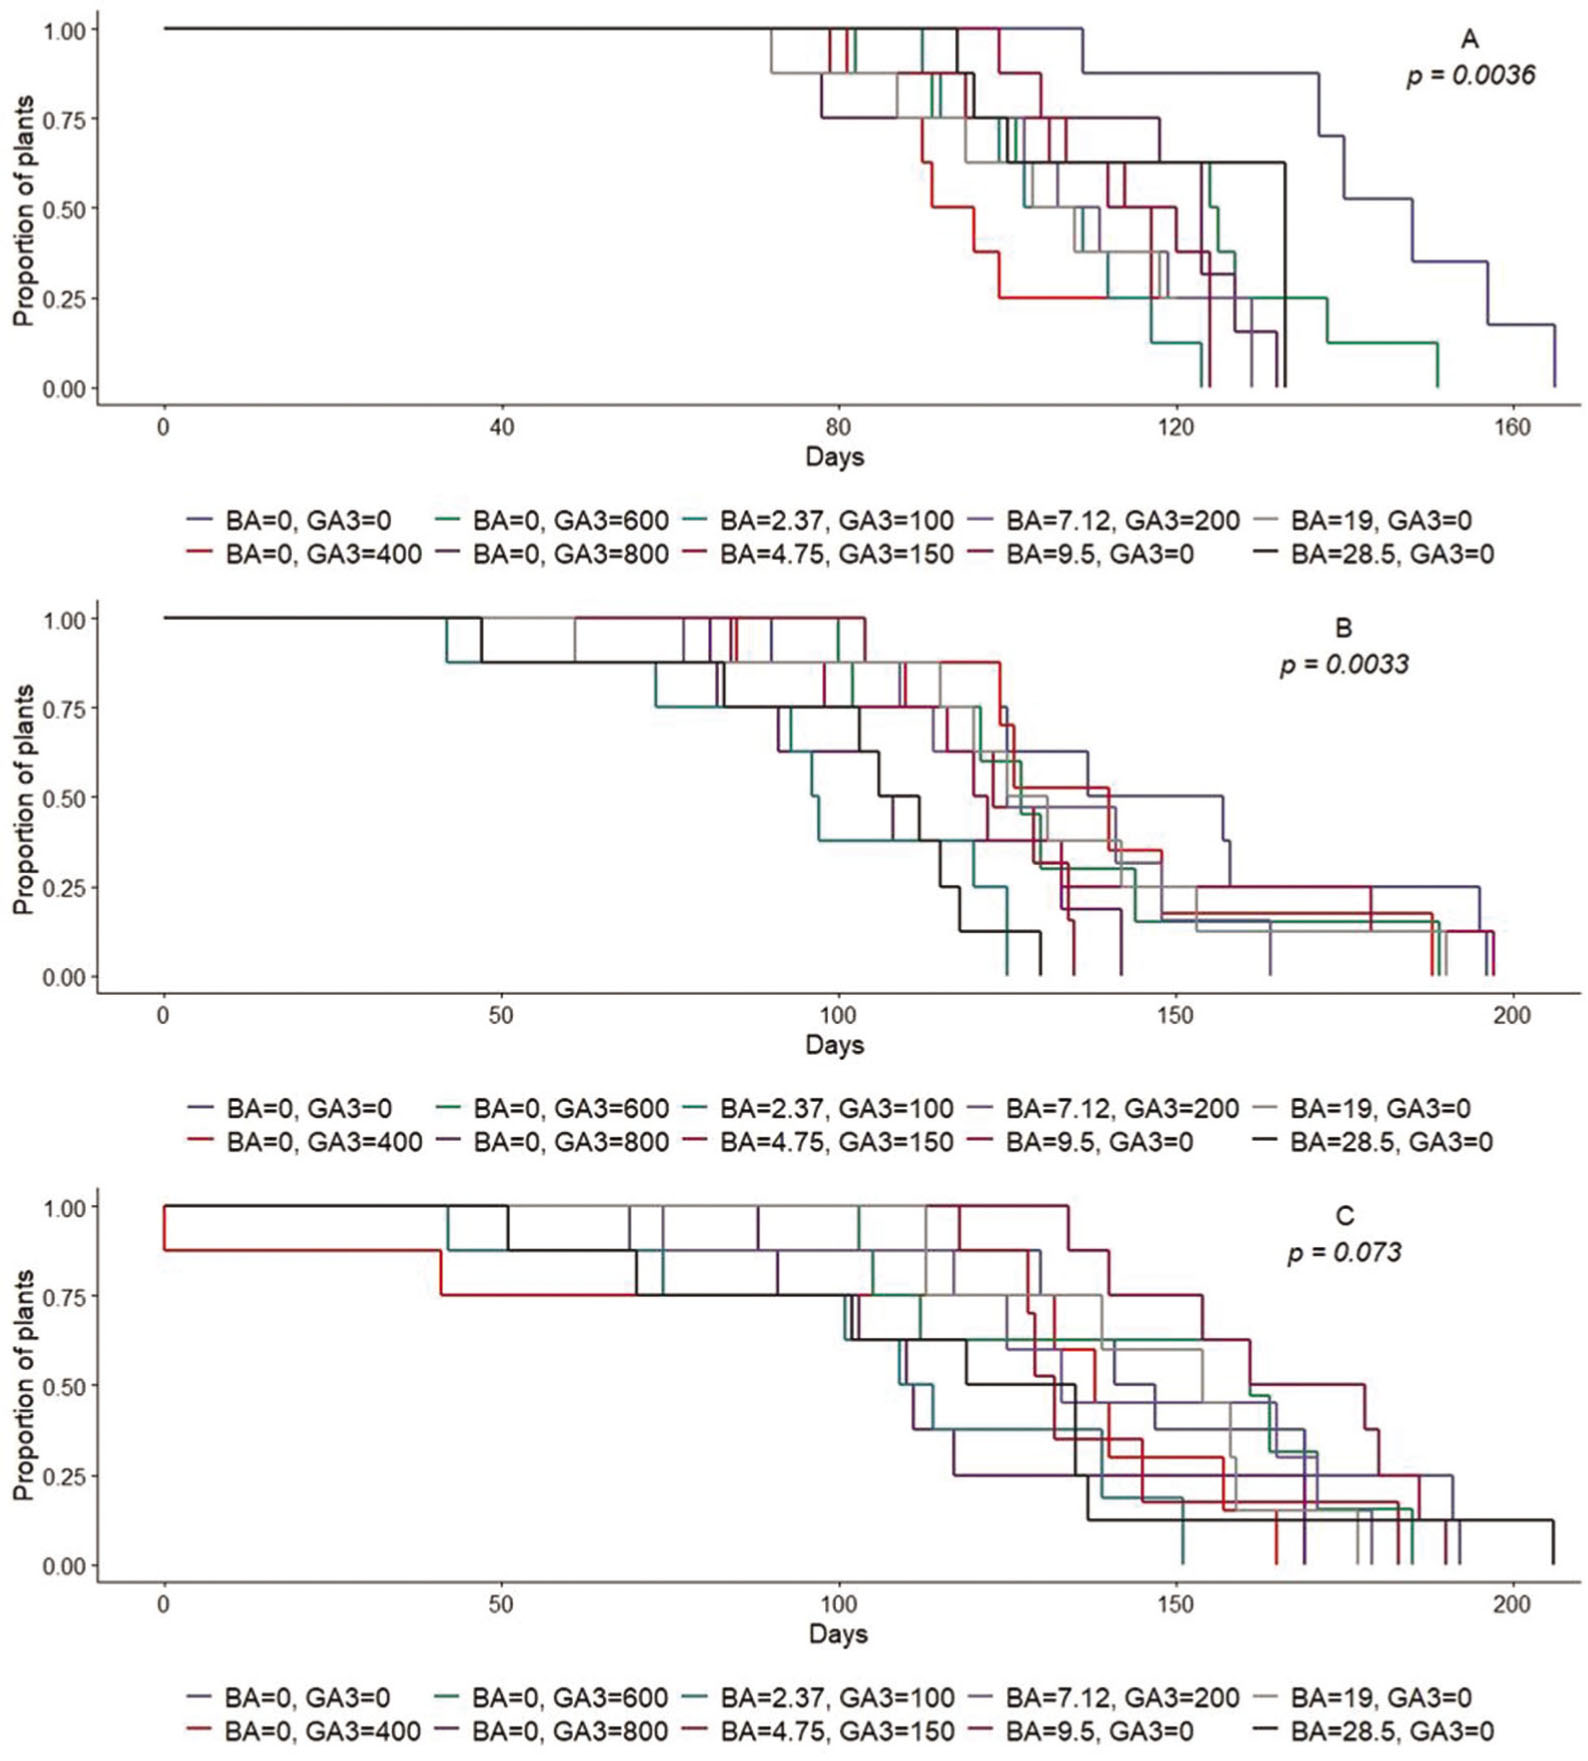
Figure 5
Survival curves represent the proportion of L. anceps plants that reached anthesis daily, in each experimental period: 2017 (A), 2018 (B) and 2019 (C), by the effect of different doses of PGRs: GA3 and BA. Differences in the survival curves are significant with the log-rank test (p ≤ 0.05). BA, 6-benzyladenine; GA3, gibberellic acid; PGRs, plant growth regulators.
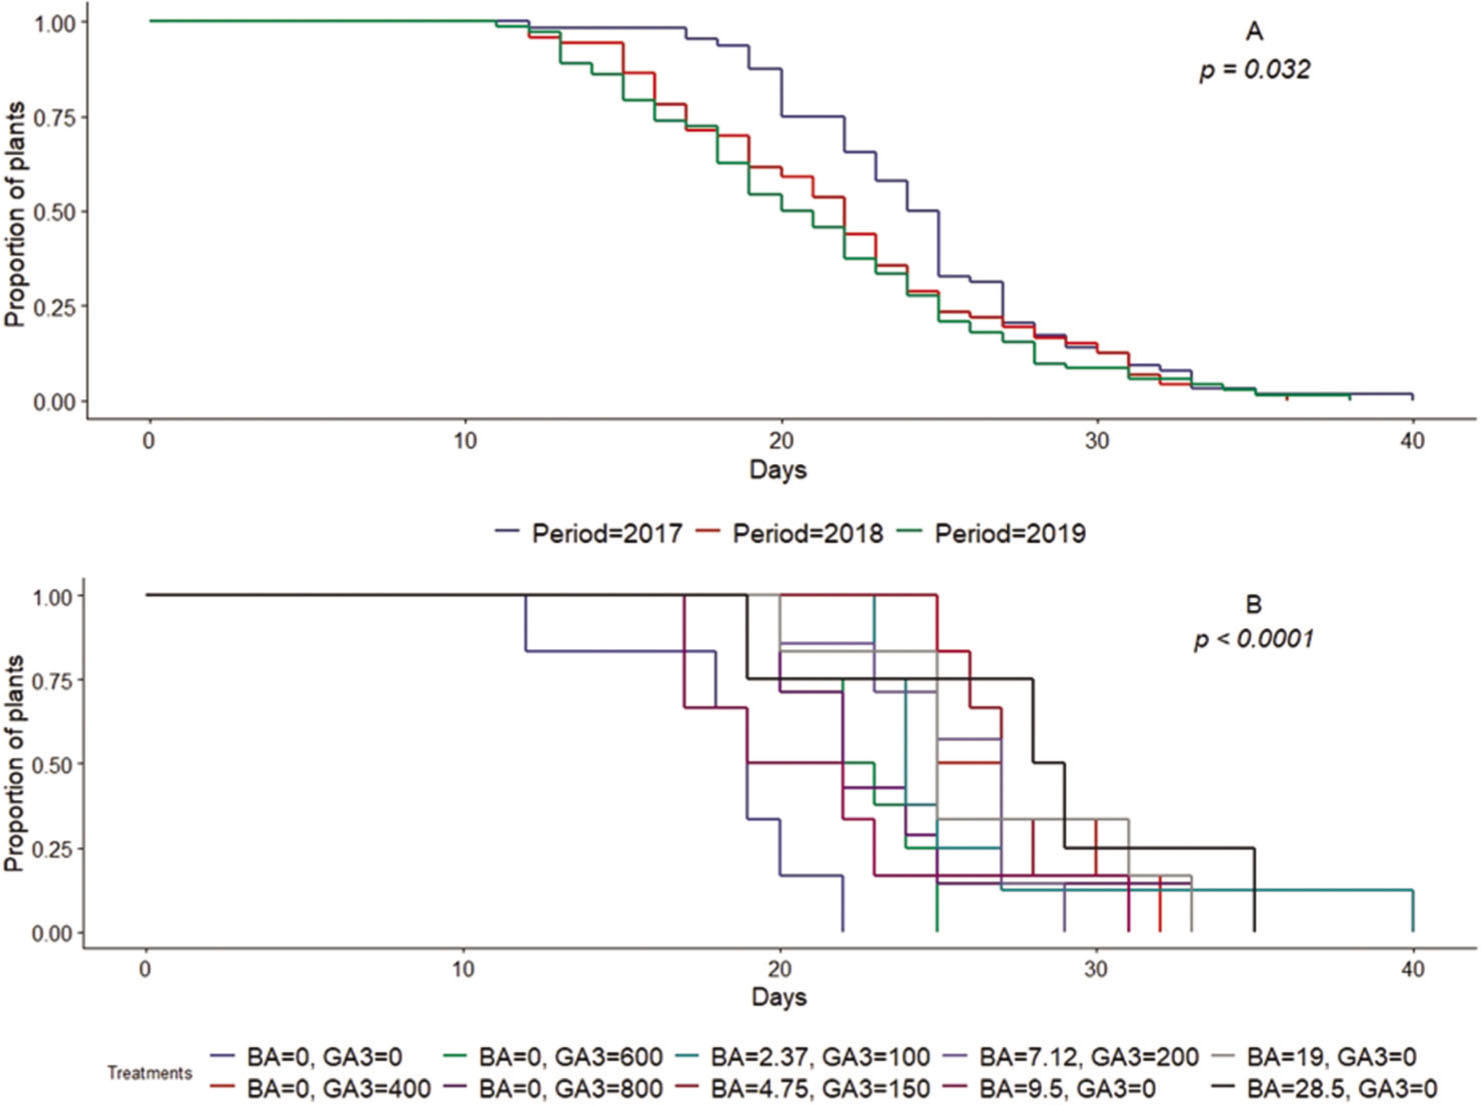
Figure 6
Survival curves represent the proportion of L. anceps plants with live flowers per day, in each experimental period (A), and by effect of treatments in the period 2017 (B), with the application of different doses of PGRs: GA3 and BA. Differences in the survival curves are significant with the log-rank test (p ≤ 0.05). BA, 6-benzyladenine; GA3, gibberellic acid; PGRs, plant growth regulators.
Table 1
Means of the effect of different doses of 6-benzyladenine and gibberellic acid on morpho-floral quality parameters of L. anceps, by experimental period.
| Experimental period | FL | NFS | NFR | SF/length | SF/width | FSL |
|---|---|---|---|---|---|---|
| 2017 | 24.55 a | 1.44 c | 2.09 a | 9.36 a | 7.81 a | 38.90 a |
| 2018 | 22.01 b | 2.22 a | 2.35 a | 9.07 ab | 7.20 b | 35.45 a |
| 2019 | 21.01 b | 1.77 b | 2.15 a | 8.80 b | 7.11 b | 35.71 a |
[i] Columns with different letters indicate statistical differences (Tukey, p ≤ 0.05).
[ii] FL, flower life; FSL, flower stem length; NFR, number of flowers per raceme; NFS, number of flowers stem; SF/LENGTH, size of flower/length; SF/WIDTH, size of flower/width.
Table 2
Means of morpho-floral quality parameters between one experimental period and the next, by the application of different doses of BA (mg · L−1) and GA3 (mg · L−1) in L. anceps.
| PGRs | Doses | Flower life | Number of flowers stem | Length of flower | Width of flower | ||||||||
|---|---|---|---|---|---|---|---|---|---|---|---|---|---|
| 2017 | 2018 | 2019 | 2017 | 2018 | 2019 | 2017 | 2018 | 2019 | 2017 | 2018 | 2019 | ||
| BA | 9.5 | 21.50 a | 24.75 a | 25.00 a | 1.17 a | 1.75 a | 1.88 a | 7.82 a | 9.13 a | 8.73 a | 8.28 a | 7.35 a | 6.98 a |
| 19.0 | 26.06 a | 22.25 a | 24.25 a | 1.32 b | 2.38 a | 1.91 ab | 8.57 a | 9.48 a | 9.41 a | 9.03 a | 7.56 b | 6.93 b | |
| 28.5 | 25.31 a | 21.25 a | 19.88 a | 0.94 b | 2.00 a | 2.13 a | 11.05 a | 8.45 b | 8.46 b | 8.75 a | 7.56 ab | 6.85 b | |
| GA3 | 400 | 26.14 a | 25.31 ab | 18.86 b | 1.99 a | 1.82 a | 1.57 a | 10.13 a | 9.93 a | 9.39 a | 7.62 a | 7.85 a | 7.46 a |
| 600 | 22.63 a | 20.57 a | 20.00 a | 1.25 b | 2.52 a | 1.82 b | 9.80 a | 9.47 a | 8.78 a | 7.83 a | 7.65 a | 7.59 a | |
| 800 | 23.71 ab | 25.57 a | 19.57 b | 1.43 a | 1.86 a | 1.71 a | 8.91 ab | 8.21 b | 9.34 a | 6.69 a | 6.83 a | 7.04 a | |
| BA + GA3 | 2.37 + 100 | 26.25 a | 19.15 b | 18.35 b | 1.88 b | 3.02 a | 2.02 b | 9.55 a | 8.80 a | 8.13 a | 7.15 a | 6.61 a | 6.44 a |
| 4.75 + 150 | 27.67 a | 20.29 a | 21.17 a | 1.49 b | 3.23 a | 1.87 ab | 9.85 a | 8.21 a | 9.52 a | 8.32 a | 6.78 b | 8.09 ab | |
| 7.12 + 200 | 25.43 a | 20.86 a | 20.57 a | 1.71 a | 2.14 a | 1.29 a | 10.16 a | 8.81 a | 8.43 a | 7.64 a | 6.37 a | 6.99 a | |
| Control | 0.0 | 18.33 a | 19.88 a | 21.75 a | 1.32 a | 1.50 a | 1.50 a | 7.90 b | 10.2 a | 7.91 b | 6.77 a | 7.40 a | 6.74 a |
[i] Different letters per row for each variable are significantly different (Tukey, p ≤ 0.05).
[ii] BA, 6-benzyladenine; GA3, gibberellic acid; PGRs, plant growth regulators.