
Table 1
Characteristic of light spectra of lamps used for experiment with cucumber ‘Pacto’ F1 cultivation.
| Lamp type | Light spectrum | Red to blue ratio in light spectrum (R/B) |
|---|---|---|
| LED for interlighting | 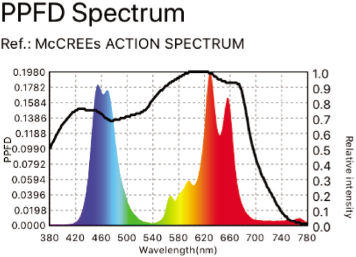 | 3.61 |
| HPS | 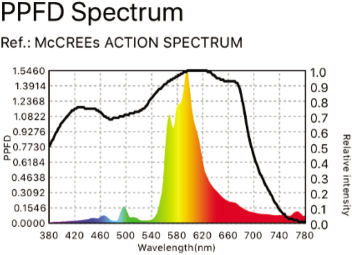 | 7.22 |
| LED COB + red | 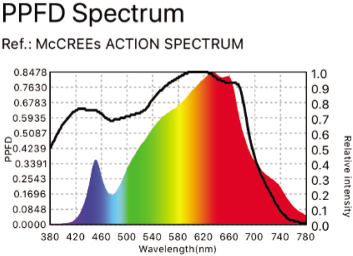 | 4.60 |
| LED COB white | 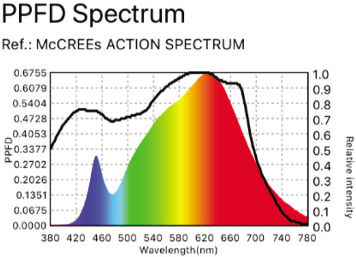 | 4.11 |
| LED COB + blue | 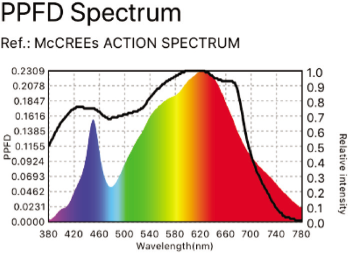 | 2.66 |
[i] COB, chips on board; HPS, high-pressure sodium; LED, light emitting diode; PPFD, Photosynthetic Photon Flux Density.
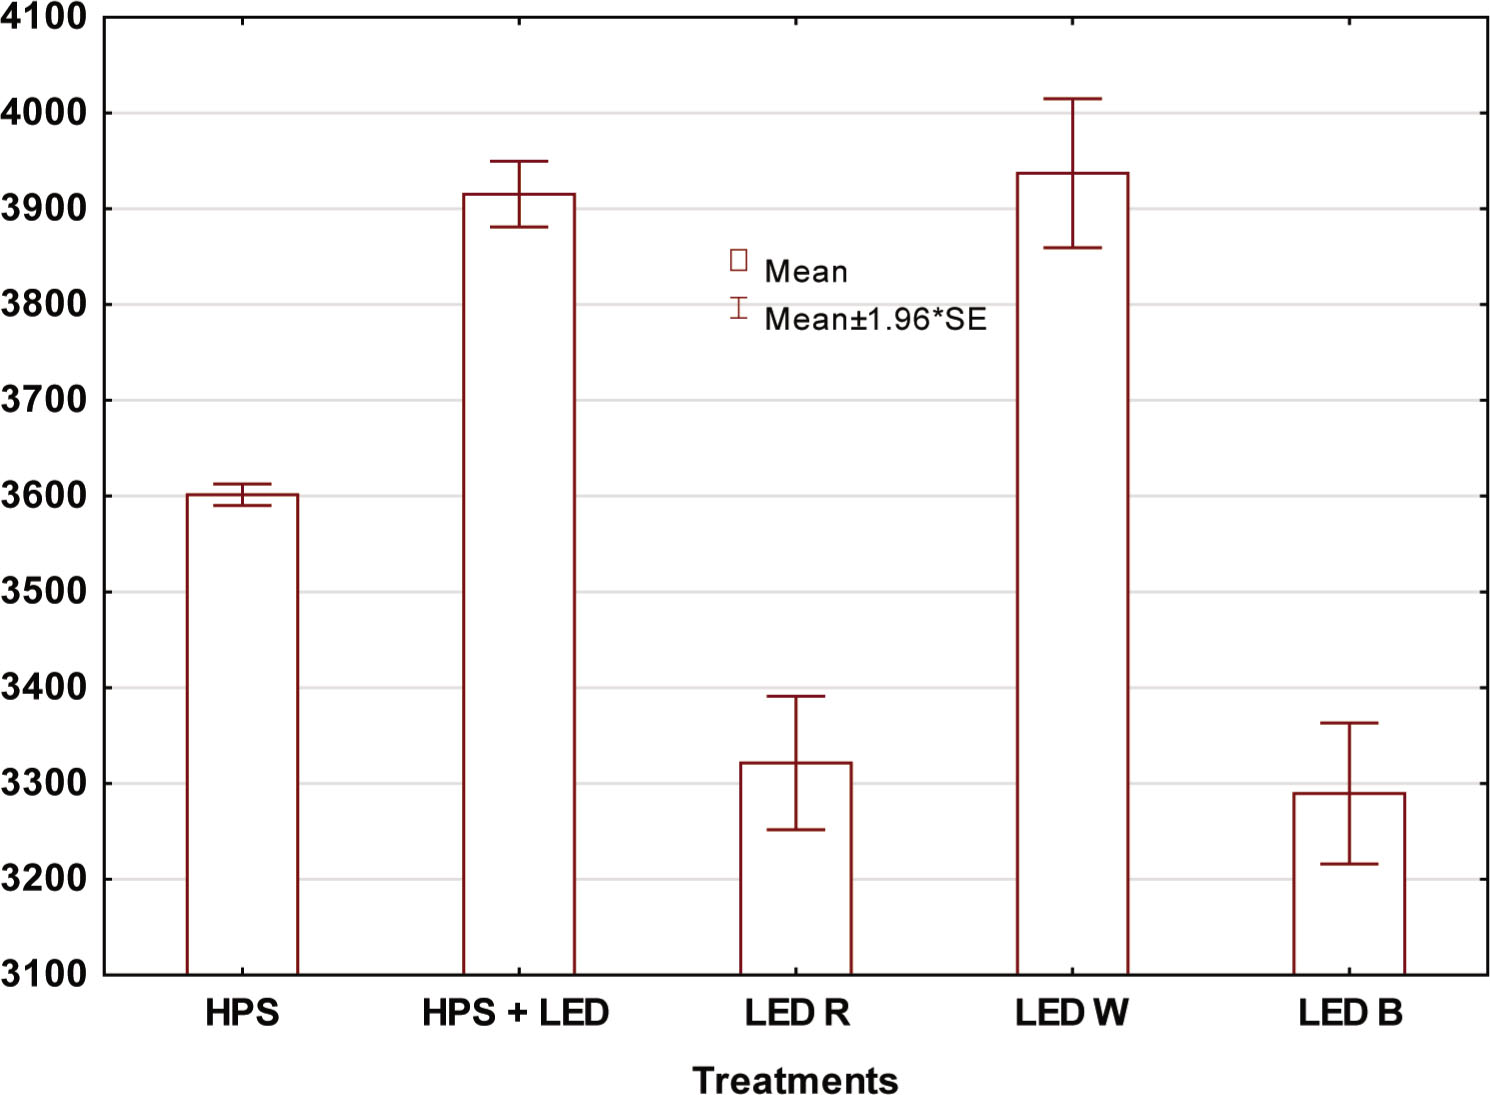
Figure 1
Total fruit yield of cucumber ‘Pacto’ F1 (g · plant−1) during 8 weeks of cropping. HPS, high-pressure sodium; LED, light emitting diode; SE, standard error.
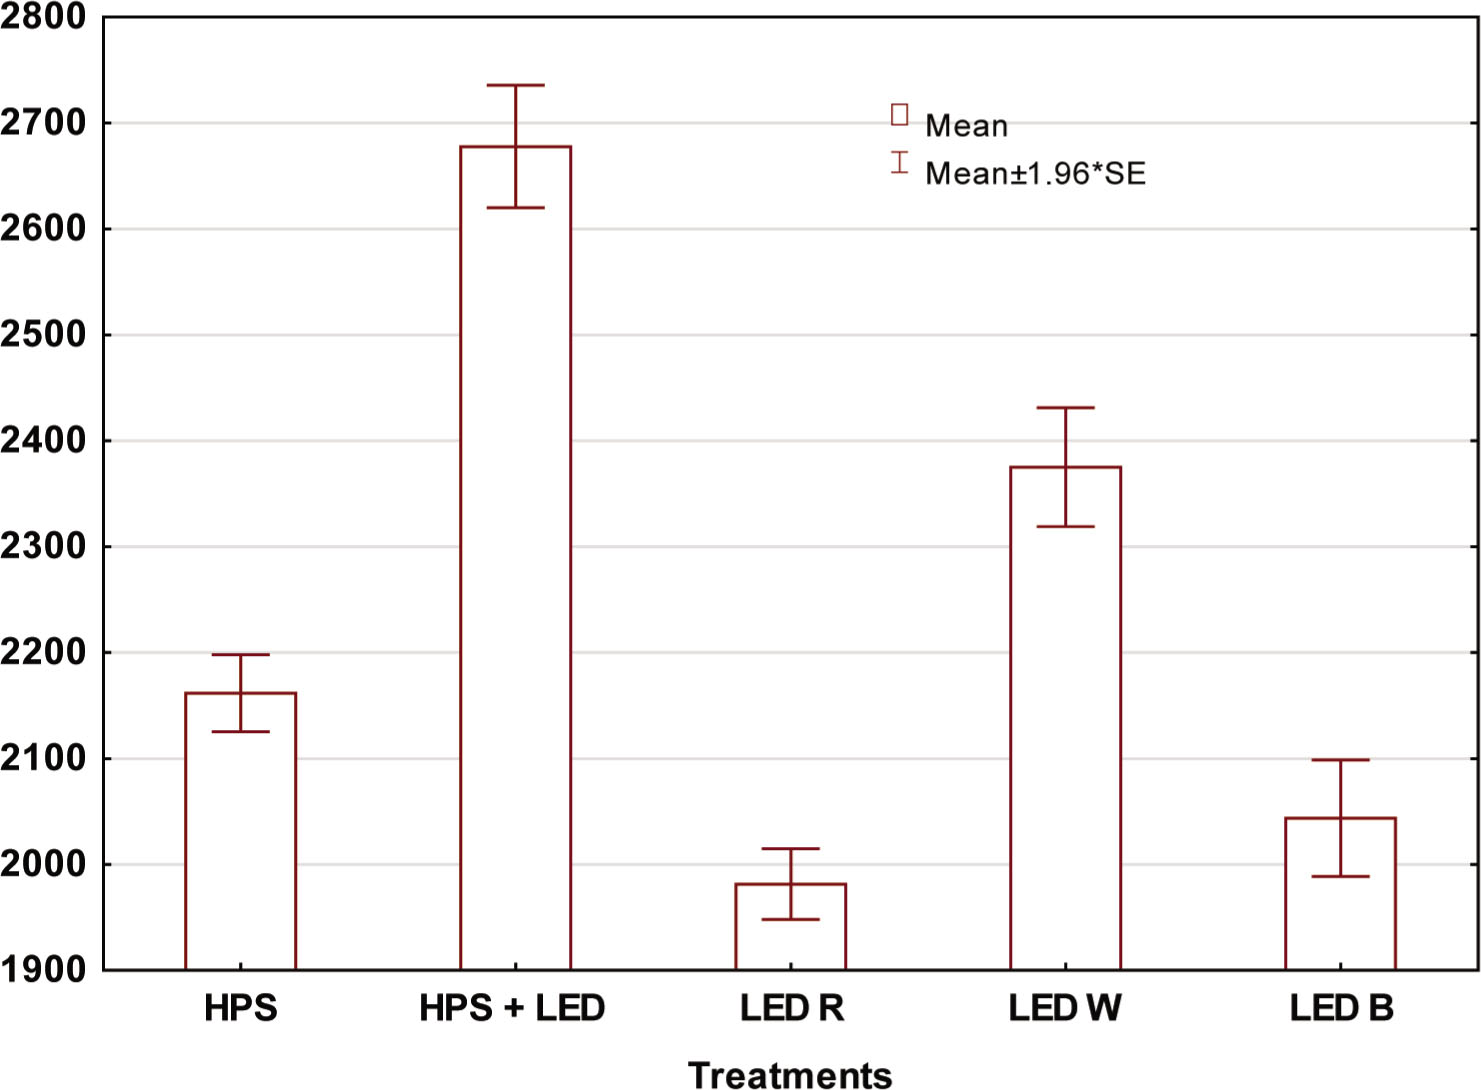
Figure 2
Fruit yield (length >20 cm) (g · plant−1) of cucumber ‘Pacto’ F1 during 8 weeks of cropping. HPS, high-pressure sodium; LED, light emitting diode; SE, standard error.
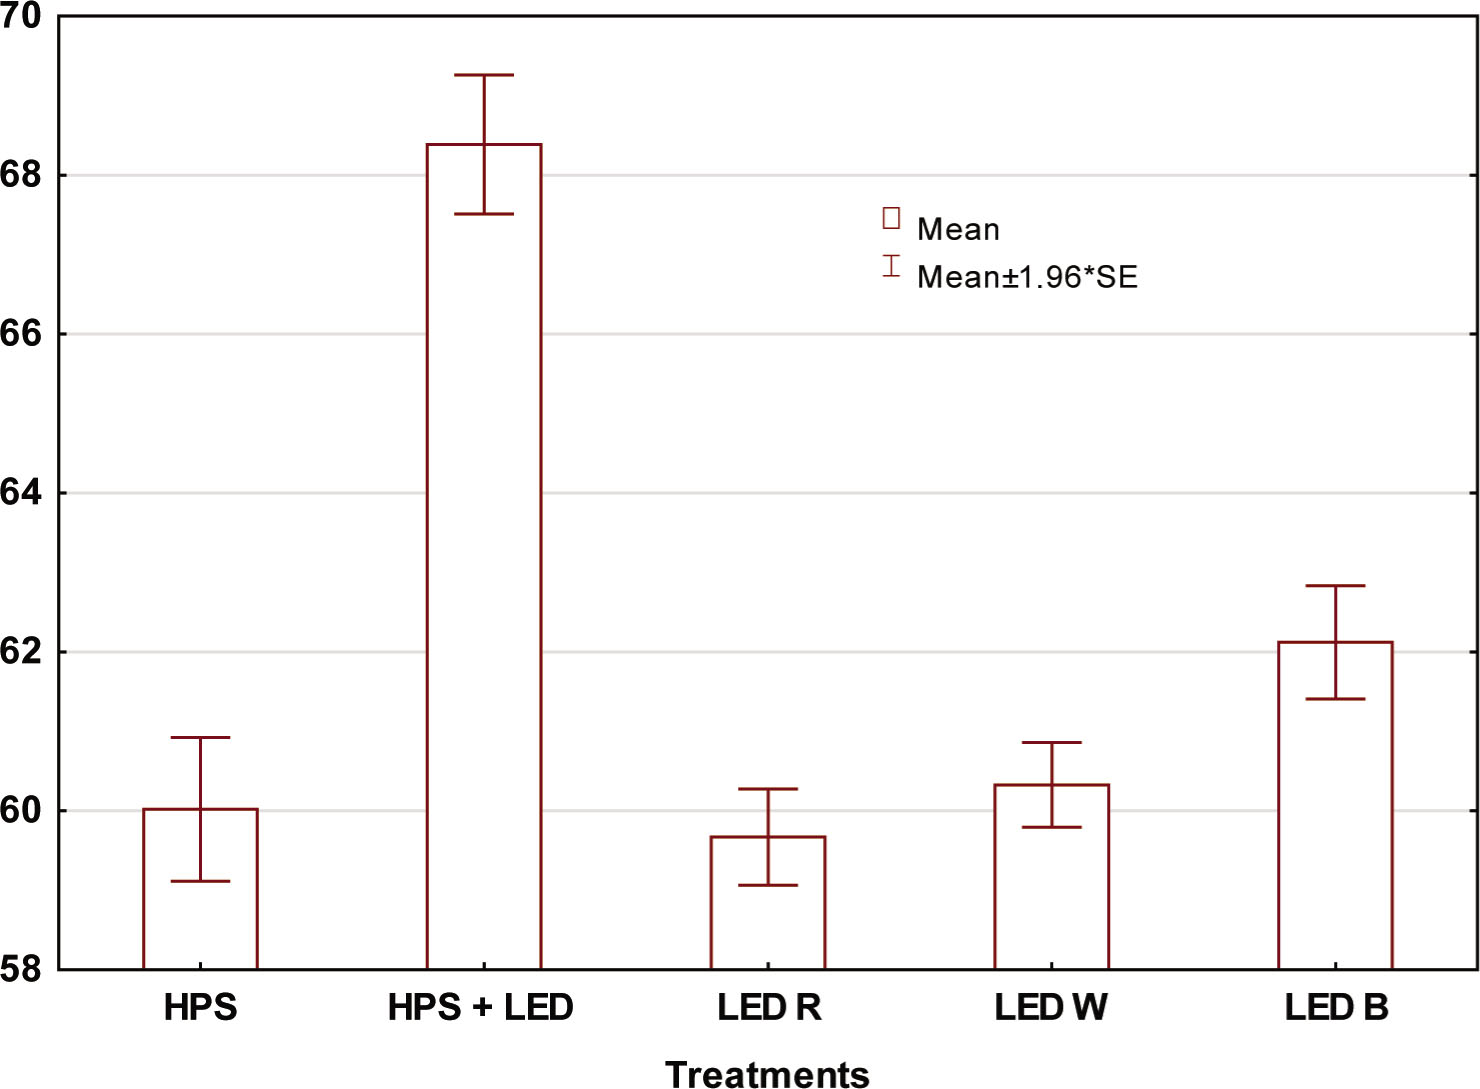
Figure 3
Percentage of fruits longer than 20 cm in the total yield of cucumber ‘Pacto’ F1 during 8 weeks of cropping. HPS, high-pressure sodium; LED, light emitting diode; SE, standard error.
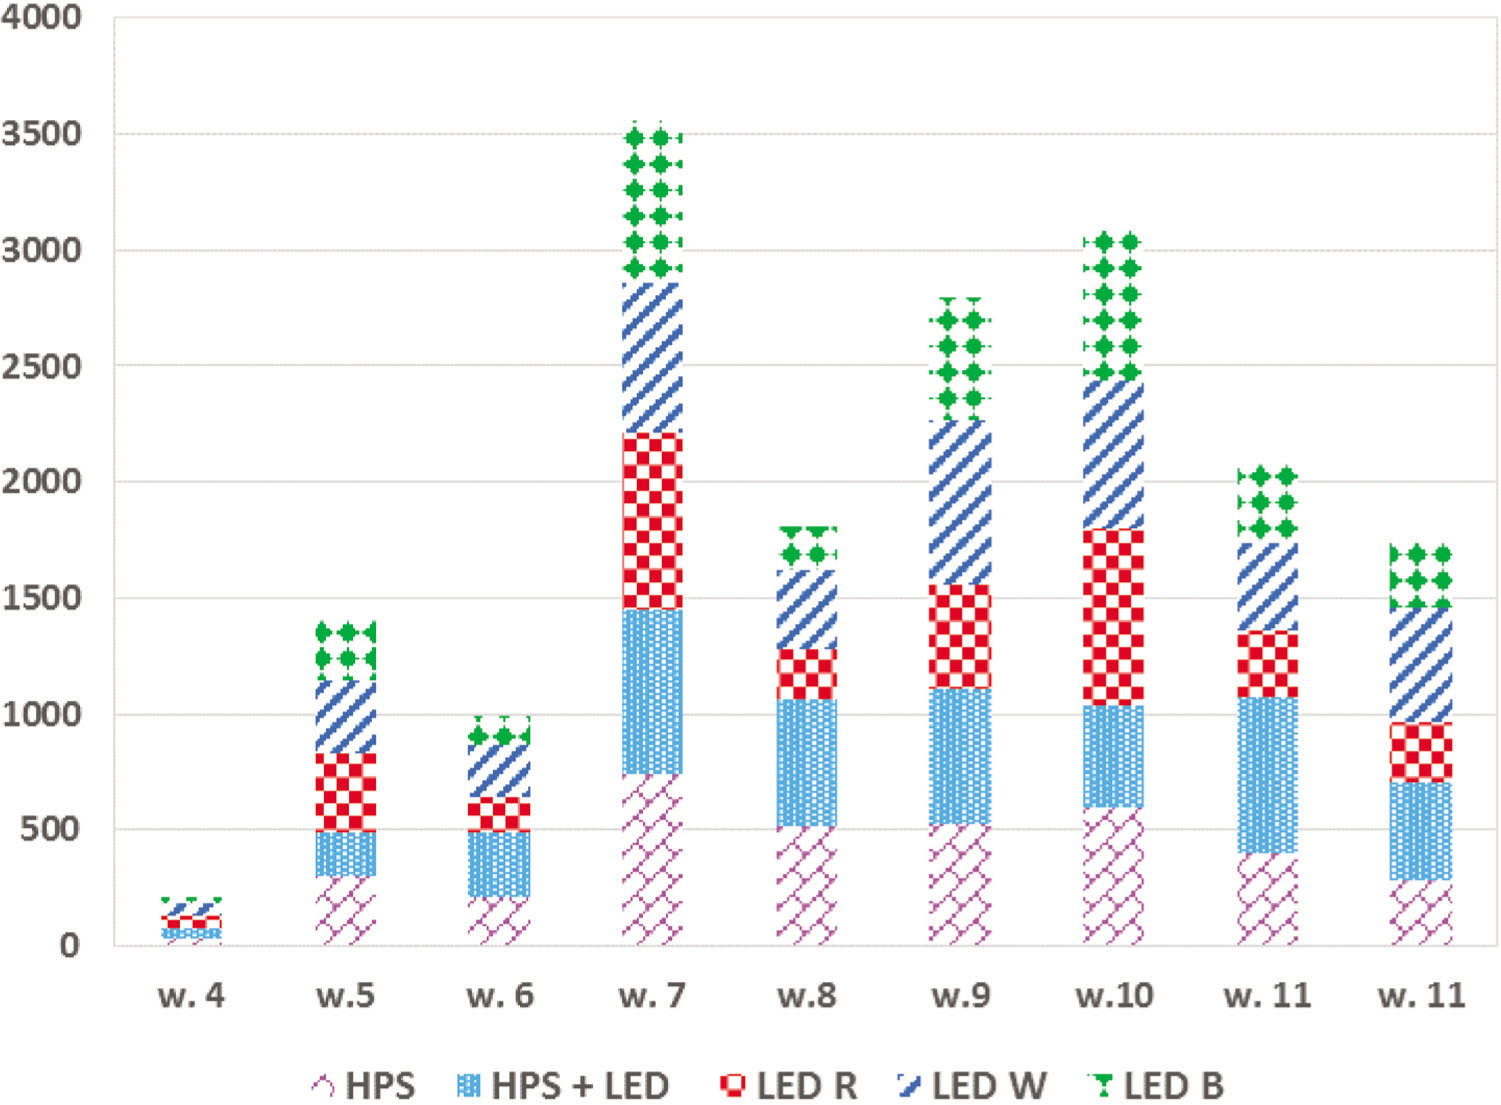
Figure 4
Weekly yield (weeks counted from the first week of January) of cucumber ‘Pacto’ F1 (g · plant−1) in relation to light treatments. HPS, high-pressure sodium; LED, light emitting diode.
Table 2
The content of vitamin C and TSS evaluated at two dates of measurements: I – 7 March and II – 14 March.
| Date of measurement | Light treatment | Vitamin C | TSS | ||
|---|---|---|---|---|---|
| mg · 100 g−1 FM | SD | °Brix | SD | ||
| 7 March | I – HPS + LED | 2.20 | 0.29 | 3.37 | 0.12 |
| II – HPS | 1.44 | 0.18 | 3.13 | 0.05 | |
| III – LED R | 1.63 | 0.22 | 3.33 | 0.17 | |
| IV – LED W | 1.68 | 0.18 | 3.20 | 0.14 | |
| V – LED B | 1.59 | 0.14 | 3.37 | 0.05 | |
| 14 March | I – HPS + LED | 2.85 | 0.01 | 3.13 | 0.05 |
| II – HPS | 2.00 | 0.15 | 3.03 | 0.05 | |
| III – LED R | 1.78 | 0.24 | 3.10 | 0.00 | |
| IV – LED W | 1.90 | 0.26 | 3.03 | 0.05 | |
| V – LED B | 2.27 | 0.03 | 2.97 | 0.05 | |
[i] HPS, high-pressure sodium; LED, light emitting diode; SD, standard deviation; TSS, total soluble salts.