
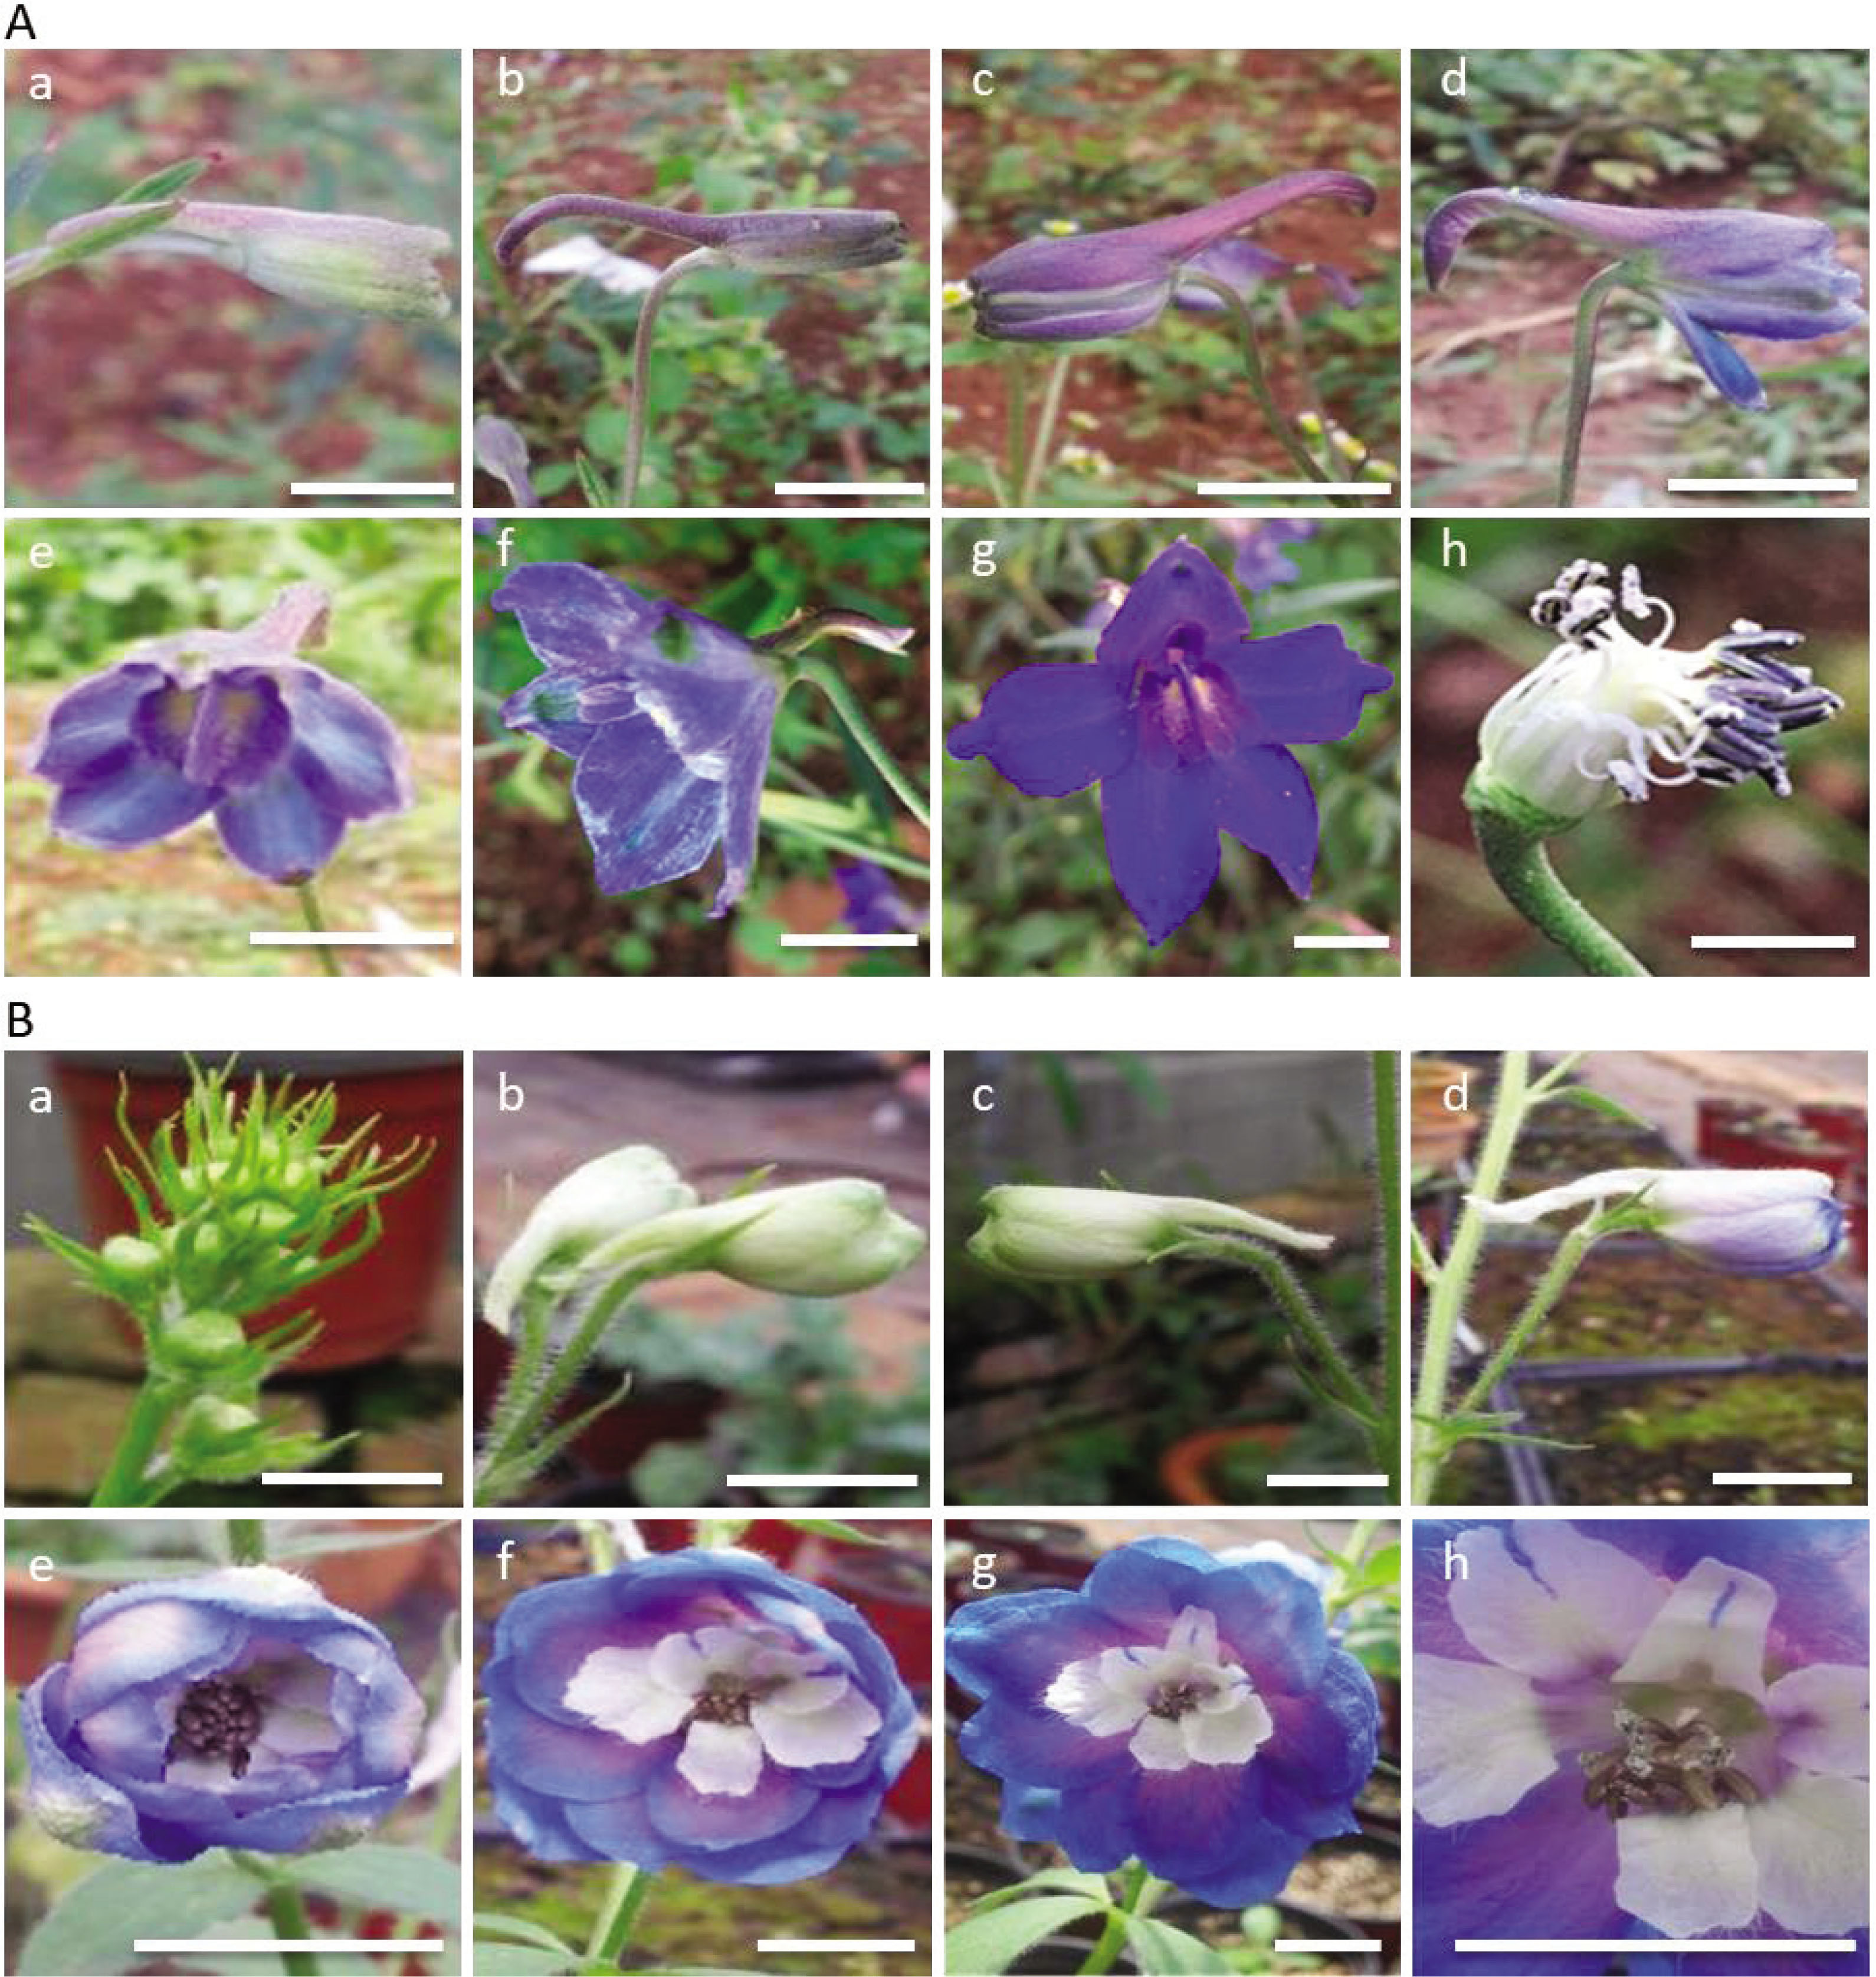
Figure 1
Stages of flower development of D. yunnanense (A) and D. elatum ‘Guardian Blue’ (B). Bud stage (a), stem elongation stage (b), bud expansion stage (c), sepal open stage (d), petal open stage (e), flower semi-open stage (f), flower full-open stage (g) and anther cracked stage (h). Bar = 1 cm.
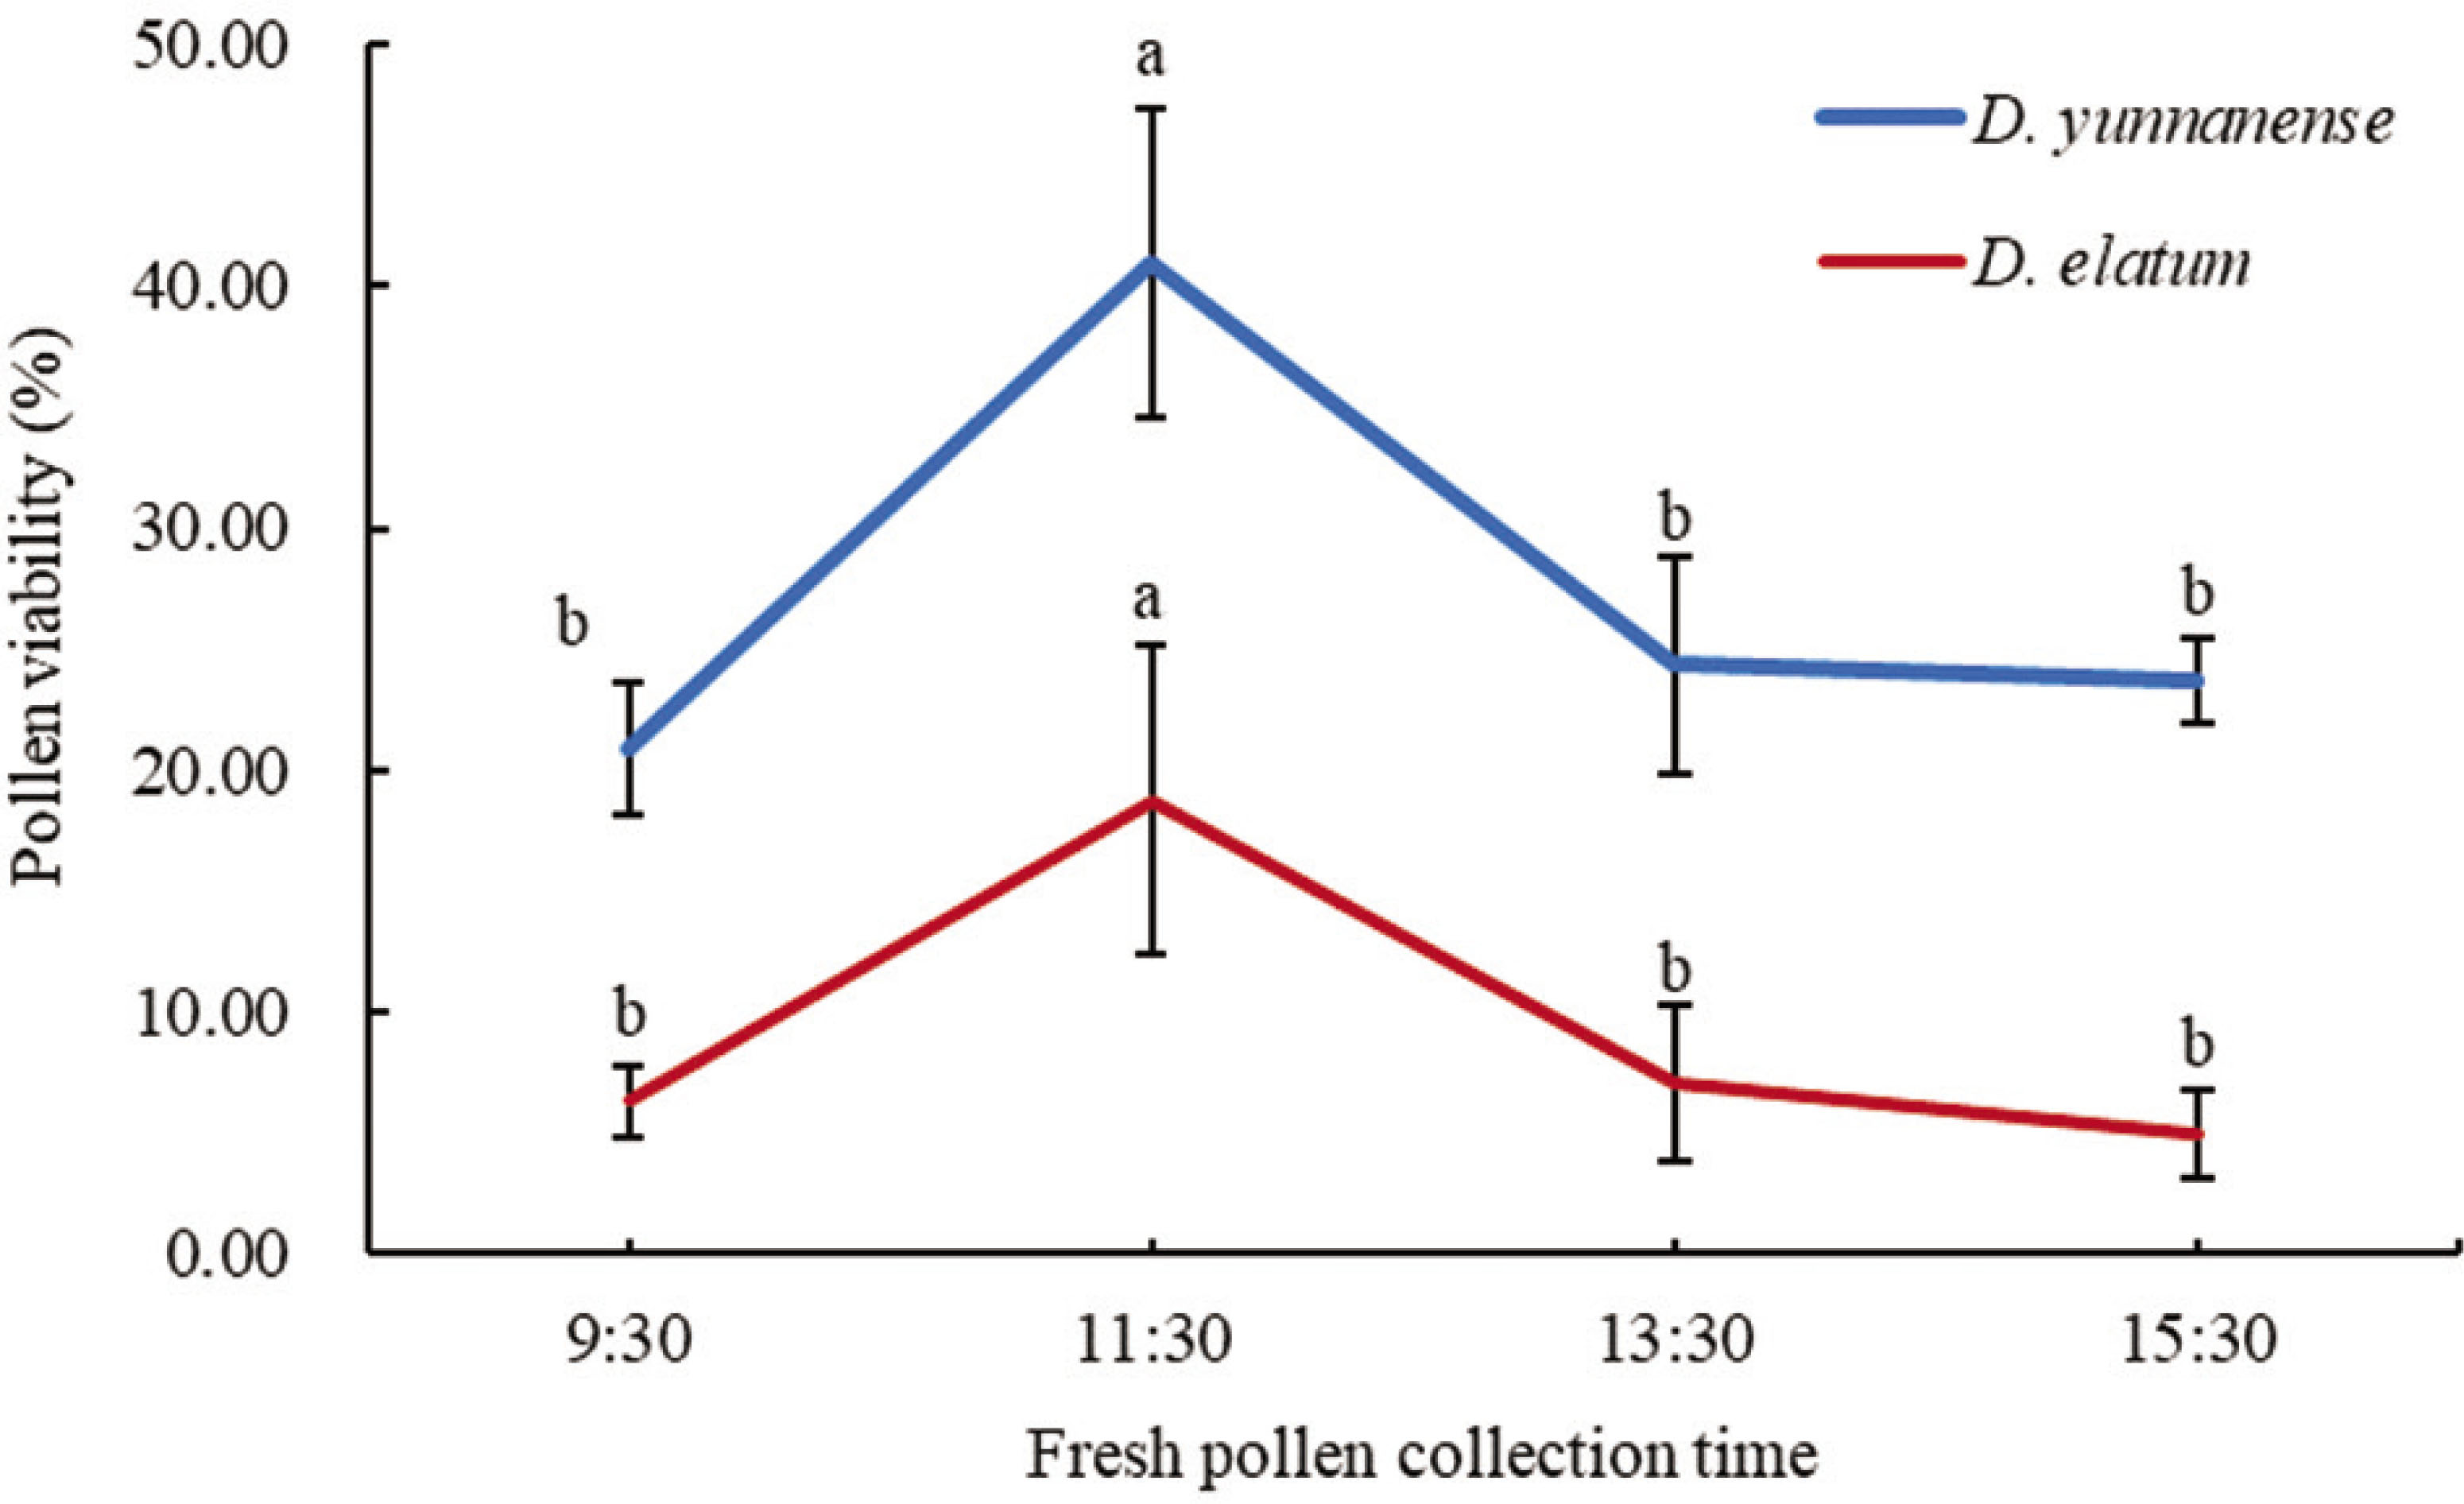
Figure 2
The diurnal variation of pollen viability in D. yunnanense and D. elatum. One-way ANOVA was used to assess statistical significance, and p values were calculated with Tukey's HSD test (α = 0.05). Multiple comparisons indicated by small letters were performed in different collection time within the same species. The data represent the mean value ± standard deviation from three replicates.
Table 1
Stigma receptivity of the full-open stage during the flower opening process in D. yunnanense and D. elatum. ‘−’, stigma not receivable; ‘±’, partial positive reaction; ‘+’, positive reaction; ‘++’ strong positive reaction.
| Species | 1st day | 2nd day | 3rd day | 4th day | 5th day | 6th day | 7th day | 8th day |
|---|---|---|---|---|---|---|---|---|
| D. yunnanense | − | − | − | − | − | + | ++ | + |
| D. elatum | − | − | − | − | + | ++ | ± | − |
[i] The data were obtained from 10 flowers.
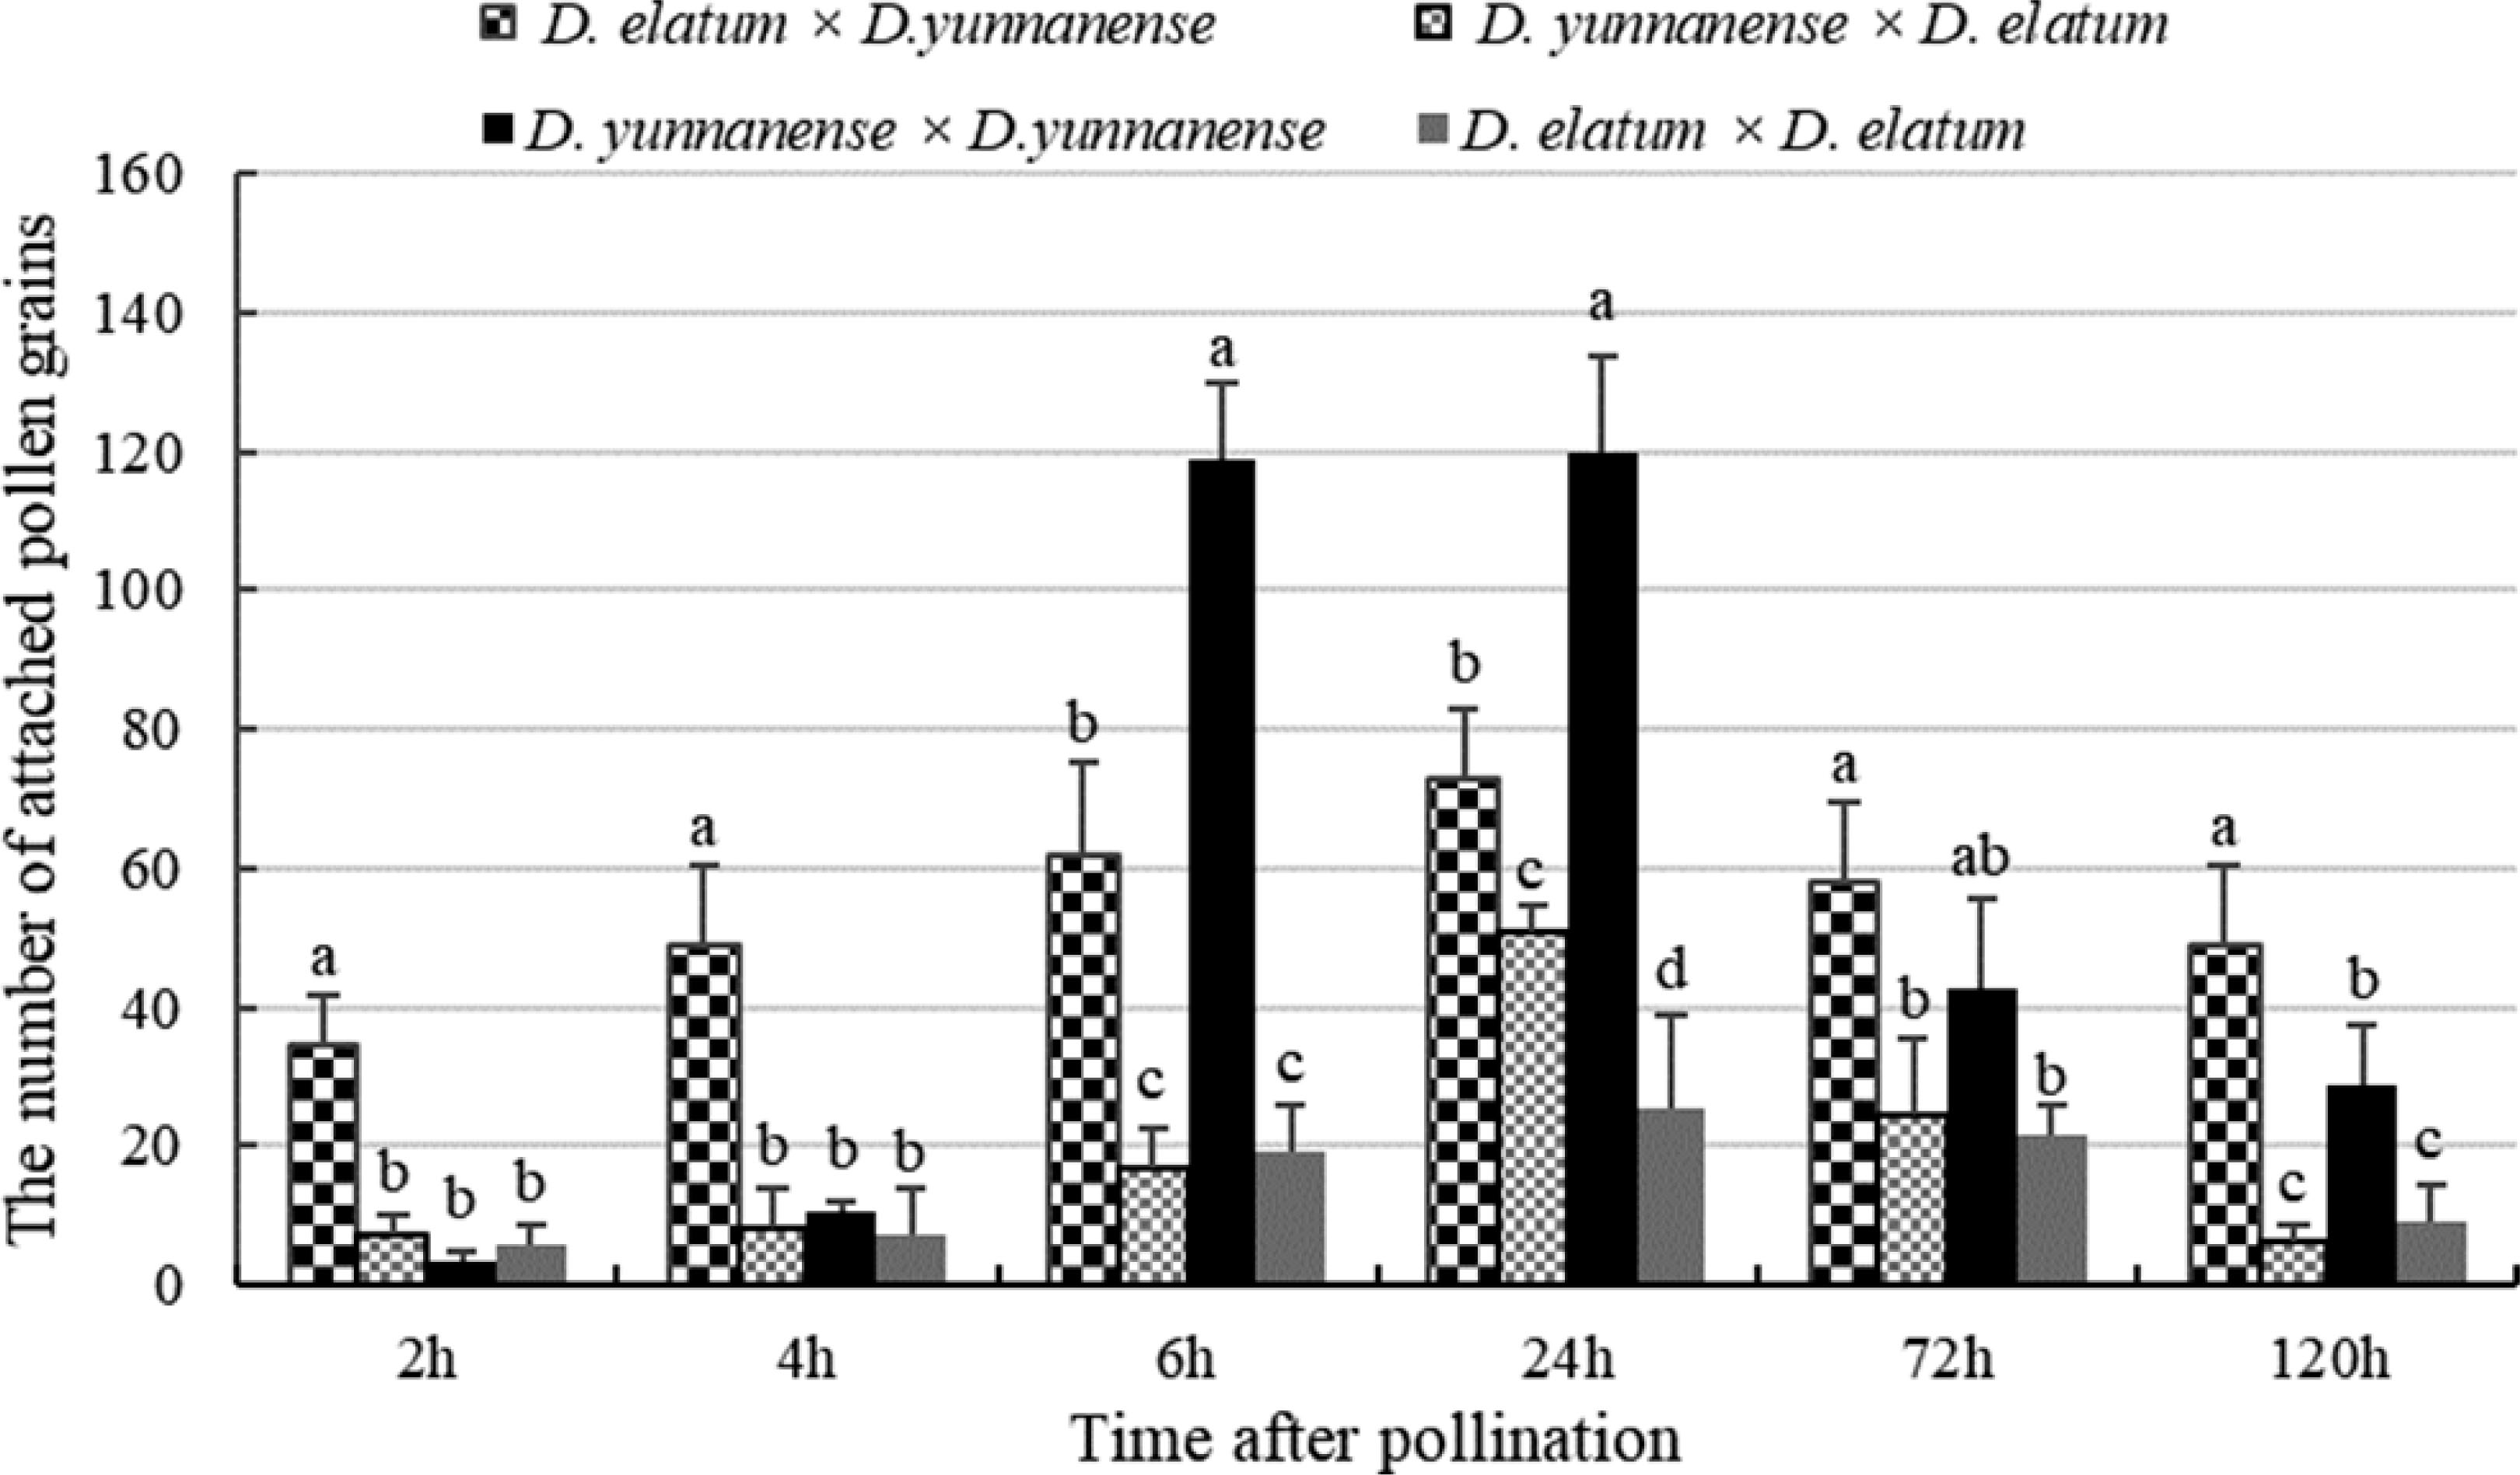
Figure 3
The number of attached pollen grains of each cross combination after different pollination time. One-way ANOVA was used to assess statistical significance, and p values were calculated with Tukey's HSD test (α = 0.05). Multiple comparisons indicated by small letters were compared in different cross combinations within the same time after pollination. The data represent the mean value ± standard deviation from three replicates.
Table 2
Results of statistical analysis about pollination time and cross combination on the number of attached pollen grains in Delphinium.
| Source of variation | Sum of square | Degree of freedom | Mean square | F value | p value |
|---|---|---|---|---|---|
| Pollination time | 27,746.7778 | 5 | 5549.3556 | 73.3260 | 0.0000 |
| Cross combination | 25,104.2778 | 3 | 8368.0926 | 110.5710 | 0.0000 |
| Time × Combination | 21,474.2222 | 15 | 1431.6148 | 18.9170 | 0.0000 |
| error | 3632.6667 | 48 | 75.6806 | ||
| Total variations | 77,957.9444 | 71 |
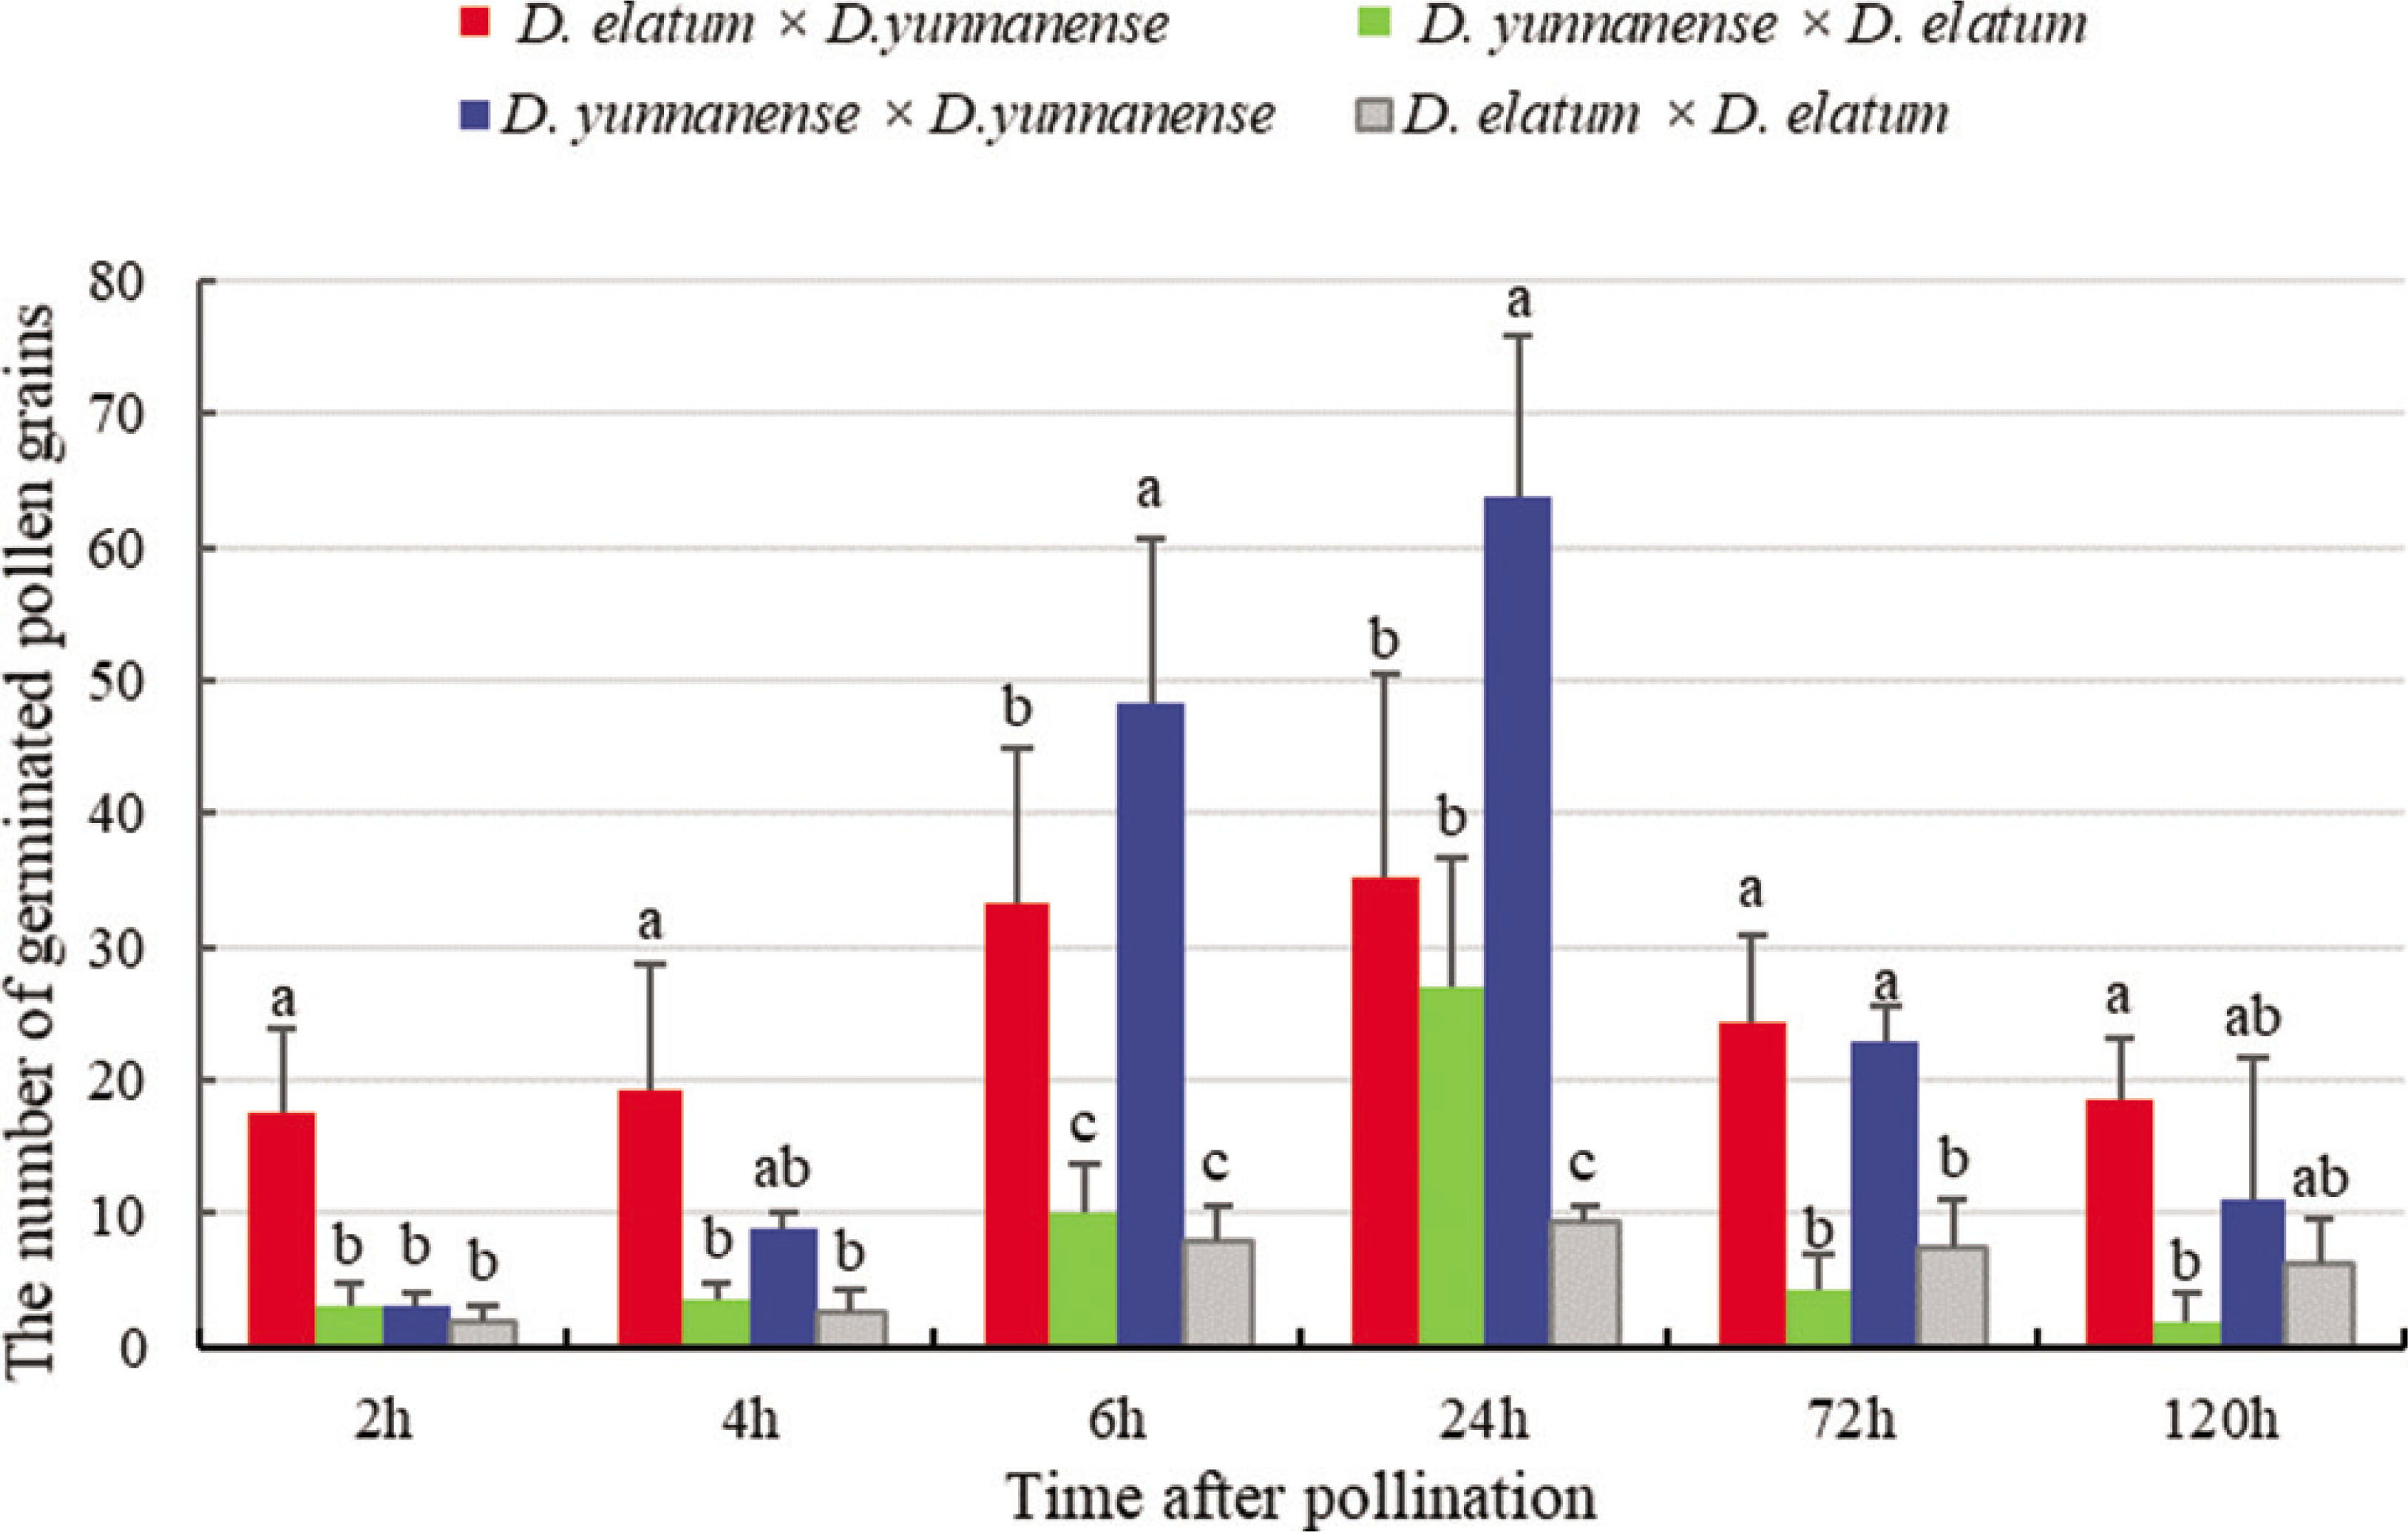
Figure 4
The number of germinated pollen grains on each cross combination after different pollination time. One-way ANOVA was used to assess statistical significance, and p values were calculated with Tukey's HSD test (α = 0.05). Multiple comparisons indicated by small letters were compared in different cross combinations within the same time after pollination. The data represent the mean value ± standard deviation from three replicates.
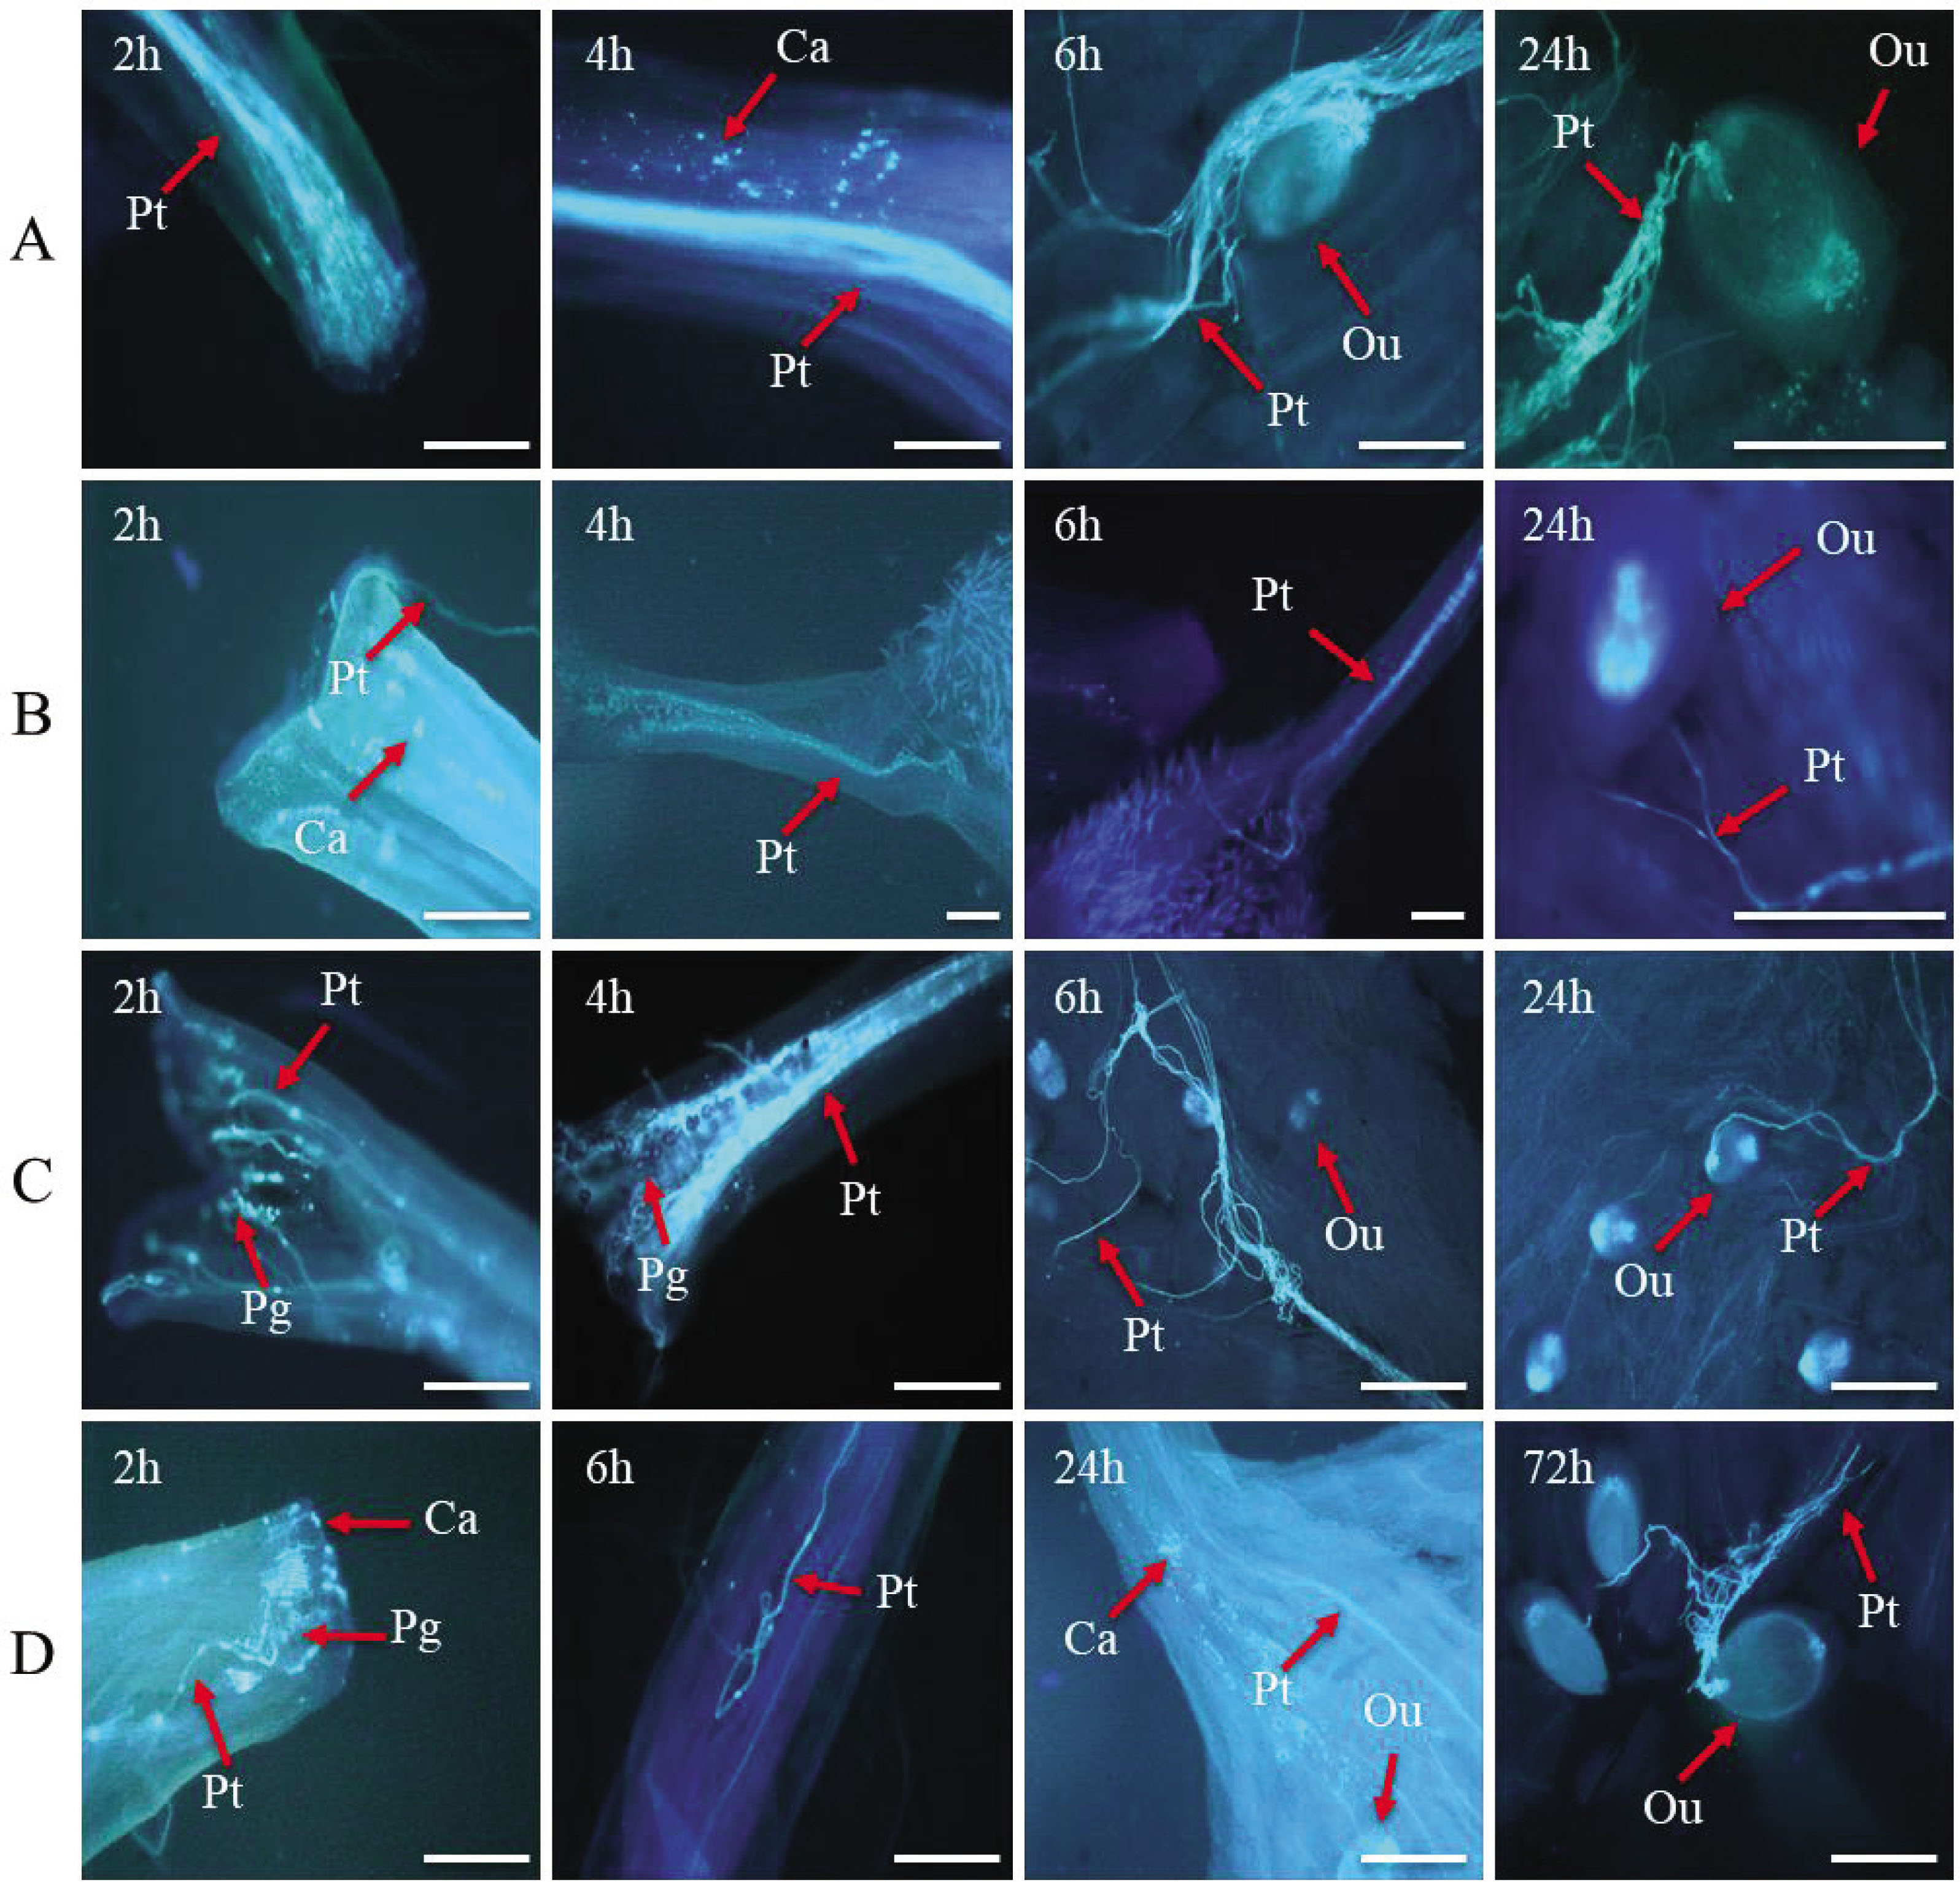
Figure 5
Dynamics of pollen tube growth of the interspecific and allogamic crosses between D. yunnanense and D. elatum. A:D. elatum × D. yunnanense. A-2h: A bundle of pollen tubes (Pt) in the style of pistil, pollen grains (Pg) visible on stigma. A-4h: Large number of callose (Ca) depositions appeared in the style. A-6h: Pollen tubes arrived near the ovule (Ou) and started to bend and twine. A-24h: Pollen tubes entered the ovule. B:D. yunnanense × D. elatum. B-2h: Few pollen grains germinated on the stigma with a large amount of callose depositions visible in the style. B-4h: The twined, knotted and spiraled pollen tubes with callose. B-6h: Six hours after pollination, the state of pollen tube remains the same as 4 h after pollination. B-24h: Few pollen tubes were close to the ovule. C:D. yunnanense × D. yunnanens. C-2h: A number of pollen tubes in style of pistil, pollen grains also visible on stigma. C-4h: A bundle of pollen tubes grow along the style. C-6h: Pollen tubes arrived near the ovule. C-24h: Pollen tubes entered the ovule. D:D. elatum × D. elatum. D-2h: A small amount of pollen germinated and callose deposition appeared. D-6h: Pollen tubes were visible in the style. The pollen tubes were twined and knotted in the style. D-24h: Pollen tubes reached the ovary with visible callose deposition. D-72: Pollen tube entered the ovule. ‘Pg’ refers to pollen grain, ‘Pt’ means pollen tube, ‘Ca’ is the abbreviation of callose and ‘Ou’ represents ovule. Bar = 200 μm.
Table 3
Results of statistical analysis about pollination time and cross combination on the number of germinated pollen grains in Delphinium.
| Source of variation | Sum of square | Degree of freedom | Mean square | F value | p-value |
|---|---|---|---|---|---|
| Pollination time | 7034.9028 | 5 | 1406.9806 | 29.7860 | 0.0000 |
| Cross combination | 6178.2639 | 3 | 2059.4213 | 43.5980 | 0.0000 |
| Time × Combination | 4283.8194 | 15 | 285.5880 | 6.0460 | 0.0000 |
| error | 2267.3333 | 48 | 47.2361 | ||
| Total variations | 19,764.3194 | 71 |
Table 4
Characteristics of F1 seeds in the interspecific and allogamic cross of D. yunnanense and D. elatum.
| Cross combination | Pollinated flowers number | Fruit number | Fruit set rate | Seed number | Seed number per fruit | Thousand kernel weight (g) | F1 seed germination rate (%) |
|---|---|---|---|---|---|---|---|
| D. elatum × D. yunnanense | 30 | 27 | 90.0% | 463 | 17.1 | 1.3 | 16.7 ± 2.08 a |
| D. yunnanense × D. elatum | 30 | 0 | 0.0% | / | / | / | / |
| D. yunnanense × D. yunnanense | 30 | 26 | 86.7% | 421 | 16.2 | 1.7 | 24.7 ± 2.52 b |
| D. elatum × D. elatum | 30 | 25 | 83.3% | 527 | 21.1 | 2.0 | 80.0 ± 4.00 c |
[i] One-way ANOVA was used to assess statistical significance, and p values were calculated with Tukey's HSD test (α = 0.05).