
Table 1
Basic aggregate parameters and contents of selected macronutrients in ‘Sibera’ and ‘Regent’ grape varieties
| Stage of fruit maturation | Soluble solids content (°Brix) | Titratable acidity (g · 100 mL−1) | pH | K (mg · L−1) | P (mg · L−1) | Ca (mg · L−1) | Mg (mg · L−1) |
|---|---|---|---|---|---|---|---|
| ‘Sibera’ | |||||||
| Physiological ripeness** | 18.1 a* | 1.02 b | 3.0 a | 865 a | 215 a | 91 a | 85 b |
| Late harvest | 21.4 b | 0.85 a | 3.4 b | 938 b | 237 b | 88 a | 72 a |
| ‘Regent’ | |||||||
| Physiological ripeness | 20.4 a | 0.87 b | 3.5 a | 1512 a | 191 a | 121 a | 93 a |
| Late harvest | 24.3 b | 0.75 a | 3.7 b | 1610 b | 223 b | 119 a | 89 a |
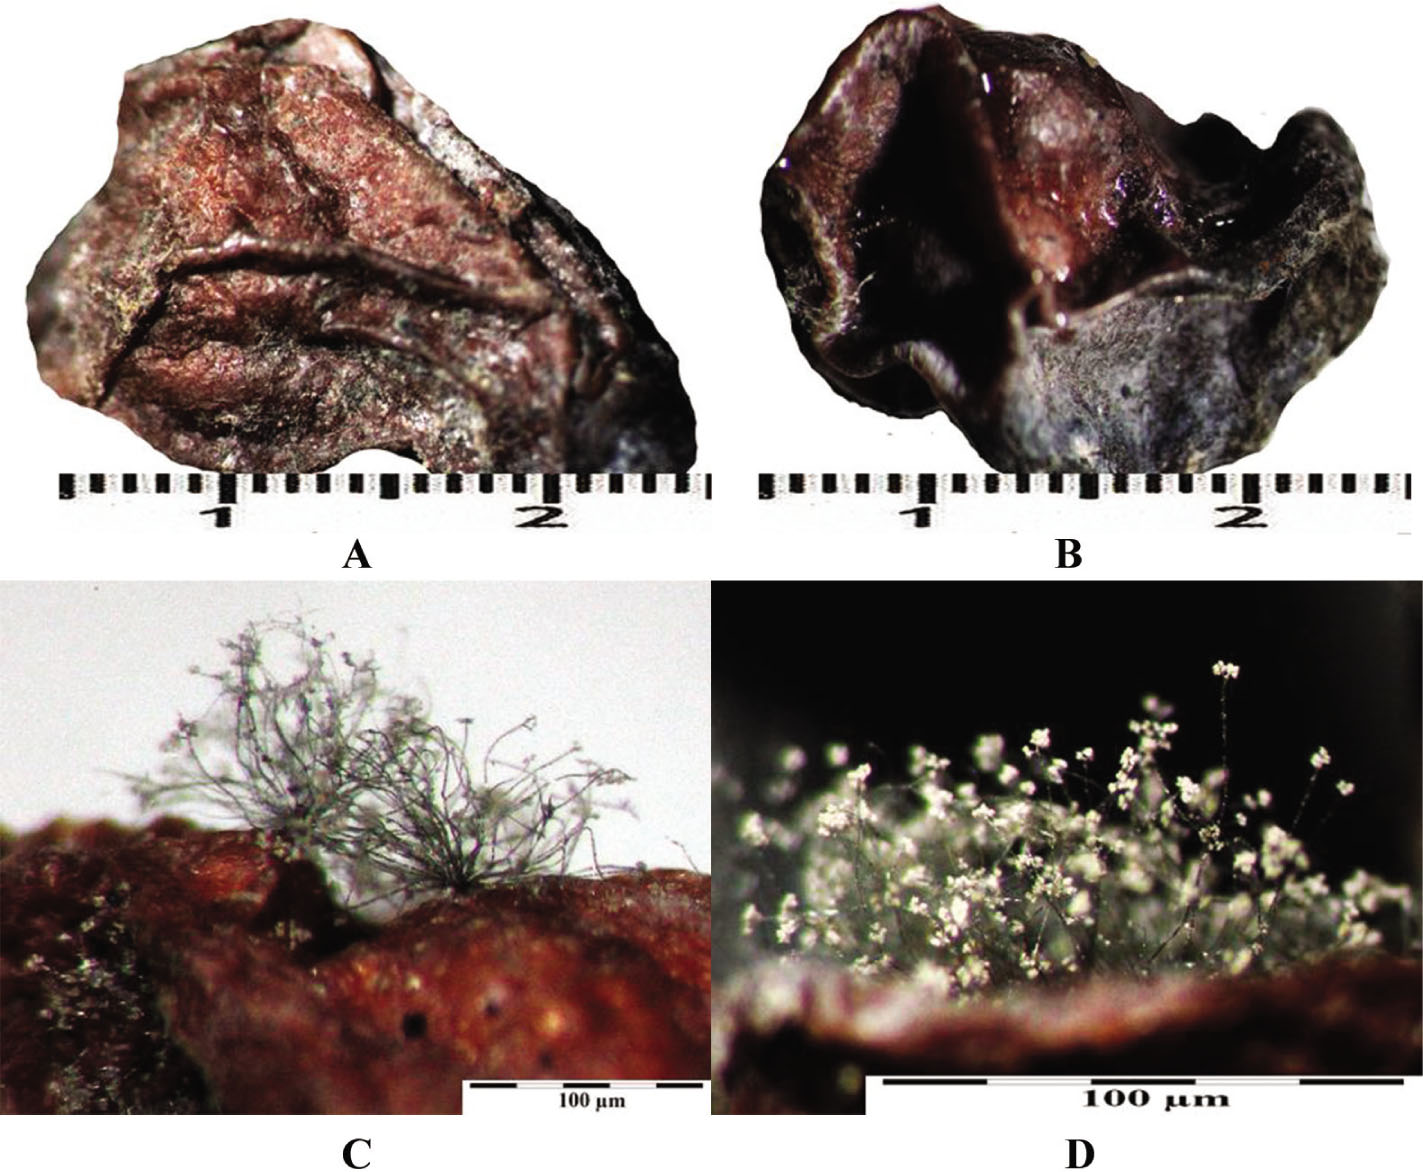
Figure 1
‘Sibera’ variety. (A) Dried berry covered with a red growth. (B) Drying berry with sticky pink juice concentrated in morphological concavities. (C) Clusters of mycelial hyphae on the surface of the drying bunch at a skin rupture. (D) Abundant sporulation of B. cinerea on the surface a drying berry. Photomicrographs were taken with a binocular magnifier.
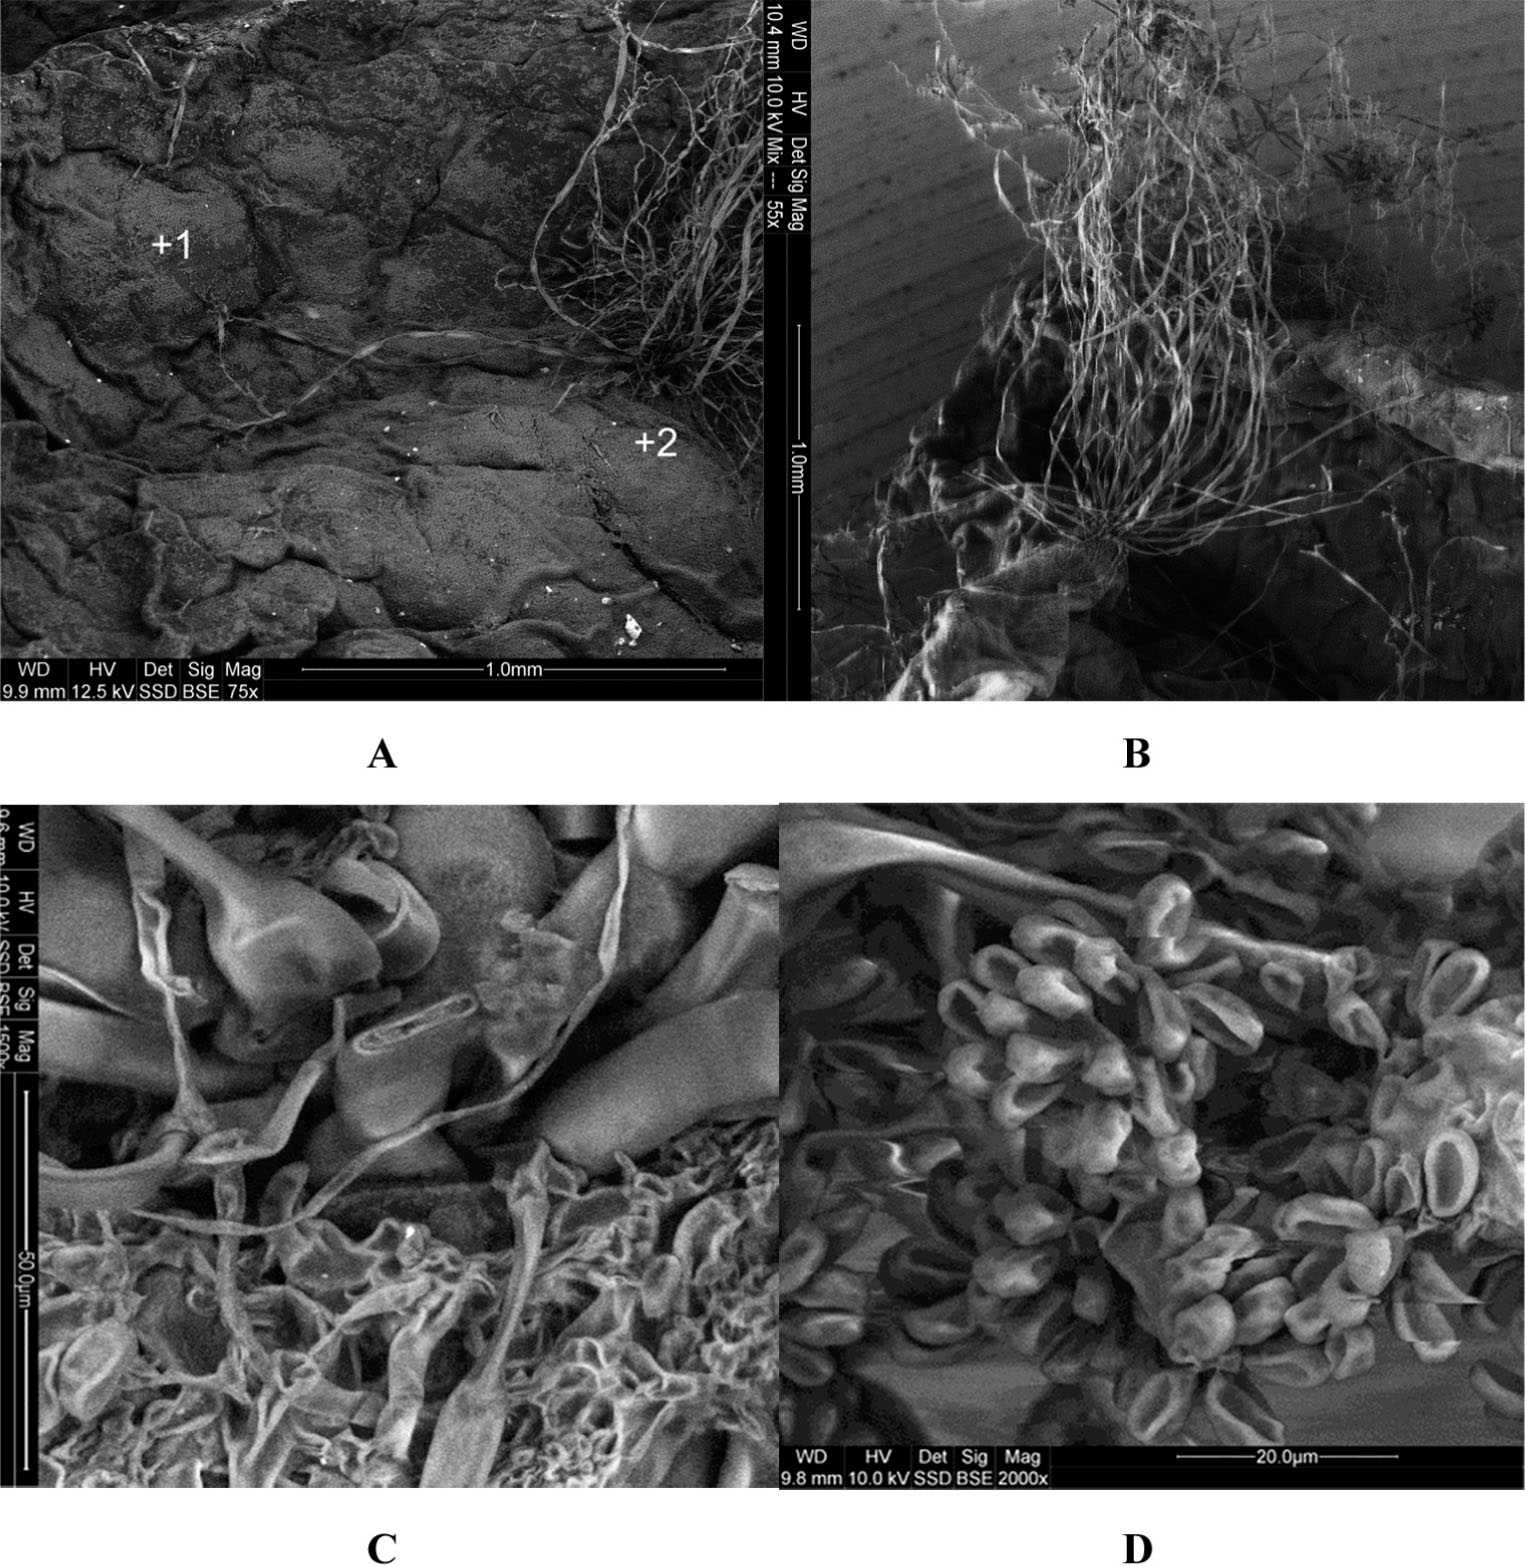
Figure 2
(A) Cracks in the skin of a drying berry; +1, +2 – EDS analysis locations. (B) mycelial hyphae on the edge of a skin crack. (C) - A cluster of mycelial hyphae and a cross section of a single hypha. (D) Conidia of B. cinerea. Scanning microscope, scale magnification.
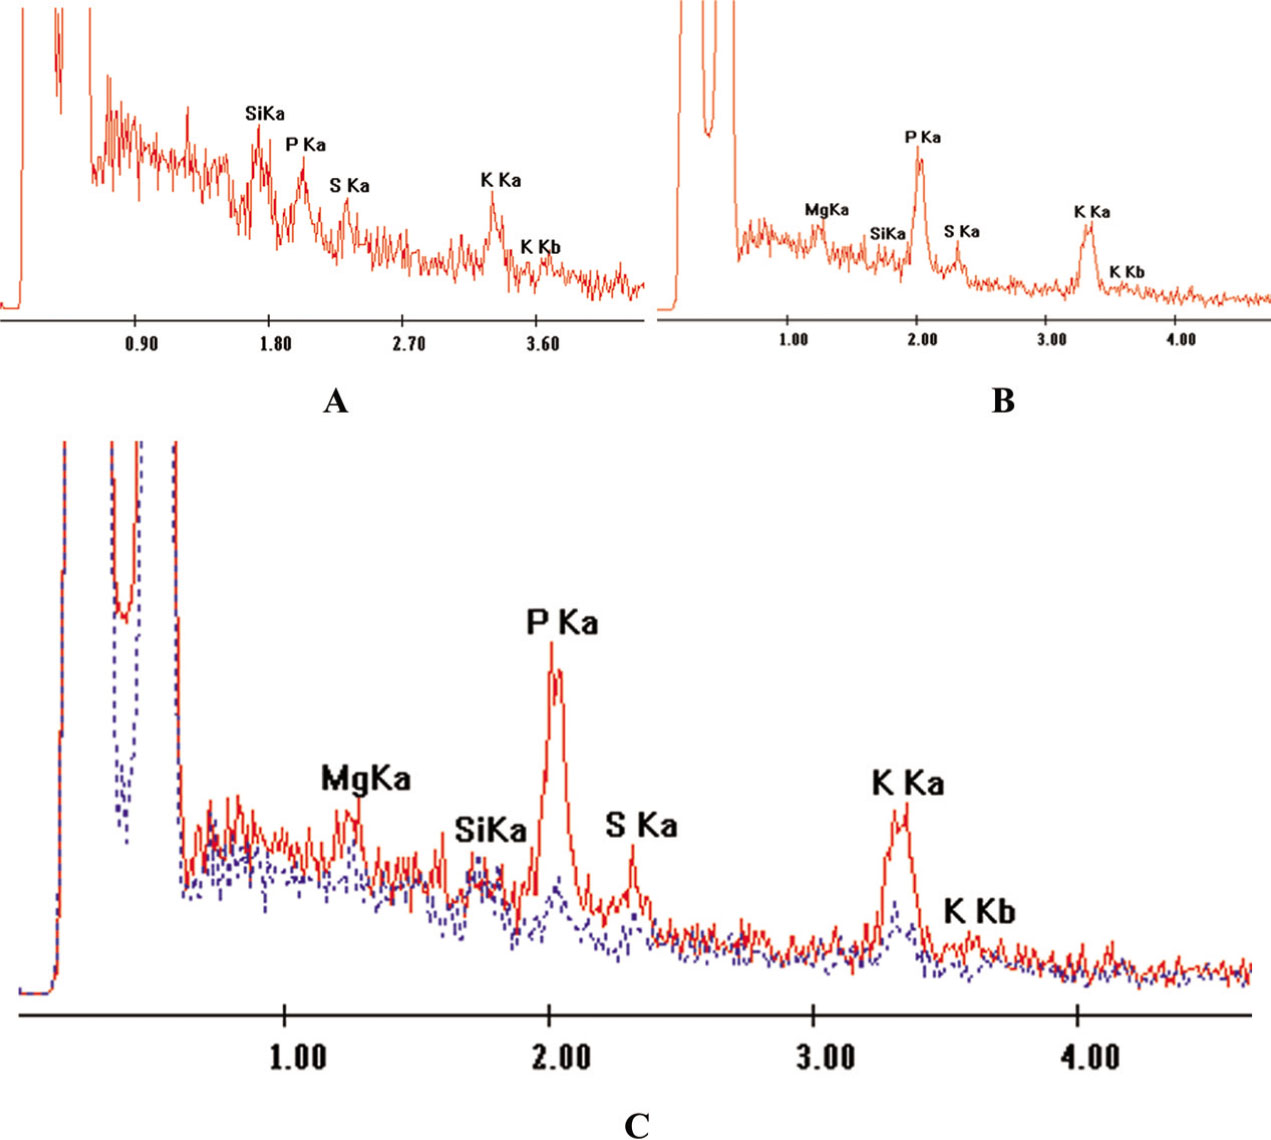
Figure 3
EDS energy spectra of the skin surface of drying berries of the ‘Sibera’ variety at spots +1 (A) and +2 (B) shown in Figures 2A and 3C. EDS energy spectra obtained from the surface of the ‘Sibera’ variety grapes. Dried and cracked berries – red spectrum. Undamaged berries, less dry – blue spectrum.
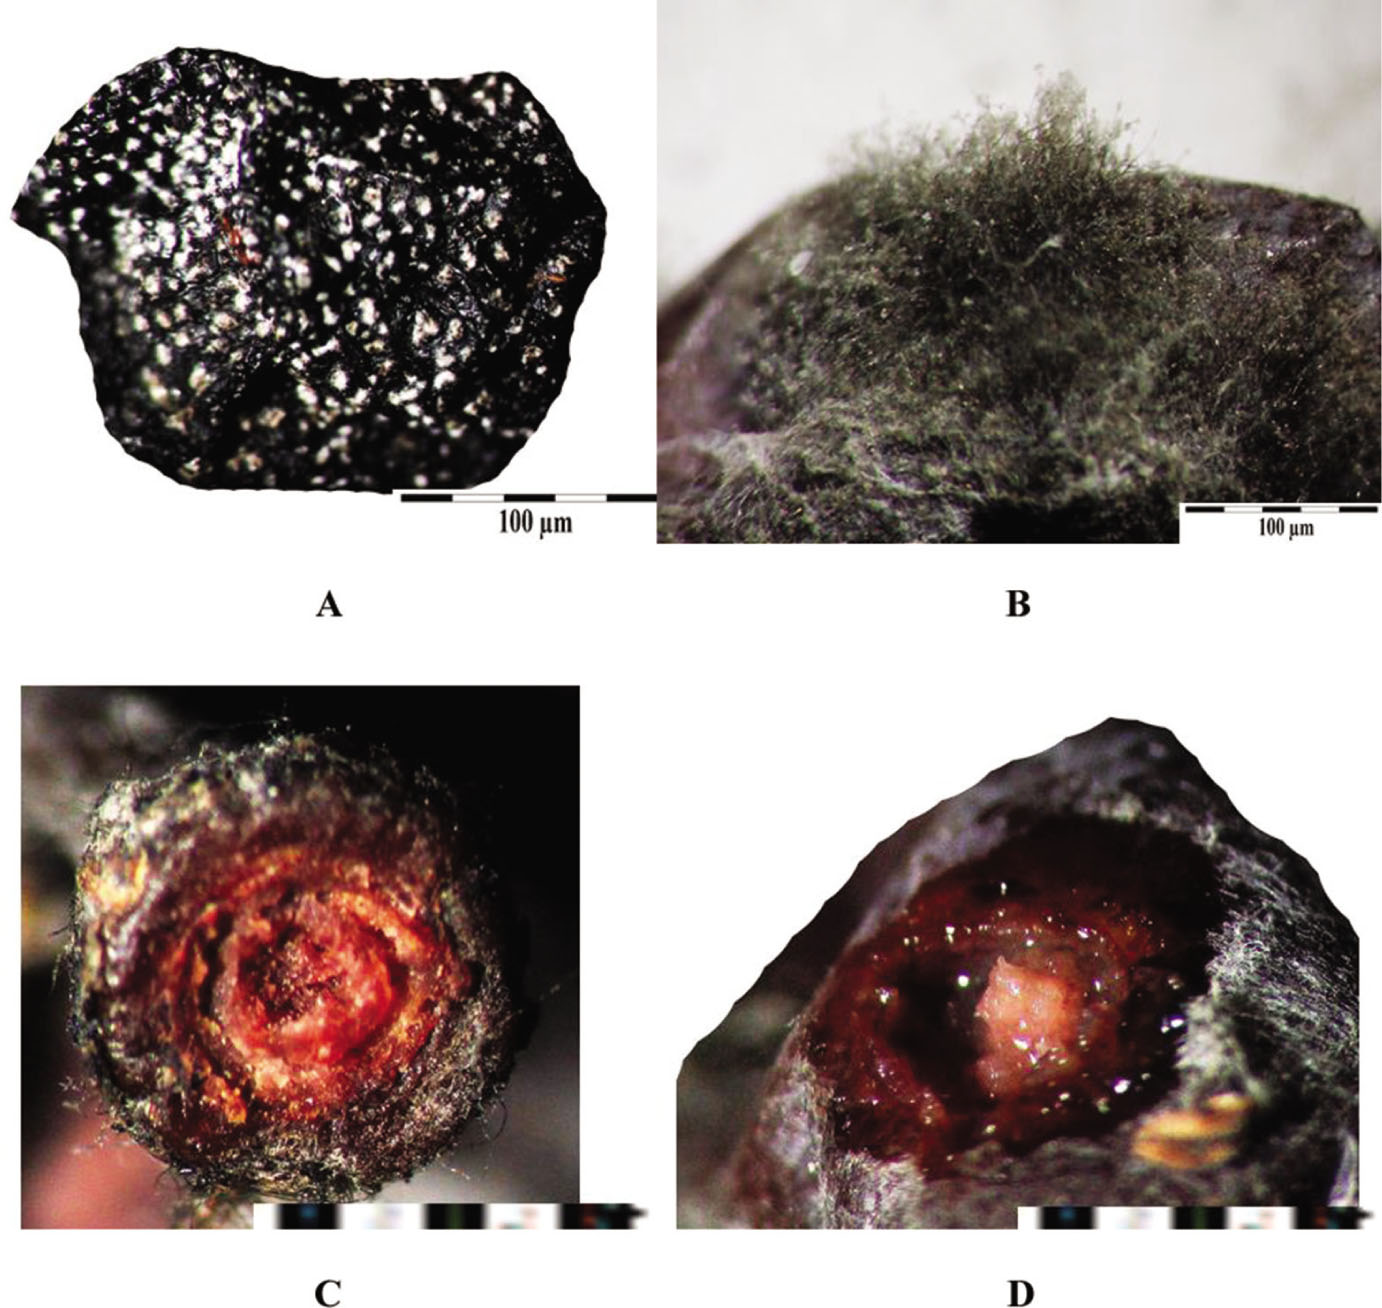
Figure 4
‘Regent’ variety. (A) The surface of a drying berry covered with bright crystals of a potassium compound. (B) Abundant growth of B. cinerea air mycelium at a rupture of the peel of a ‘Regent’ berry. (C) Stalk with advancing mineralisation by red organic iron compounds. (D) Mineralisation by sugars at the location of a detached peduncle; visible glossy sugar microcrystals. Photomicrographs taken with a binocular magnifier.
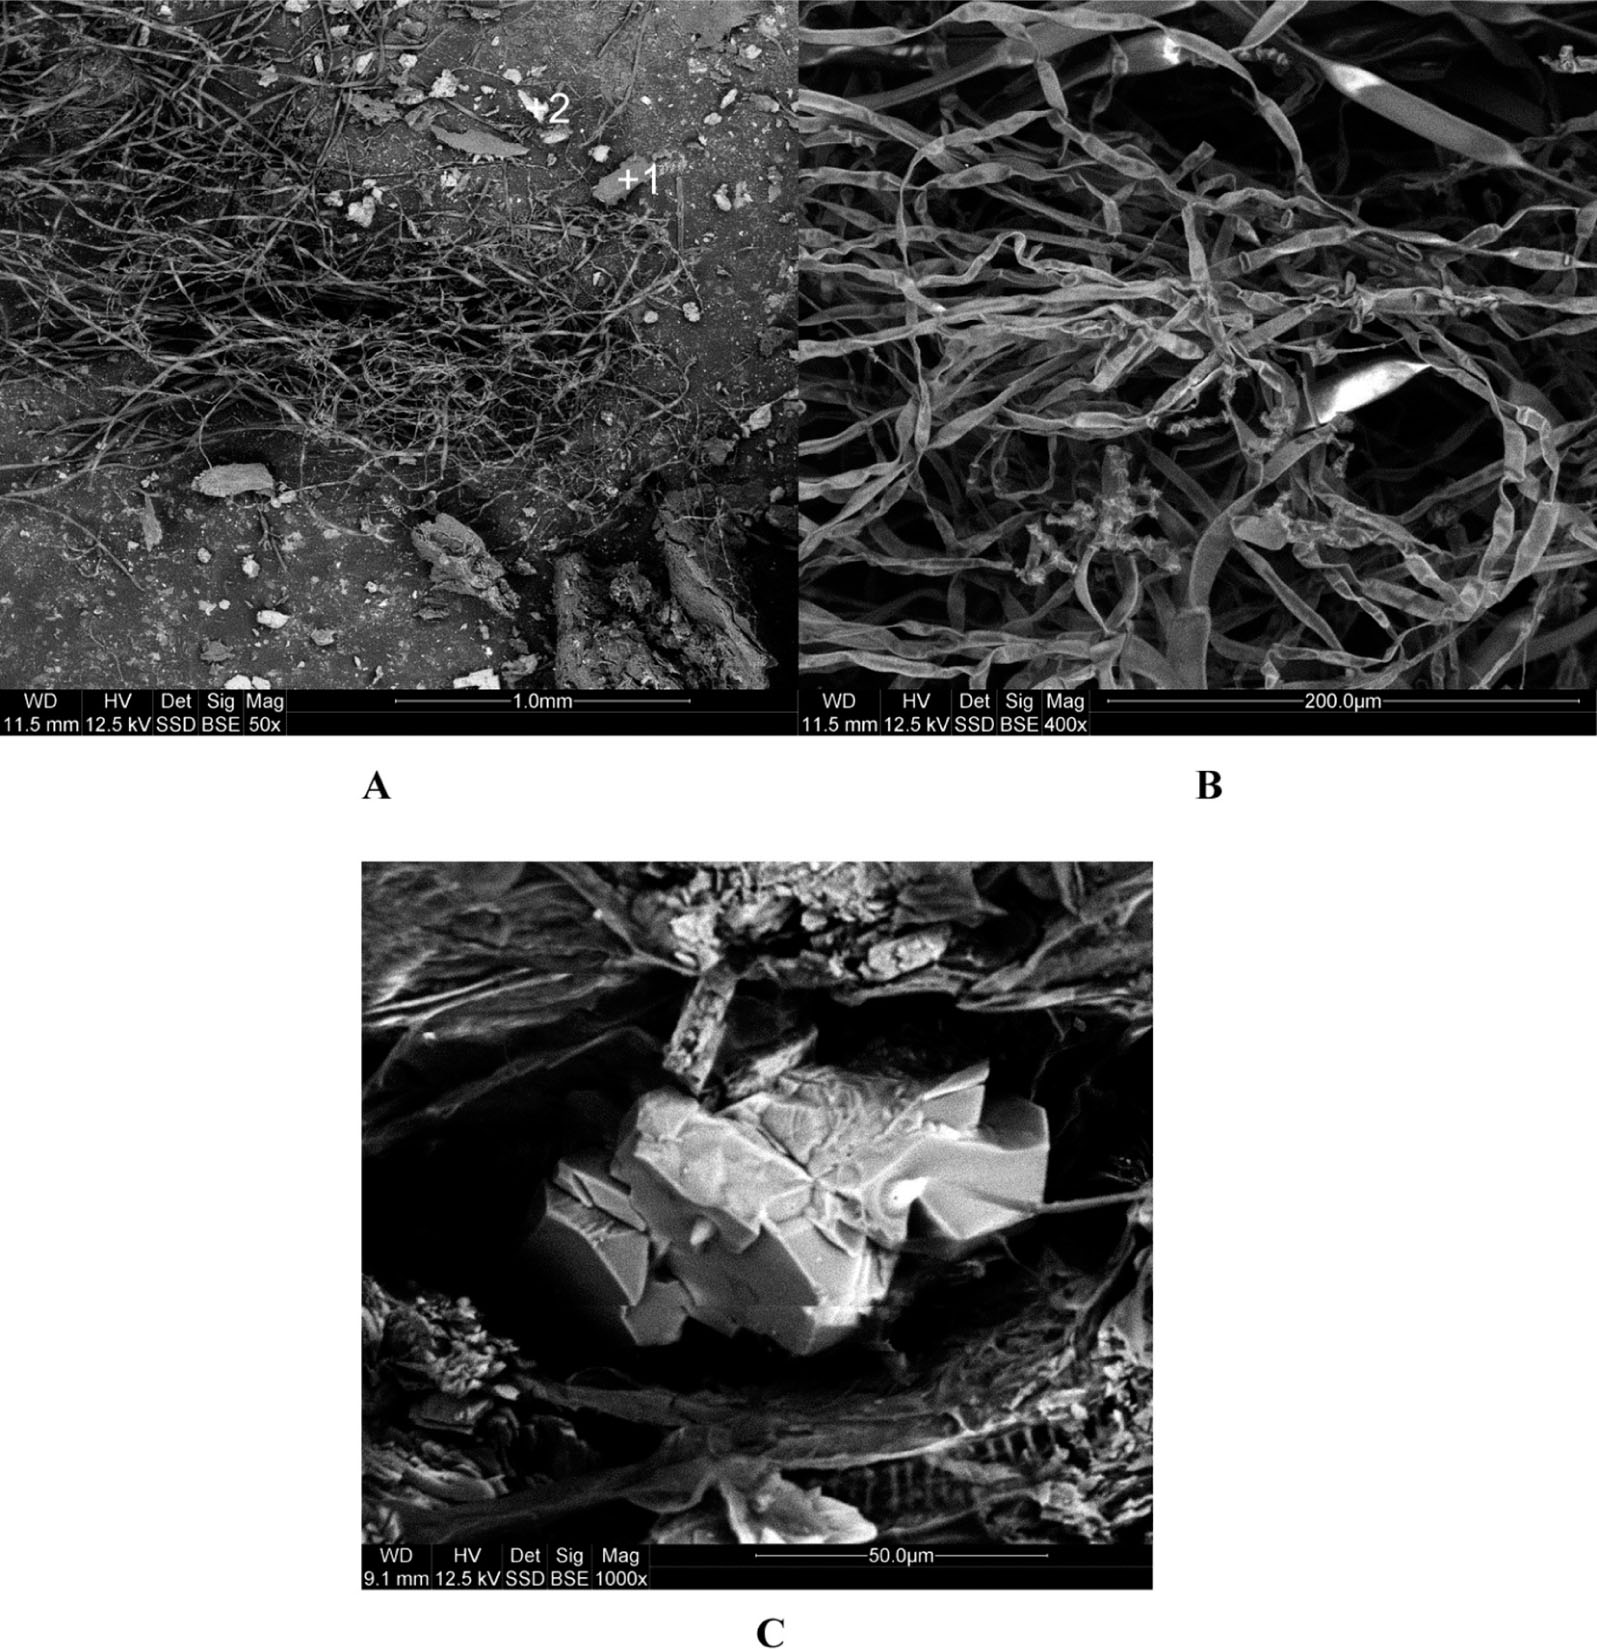
Figure 5
Surface of ripe ‘Regent’ berries. (A) B. cinerea mycelium at the location of sugar microcrystals and potassium compounds. +1, +2 – EDS analysis locations. (B) Mycelial hyphae located within skin cracks. (C) A crystal of an organic compound containing potassium, located in the wound cavity caused by berry skin cracking.
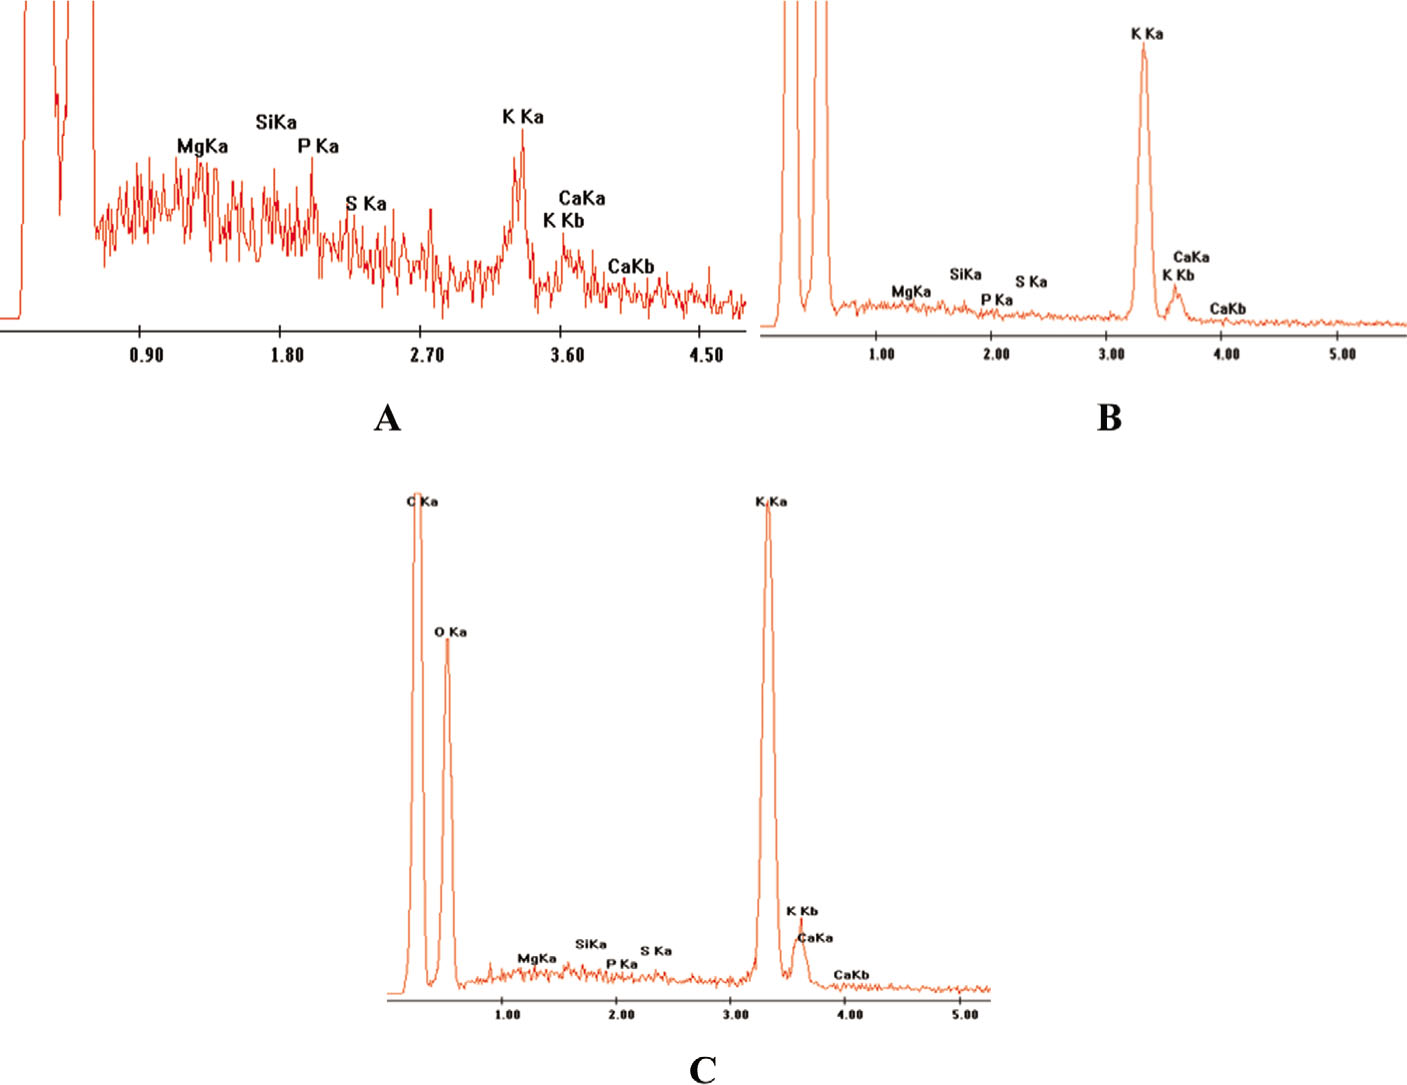
Figure 6
EDS energy spectra obtained from the surface of the ‘Regent’ variety grapes. at points +1 (A), +2 (B) shown in Figure 5A and the crystal (C) shown in Figure 5C.