
Table 1
List of mutants in chrysanthemum ‘Donglinruixue’ used for diversity analysis
| Irradiation dose (Gy) | Type of mutation |
|---|---|
| 0 Gy | No variations |
| 15 Gy | Increased leaf crack |
| 20 Gy-1 | Reduced number of petals |
| 20 Gy-2 | Leaves missing green colour, increased leaf crack |
| 25 Gy-1 | Rolled leaves |
| 25 Gy-2 | Lanceolate leaves, increased tubular flowers |
| 25 Gy-3 | Lanceolate leaves, decreased number of petals |
| 30 Gy | Increased leaf cracks and reduced number of petals |
| 35 Gy-1 | Rolled leaves |
| 35 Gy-2 | Plant dwarfing, twisted ligulate flowers |
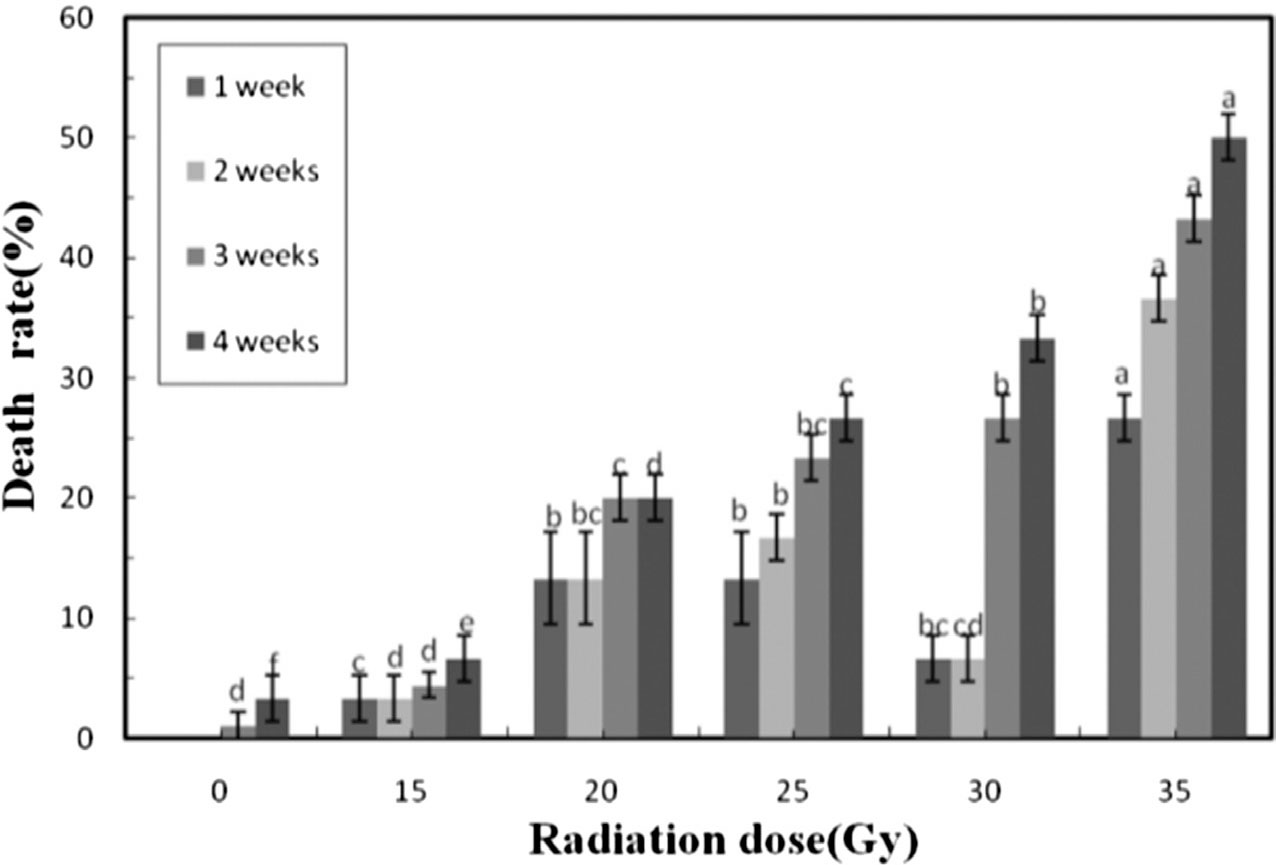
Figure 1
Effect of gamma radiation on the death rate of chrysanthemum ‘Donglinruixue’ plants at different radiation doses. Mean values were calculated from three experiments.
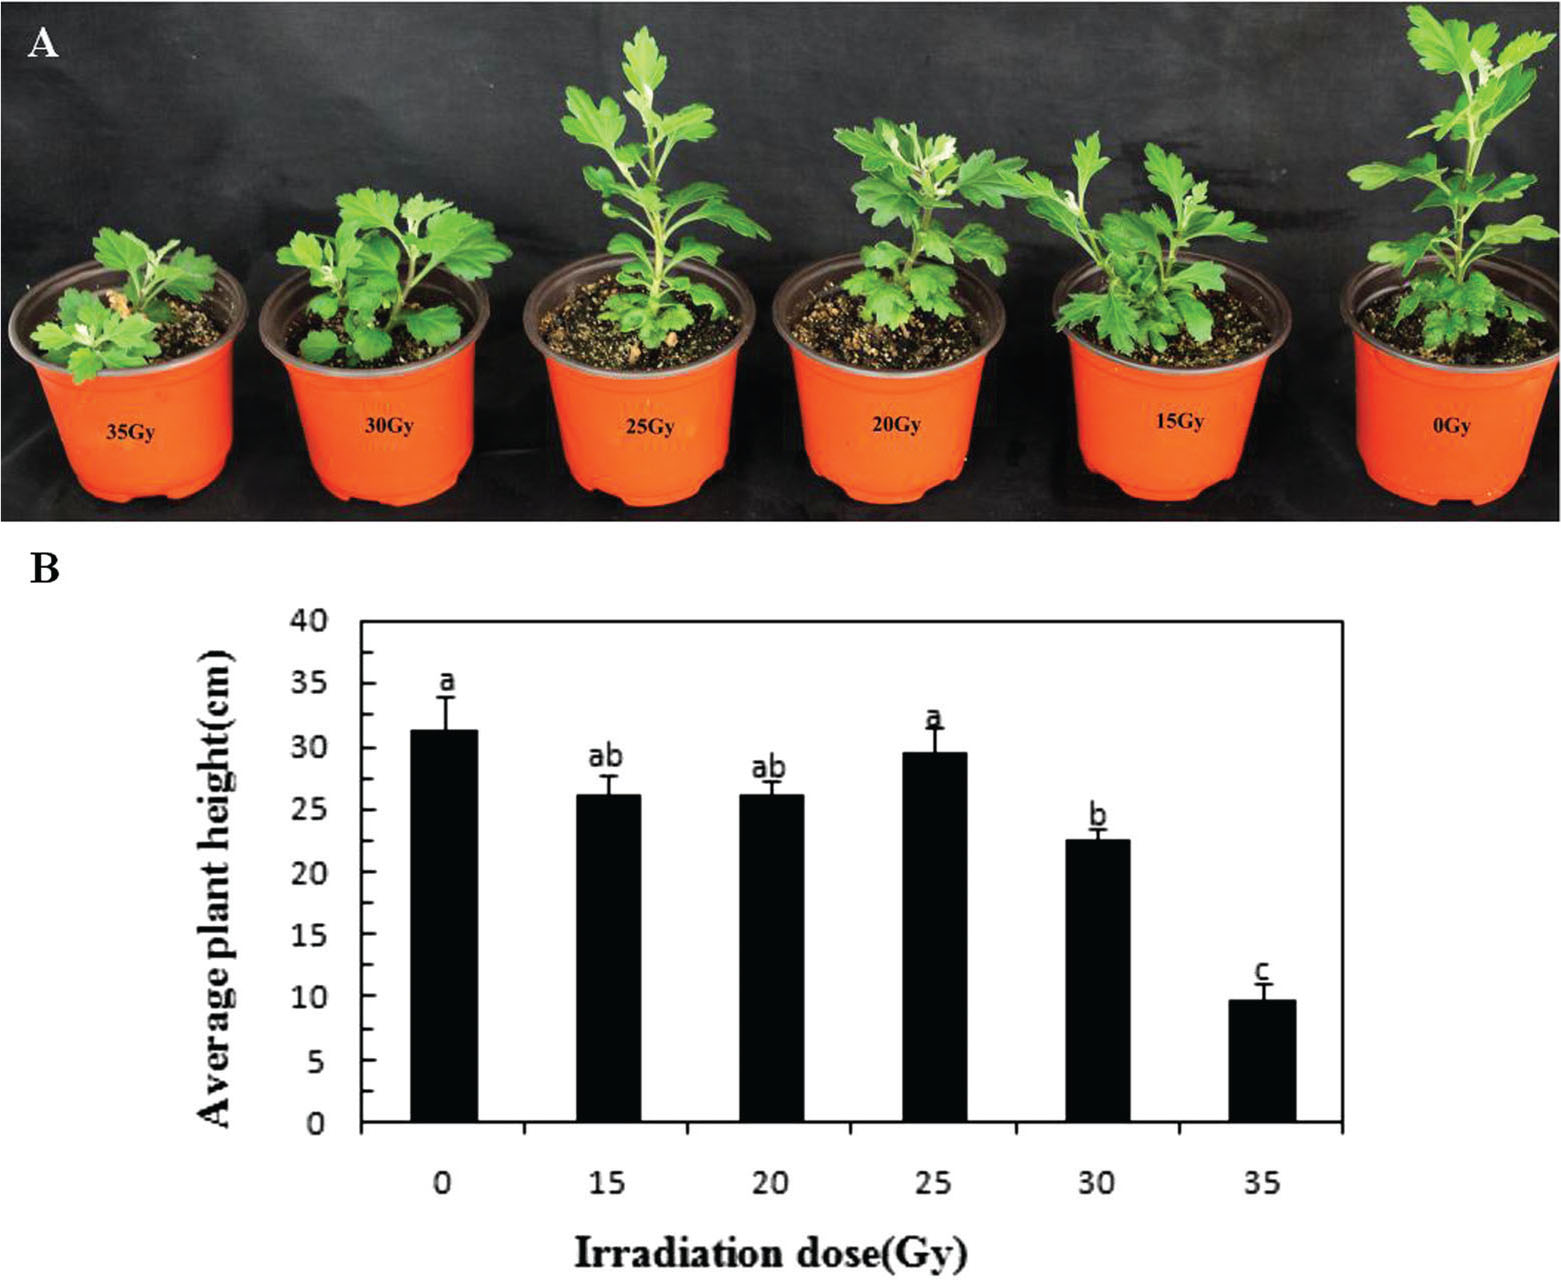
Figure 2
Effect of gamma radiation on average plant height of chrysanthemum ‘Donglinruixue’ plants at 120 days of plant culture after treatment with different radiation doses. (A) Effect of 0, 15, 20, 25, 30 and 35 Gy radiation. (B) Effect of gamma radiation on average plant height of chrysanthemum ‘Donglinruixue’ plants at different radiation doses. Mean values and SEM were calculated from three experiments. Within each set of experiments, bars with different letters are significantly different at the 0.05 level.
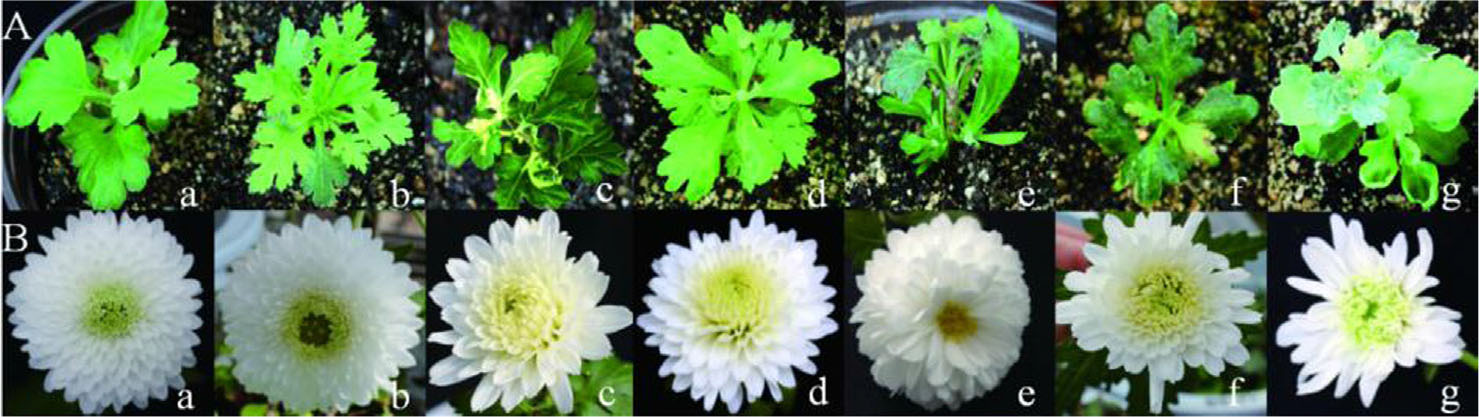
Figure 3
Morphological variations induced by gamma-ray irradiation in chrysanthemum ‘Donglinruixue’. (A) Variations in leaves: (a) original leaves on the control plant; (b) increased leaf crack; (c) leaves missing green colour; (d) deformed leaves; (e) lanceolate leaves; (f) leathery leaves and (g) rolled leaves. (B) Variations in flowers: (a) original flowers of the control plant; (b) reduced number of tubular flowers; (c) the top of the petal split; (d) reduced number of petals; (e) petals widened; (f) edge of flower with tubular flowers and (g) twisted lingulate flowers.
Table 2
Effect of gamma radiation on morphological variations of chrysanthemum ‘Donglinruixue’ plants
| Radiation dose (Gy) | Total number | Variations in leaves after 120 days of culture | Variations in flowers after 120 days of culture | ||
|---|---|---|---|---|---|
| Number of variants | Rate of variation (%)* | Number of variants | Rate of variation (%)* | ||
| 0 | 87 | 0 | 0.00 f | 0 | 0.00 f |
| 15 | 84 | 6 | 7.14 e | 3 | 3.57 e |
| 20 | 72 | 7 | 9.72 d | 5 | 6.25 d |
| 25 | 66 | 13 | 19.96 c | 7 | 11.36 c |
| 30 | 60 | 14 | 23.33 b | 8 | 12.50 b |
| 35 | 44 | 12 | 27.27 a | 6 | 13.81 a |
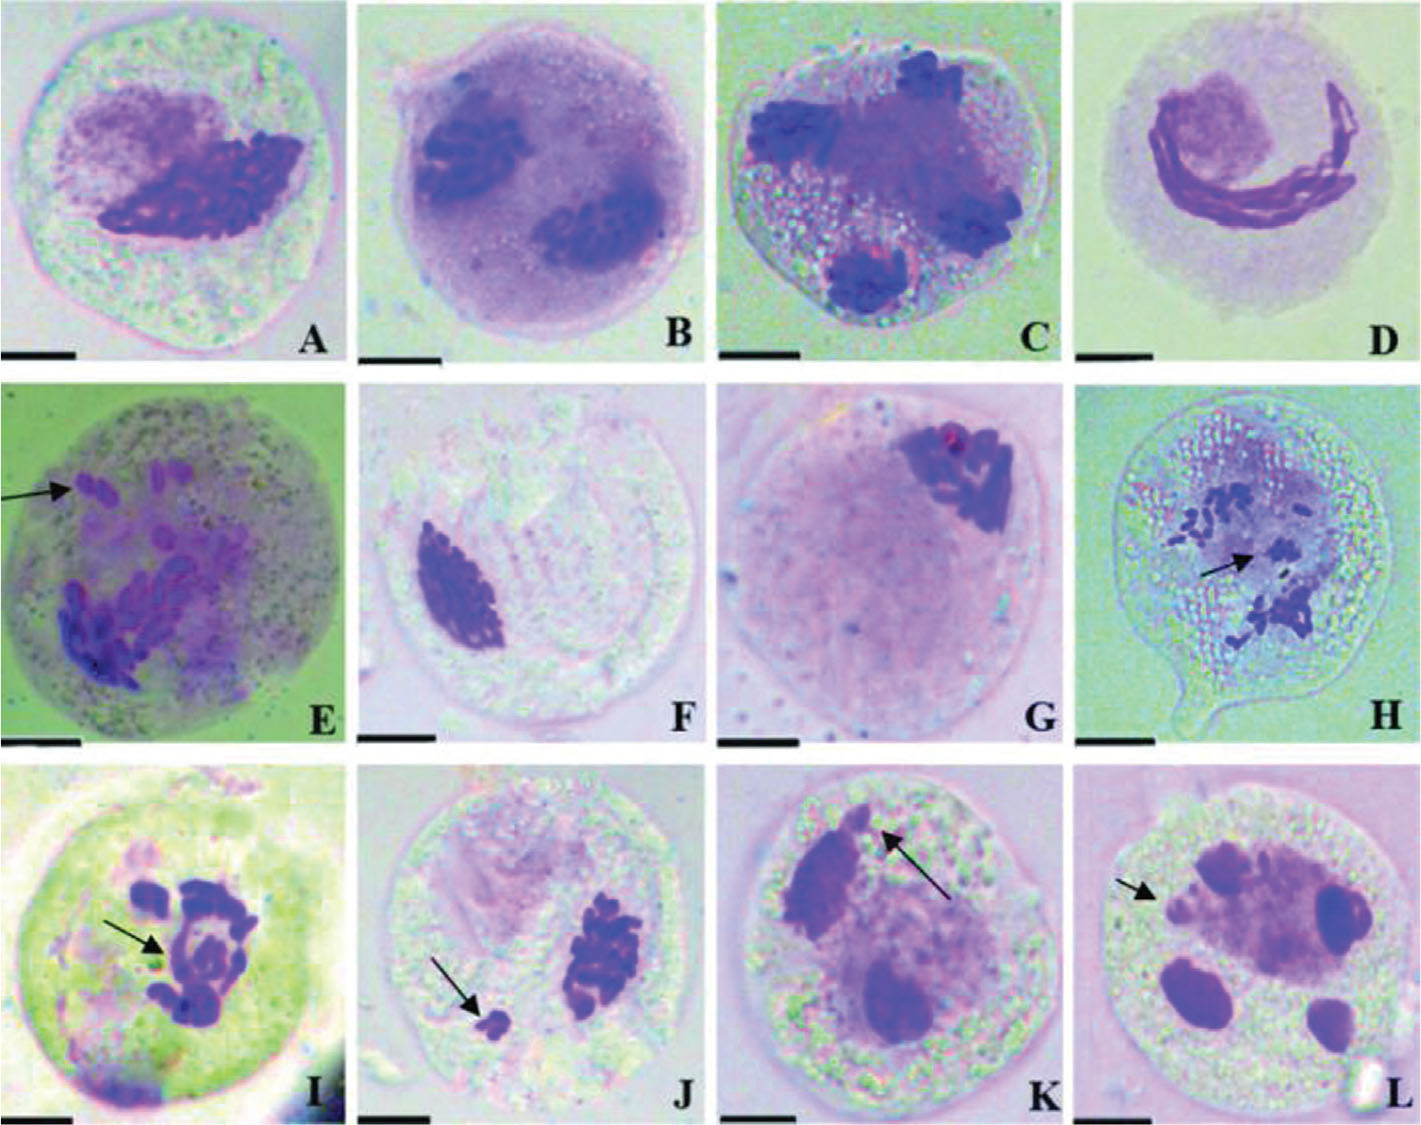
Figure 4
Meiotic behaviour in chrysanthemum ‘Donglinruixue’ as affected by gamma-ray abnormalities. (A) Normal metaphase I; (B) normal anaphase I; (C) normal anaphase II; (D) stickiness of metaphase I; (E) univalents (indicated by arrow); (F) unipolarity at prophase I; (G) unipolarity at metaphase I; (H) anaphase II with laggard (indicated by arrow); (I) anaphase I showing bridge and fragments (indicated by arrow); (J) micronuclei at prophase I (indicated by arrow); (K) stickiness at metaphase with precocious movement (indicated by arrow) and (L) tetrad with micronuclei (indicated by arrow). Bar = 10 μm.
Table 3
The abnormal cells with meiosis aberrations of chrysanthemum ‘Donglinruixue’ plants due to the irradiation effect
| Radiation dose (Gy) | Total PMC count | Number of cells with aberrations | Total abnormal cells (%)* | |||||
|---|---|---|---|---|---|---|---|---|
| Stickiness | Univalent | Laggards | Bridges | Micronuclei | Unipolarity | |||
| 0 | 1,000 | 12 | 0 | 4 | 8 | 0 | 0 | 2.40 f |
| 15 | 1,023 | 30 | 12 | 62 | 43 | 25 | 12 | 17.98 e |
| 20 | 1,098 | 34 | 21 | 73 | 76 | 22 | 16 | 21.22 d |
| 25 | 1,054 | 52 | 28 | 76 | 59 | 26 | 21 | 22.70 c |
| 30 | 1,003 | 78 | 31 | 89 | 79 | 29 | 23 | 32.79 b |
| 35 | 1,176 | 102 | 38 | 115 | 95 | 39 | 31 | 35.71 a |
Table 4
List of primers, number of amplified products, polymorphic bands and polymorphism percentage
| Primer name | Primer sequence (5′–3′) | No. of amplified bands | No. of polymorphic bands | Percentage of polymorphic bands |
|---|---|---|---|---|
| UBC873 | GACAGACAGACAGACA | 4 | 3 | 75 |
| UBC836 | AGAGAGAGAGAGAGAGYA | 5 | 3 | 60 |
| UBC857 | ACACACACACACACACCG | 3 | 2 | 66.66 |
| UBC835 | AGAGAGAGAGAGAGAGCC | 6 | 6 | 100 |
| UBC855 | ACACACACACACACACYT | 9 | 8 | 88.89 |
| UBC834 | AGAGAGAGAGAGAGAGYT | 6 | 6 | 100 |
| ISSR13 | TCTCTCTCTCTCTCCC | 9 | 9 | 100 |
| ISSR 20 | ACACACACACACACACGG | 5 | 4 | 80 |
| ISSR 25 | AGAGAGAGAGAGAGAGGA | 4 | 4 | 100 |
| ISSR 26 | AGAGAGAGAGAGAGAGGC | 4 | 4 | 100 |
| ISSR 30 | AGAGAGAGAGAGAGAGCG | 7 | 7 | 100 |
| ISSR 32 | AGAGAGAGAGAGAGAGAT | 4 | 3 | 75 |
| ISSR 34 | ACTCACTCACTCACTC | 6 | 5 | 83.33 |
| Total | 72 | 64 | 1,128.88 | |
| Mean | 5.54 | 4.92 | 86.84 |
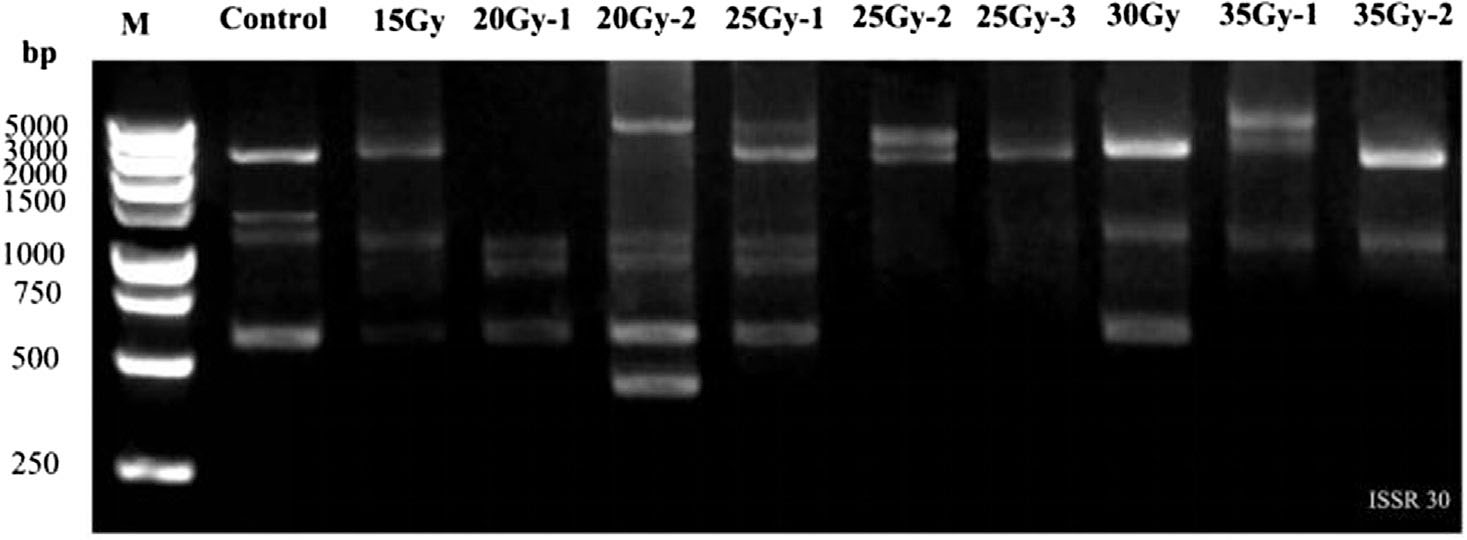
Figure 5
ISSR banding patterns in chrysanthemum ‘Donglinruixue’ by primer ISSR 30.
Table 5
Proximity matrix based on Jaccard’s coefficients
| Control | 15 Gy | 20 Gy-1 | 20 Gy-2 | 25 Gy-1 | 25 Gy-2 | 25 Gy-3 | 30 Gy | 35 Gy-1 | 35 Gy-2 | |
|---|---|---|---|---|---|---|---|---|---|---|
| Control | 1.000 | |||||||||
| 15 Gy | 0.579 | 1.000 | ||||||||
| 20 Gy-1 | 0.292 | 0.293 | 1.000 | |||||||
| 20 Gy-2 | 0.613 | 0.471 | 0.310 | 1.000 | ||||||
| 25 Gy-1 | 0.542 | 0.453 | 0.222 | 0.593 | 1.000 | |||||
| 25 Gy-2 | 0.278 | 0.233 | 0.306 | 0.230 | 0.300 | 1.000 | ||||
| 25 Gy-3 | 0.324 | 0.310 | 0.225 | 0.185 | 0.218 | 0.412 | 1.000 | |||
| 30 Gy | 0.400 | 0.290 | 0.293 | 0.286 | 0.315 | 0.209 | 0.256 | 1.000 | ||
| 35 Gy-1 | 0.442 | 0.432 | 0.254 | 0.486 | 0.406 | 0.238 | 0.177 | 0.200 | 1.000 | |
| 35 Gy-2 | 0.292 | 0.250 | 0.297 | 0.333 | 0.375 | 0.270 | 0.195 | 0.262 | 0.362 | 1.000 |
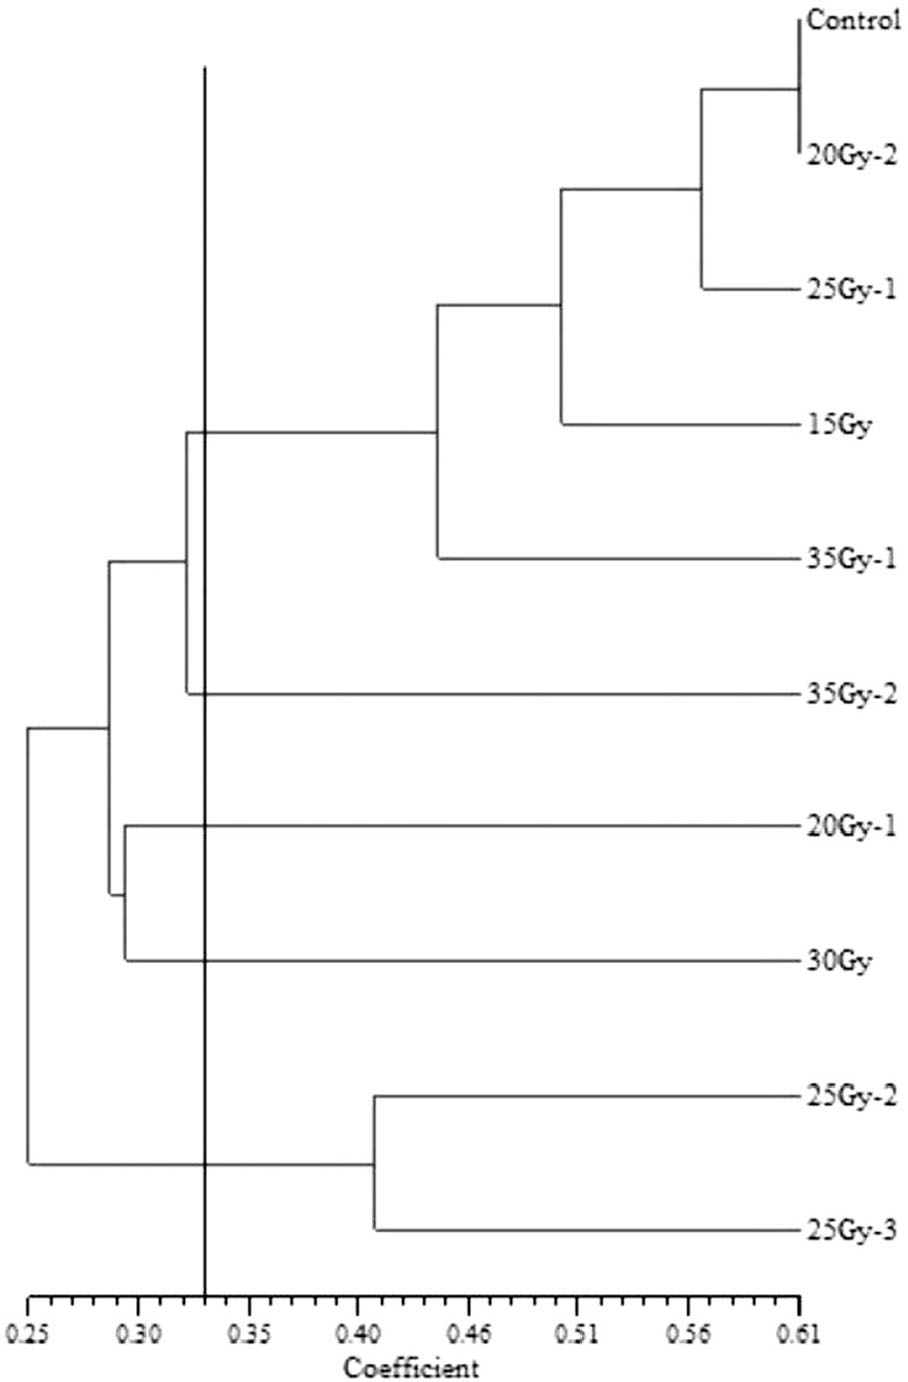
Figure 6
Dendrogram representing morphological variations based on similarity coefficients of ISSR data.