Fire breaks are a type of forest management and one of the elements of forest fire protection organisation. Their main purpose is to prevent or limit the spread of fires, that is, to reduce the fire area and damage and to facilitate firefighting. For this reason, forests located near facilities that pose a fire risk are separated from them by fire breaks, which are intended to ensure their usability throughout the year. According to the decrees of the Minister of the Environment (Journal of Laws No. 58, item 405) and the Minister of Infrastructure (Journal of Laws 2020, item 1247), there are five types of fire breaks (type A, B, BK, C and D), which are created near public roads, railway lines, storage and supply facilities, industrial facilities, military training grounds and to separate large, compact forest areas. A type A strip is a 30-m-wide strip of land adjacent to the boundary of a road or facility that is free of dead trees, fallen branches and roughly felled or fallen trees (§ 10 sec. 1 point 1) of the Regulation of the Minister of the Environment of 22 March 2006 on the detailed principles of forest fire protection (Journal of Laws of 2006 No. 58, item 405, as amended). In addition, in accordance with the provision of § 39 (sec. 1) of the Regulation of the Minister of the Interior and Administration of 7 June 2010 on fire protection of buildings, other structures and areas (Journal of Laws of 2010 No. 109, item 719), it is prohibited to deposit, in particular, branches, brushwood, roughly felled trees and operational waste at a distance of less than 30 m from the edge of a railway track or a public road other than an unpaved road.
In 2024, there was a total of 14,287 km of fire breaks in the State Forests, including 7,565 km of type A fire breaks, 1,988 km of type B fire breaks, 3,540 km of type B fire breaks, 560 km of type C fire breaks and 634 km of type D fire breaks (Wysocka 2025). By far the largest number (53%) has been that of type A fire breaks, which were created along public roads that run through forest areas. In the same year, an area of 16,000 ha was cleared of flammable materials posing a particular hazard along a 30-m-wide strip of public roads. These activities generate considerable costs for the State Forestry Administration. Therefore, the General Directorate of State Forests commissioned the Forest Research Institute to carry out a project entitled ‘Analysis of the justification for the construction of type A fire breaks from a safety and economic point of view’, which was carried out in 2022–2024 (Kwiatkowski et al. 2024). The aim was to assess the justification for the construction of type A fire breaks and the clearance of forest areas from fire-hazardous materials. This evaluation was carried out from the point of view of ensuring fire safety and rationalising the costs incurred by the State Forests for the construction and maintenance of fire breaks and clearing work as part of preventive measures. The article presents the economic aspect of the creation of fire breaks and clean-up operations near public roads and their impact on reducing the damage caused by forest fires by comparing the costs incurred by the State Forests to maintain the protection required by law with the damage caused by fires.
The economic calculation of the establishment and maintenance of fire breaks and the clean-up work along public roads to reduce the damage caused by fires was based on analyses of the occurrence of forest fires along public roads, damage caused by forest fires along public roads, the costs of establishing and maintaining type A fire breaks and the clean-up work along public roads.
The basis for the analysis was information on forest fires that was given in the forest district reports in the State Forest Information System, which was transferred to the National Forest Fire Information System (NFF-IS). In developing the analysis, the occurrence of fires on public roads was compared to all forest fires that occurred from 2017 to 2021. To select fires that occurred on public roads, 30-m-wide forest fragments were defined at the boundaries of forest complexes corresponding to the width of type A strips and the width of the cleared forest of lying flammable materials. The next step was to select forest fragments located along paved roads. At this stage of the work, data on the location of roads collected in the Database of Topographic Objects (DTO) and available on the Geoportal website (https://www.geoportal.gov.pl/pl/dane/baza-danych-obiektow-topograficznech-bdot10k/) were used.
Of all the roads contained in the DTO database, those with a natural ground surface were removed. In the next step, 50-m-wide buffers were created along the roads. The larger width compared to the A strip resulted from the fact that the DTO data does not contain detailed information about the width of the road and the road strip. Then, the common part of the generated buffers and 30-m forest fragments at the edge of forest complexes were selected, assuming that these are places where A-type strips or land clearings should be made. The final step was to determine the origin of the fires that were located on the A-type strips using the coordinates. All analyses were conducted by assessing the proportion of fires on public roads according to each criterion compared to the proportion of all wildfires. The criteria to be used to characterise fires on public roads were duration of fire response, number of rescue and firefighting units, area of fire, type of fire, cause, method of detection, age of stand, type of ground cover and type of forest habitat. In addition, air temperature, relative humidity and litter moisture were taken into account as the criteria that influence the degree of forest fire risk.
The analysis of losses caused by fires on public roads was carried out based on data collected in NFFIS from 2017 to 2023. In the analysis, fires on military training grounds and fires for which duplicate reports were prepared by forest districts, for example, because the same fire affected several departments, were not considered. To ensure the accuracy of the data, fires that occurred in the same forest district and at the same time and involved the same number of fire brigades and the same number of waters drops from an aircraft were also excluded.
The next step was to determine whether a particular fire occurred on or off a fire break. This part of the work was carried out in the manner described in the methodology for analysing the occurrence of fires on public roads. For a more comprehensive assessment of the economic impact of fires, the size of fires and the losses they caused were compared for fires that occurred on roads and fires that occurred in other forests. This analysis included a comparison of the average values of the above parameters and an assessment of the significance of differences in the values of individual parameters depending on the location of the fire. The Mann–Whitney test was used to assess the significance of the differences.
The analysis was based on data from the Directorate General of State Forests on the costs of establishing new and maintaining existing fire lanes and clearing the area in the years 2018–2022. The analysis also took into account differentiation of the above-mentioned costs depending on the forest fire risk category of the forest districts in relation to their forest area.
In the period analysed, there were 11,106 fires in the State Forests covering an area of 3,780.44 ha, of which 768 fires with a total area of 55.46 ha occurred along public roads. The average area of a fire in all forests was 0.34 ha, while along roads it was 0.07 ha, which is about five times less. The proportion of fires along roads in the total number of fires was 6.92%, and the proportion of burnt area was 1.47%.
To determine the characteristics of fires along public roads, their proportion compared to fires in forests was analysed based on 12 selected criteria that correspond to the methodological assumptions. Below are examples of the main results of the analyses.
Regarding the type of fires, ground cover fires dominated (almost 90%), regardless of where they occurred (Fig. 1). There were slightly more fires in total stands in other forest areas than along public roads. The trend was reversed for individual tree fires, as these fires were more frequently recorded along roads. There were no underground fires along roads. The lower number of fires in the stands and the lack of surface fires along public roads are due to the longer duration of the fire required for the fire in the ground cover to turn into a surface or subsurface fire.

Occurrence of forest fires along public roads against the background of all fires by the type of fire (types of fires: TREES – total stand of trees, SINGLE – single tree, SUBSUR – subsurface, SOIL COVER – soil cover)
A certain correlation was recognisable in the investigated criterion of the type of ground cover (Fig. 2). In stands with a well-developed ground cover (sodded cover – SOD and heavily infested with weeds – VWEED), the proportion of fires near public roads was higher compared to all forests. In stands where the ground cover layer consisted only of mosses and blueberries (moss cover – MOSS and moss blueberry cover – MOOSB), the proportion of fires near public roads was lower.

The occurrence of forest fires near public roads against the background of all fires by the type of soil cover (soil cover type: MOSS – moss, MOSSB – moss – blueberry, WIT – without litter, HSOD – heavily sodded, VWEED – heavily infested with weeds, LITT – litter, SOD – sodded, HERB – herbaceous)
The next analysis concerned the occurrence of fires in relation to the size of the burnt area (Fig. 3). For fires with an area smaller than 0.2 ha, the proportion of those that occurred on public roads was greater than the proportion of all forest fires. The situation was reversed for fires with an area of more than 0.2 ha: they were significantly more numerous in all forests than on public roads.

Occurrence of forest fires near public roads against the background of all fires after the fire area
When analysing the methods of fire detection (Fig. 4), a clear differentiation can be seen, which is understandable. On public roads, significantly more fires (approx. 75%) are detected by bystanders (other persons [OTH]), which can be attributed to greater penetration of these areas. A greater proportion of fires detected by obser-vation points (OPOI) and aerial patrols (APAT) were found in the depths of forest complexes.
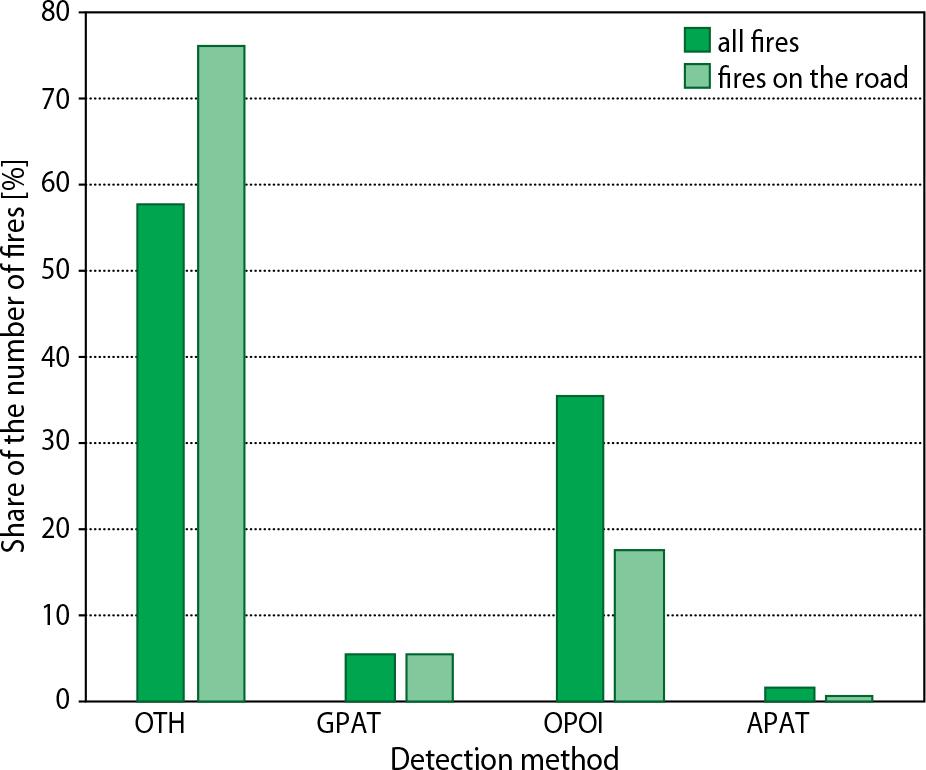
Occurrence of forest fires near public roads against the background of all fires by the detection method (detection method: OTH – other persons, GPAT – ground patrols, OPOI – observation points, APAT – aerial patrols)
A significantly higher proportion of fires on public roads that were extinguished in a very short time (up to 45 min) was clearly visible. They accounted for almost half of the events analysed. For fires that took between 45 min and 1 h to extinguish, the proportion of fires on public roads was still higher compared to all fires, but the difference was already small. When the firefighting operation lasted longer, the proportion of fires on public roads was lower compared to all forest fires, and the difference became more pronounced as the duration of the firefighting operation increased (Fig. 5).

The occurrence of forest fires near public roads against the background of all fires according to the duration of the extinguishing action
A similar relationship to the duration of firefighting operations was observed when analysing the occurrence of fires in relation to the number of rescue and firefighting units involved in the operation (Fig. 6). A higher proportion of the number of fires on public roads compared to all forest fires was found in the fires where fewer than five fire brigades were involved in the operation. For the fires involving more units, the proportion of the number of fires was higher for all fires than for all fires than for fires on public roads.

Occurrence of forest fires along public roads against the background of all fires according to the number of rescue and firefighting units
In the analysis of the occurrence of forest fires on fire breaks, it is also worth looking at the forest fire hazard category (FFHC) of the individual forest districts in which fires have occurred on fire breaks. The percentage of fires in the fire breaks was practically independent of the fire hazard category (Tab. 1). However, there is a clear differentiation in the percentage of fires on fire breaks by FFHC in relation to the number of forest districts categorised. Although the number of forest districts categorised in the highest and lowest FFHC is similar, the proportion of fires on fire breaks in the highest FFHC category I is clearly higher.
The occurrence of forest fires in the belts depending on the forest fire hazard category of the forest districts
| Forest fire hazard category | Share of fires in fire breaks (%) | Share of the number of forest districts according to FFHC (%) | Share of the number of fires in fire breaks by FFHC | |
|---|---|---|---|---|
| on fire lanes (%) | all fires (%) | |||
| I | 9.3 | 29 | 52.18 | 54.73 |
| II | 10.6 | 42 | 38.77 | 35.69 |
| III | 9.2 | 29 | 9.05 | 9.58 |
To summarise the analysis of the occurrence of fires on public roads, it can be stated that the special feature of these fires is that they are mostly (almost 90%) fires of ground cover, the average area of which does not exceed 0.05 ha in about 70 of cases. The occurrence of these fires is favoured by a well-developed layer of ground cover, especially grass and heavily weeded cover, as well as dead ground cover covered with litter or grass. Fires on roads are mostly (75%) discovered by bystanders using public roads and, thanks to mobile telephony, the fact of a fire is likely to be quickly reported to the emergency services. This has an impact on, among other things, easier access to the scene of the fire, the short duration of firefighting operations and their effectiveness, as action is taken in the early stages of fire spread. These conditions also have an impact on the lower number of firefighting operations compared to rescue operations deep in the forest. For the other characteristics analysed, the differences are not as clear for fires on roads and in other forests.
The analysis of damage caused by fires in the State Forests was based on data collected in NFFIS for the years 2017–2023. After considering the reports of fires that met the methodological assumptions, 13,436 fires were selected for detailed analyses. Of this, 1,344 fires occurred on public roads, covering an area of 90.48 ha. The remaining fires (12,092) occurred in other forest areas covering an area of 3,143.92 ha. Comparing this number of fires to the area of stands along public roads where paths were created and areas cleared (209,318.42 ha) and the area of other forests (7,406,864.83 ha), the density of fires along roads per 1,000 ha of forest area is 6.42 and for other forests is 1.63. This confirms that fires occur more frequently along public roads than in other forest areas due to easier access to the forest. Of the fires that occurred near roads, 626 had an area of 0.01 ha, representing nearly 50%. However, in terms of losses, 668 resulted in zero losses, which also accounts for nearly 50% of the total number of fires in this group. For fires in forest areas away from roads, 3,626 had an area of 0.01 ha, while 5,225 fires reported no losses. This represents 30% of the fires in this group by area and 43% by loss volume, respectively. These figures indicate a left-skewed distribution; therefore, the nonparametric Mann–Whitney test was used for detailed statistical analysis. The comparison of the rank sum, which was carried out using the Mann–Whitney test, provides a basis for the statement that the size of the fire is significantly dependent on the location of the fire occurrence, because the p-statistic value of this test, which results from the calculations, is 0.00, so that the differences are statistically significant at the assumed significance level of 0.05. Figure 7 shows the distribution of fire size depending on the place of origin, expressed by the median, the 25th and 75th percentile range, as well as the maximum and minimum values for both groups. To improve the readability of the graph, the scale of the Y-axis (fire area) was adapted to the fluctuation range of the fire area along roads. Of the fires that occurred outside the lanes, 119 fires covered an area of more than 3.00 ha, which is shown in the graph. This means that this value accounted for less than 1% of the total number of fires that occurred there, and the largest fire covered 51.40 ha.

Distribution of the burnt area depending on the place of origin
Losses totalled PLN 813,727.82 from road fires (annual average PLN 162,745) and PLN 26,213,778.82 in other forests (annual average PLN 5,242,755), which, taking into account the number of fires, amounts to PLN 605.45 for road fires and PLN 2,167.86 per fire in other forests. The losses caused by road fires account for only 3% of the total losses caused by forest fires. This means that the losses caused by road fires are on average more than 3.5 times smaller than the losses caused by other fires. Comparison of the rank sum, which was carried out using the Mann–Whitney test, provides a basis for the statement that the losses caused by forest fires depend significantly on the fire location, because the p-statistic value of this test, which results from the calculations, is 0.00, meaning that the differences are statistically significant at the assumed significance level of 0.05. Figure 8 shows the amount of losses caused by fire depending on the location of the fire, expressed as median, 25th and 75th percentiles. To improve readability, the scale of the Y-axis (fire area) in this graph has been adapted to the range of variation in the amount of damage caused by fires near roads. Of the fires that occurred outside the belts, only in 25 cases were the losses greater than PLN 80 thousand, which means that it was about 0.2% of the total number of fires that occurred there.

Distribution of the amount of damage depending on the location of the fire
According to the General Directorate of State Forests, the total cost of creating and maintaining fire breaks and cleaning up the area in the period 2018–2022 amounted to PLN 35,837,932, which is an average of PLN 7,167,586 per year. Table 2 shows the average annual costs of lanes and clean-up along public roads in the Regional Directorates of State Forests in the period 2018–2022.
Average annual costs of creating new and maintaining existing fire breaks and cleaning up the area in the period 2018–2022 according to the Regional Directorates of State Forests
| Regional Directorate of State Forests | Cost (PLN) | Contribution to forest fire protection costs (%) | |||
|---|---|---|---|---|---|
| installing new belts | maintaining existing lanes | tidying up the area along public roads | installing and maintaining seat belts | establishing and maintaining lanes and tidying up the area | |
| Białystok | 2,744 | 97,320 | 553,180 | 1.88 | 12.29 |
| Gdańsk | 9,605 | 73,115 | 329,213 | 3.13 | 15.60 |
| Katowice | 28,297 | 138,858 | 562,021 | 1.51 | 6.57 |
| Kraków | 0 | 9,636 | 143,554 | 1.56 | 24.74 |
| Krosno | 312 | 29,561 | 83,584 | 2.05 | 7.80 |
| Lublin | 778 | 47,257 | 248,211 | 1.36 | 8.36 |
| Łódź | 1,726 | 41,124 | 296,521 | 1.42 | 11.24 |
| Olsztyn | 7,758 | 70,038 | 308,271 | 1.44 | 7.15 |
| Piła | 714 | 223,193 | 324,387 | 3.33 | 8.15 |
| Poznań | 5,565 | 54,216 | 142,806 | 1.27 | 4.30 |
| Radom | 80 | 12,767 | 184,550 | 0.26 | 3.99 |
| Szczecin | 1,563 | 123,723 | 351,954 | 0.94 | 3.58 |
| Szczecinek | 4,779 | 169,290 | 373,115 | 2.10 | 6.61 |
| Toruń | 9,834 | 248,115 | 784,254 | 3.03 | 12.23 |
| Warszawa | 937 | 15,032 | 302,921 | 0.35 | 6.97 |
| Wrocław | 1,355 | 75,215 | 99,195 | 1.09 | 2.51 |
| Zielona Góra | 1,400 | 72,824 | 501,119 | 0.68 | 5.24 |
| Country | 77,446 | 1,501,285 | 5,588,855 | 1.55 | 7.02 |
The total cost of fire breaks and clearing accounted for 7.02% of the expenditure on fire protection in the State Forests. The largest portion of expenditures was for the removal of fire-hazardous forest materials, which accounted for as much as 78% of the total costs of fire protection on public roads.
The next element of the analysis was to differentiate the costs of establishing new and maintaining existing fire breaks and the costs of clearing public roads according to FFHC. The amount of these costs was related to the forest area of the forest districts. The share of these expenses in the total costs of fire protection is shown in Table 3, while their graphical representation can be seen in Fig. 9.

Distribution of the share of the costs for the construction of new and maintenance of existing fire breaks as well as the costs for the cleaning of areas near public roads in the total costs of fire protection for forest districts depending on FFHC
Average cost of establishing new and maintaining existing fire breaks and clearing areas near public roads in relation to the forest area of forest districts depending on the forest fire hazard category
| Forest fire hazard category of the forest district | Average cost of belts (PLN/ha) | Average cost of belts and tidying up (PLN/ha) | Average share of fire protection costs (%) |
|---|---|---|---|
| I | 2,525 | 11,280 | 5.86 |
| II | 2,617 | 11,069 | 8.11 |
| III | 1,039 | 6,177 | 16.54 |
The significance of the statistical differentiation of the costs of building lanes and clearing areas along public roads and the proportion of these costs in the total costs of fire protection was determined using the Kruskal–Wallis test, the results of which, expressed by the values of the p-statistic, are shown in Table 4. These data show that this differentiation is not statistically significant.
Results of the p-statistics for the comparison of the share of costs for the construction of lanes and the cleaning of areas along public roads in the total costs of fire protection in relation to the grouping variable of the forest fire hazard category
| Dependent variable: share of costs | p-Value for multiple comparisons (bilateral); cost share | ||
|---|---|---|---|
| I | II | III | |
| I | 0.075019 | 0.198098 | |
| II | 0.075019 | 1.000000 | |
| III | 0.198098 | 1.000000 | |
The regulation currently in force in Poland to keep a 30-m zone free of dead plant parts from the roadway is considered one of the strictest. In other European countries, it is often mentioned that a lane should be kept free of tree and shrub growth at a distance from the roadway, which is not taken into account in Polish regulations. The areas of mowed ditches, the branch-free space above and next to the roadway are also taken into account. In nine countries (Bulgaria, Latvia, France, Portugal, England, Romania, Italy, Switzerland and Ukraine), lanes are created in the form of cleared areas next to a public road that runs through a forest or in its immediate vicinity. The width of the cleared lane varies and ranges from 2 m (Italy) to 20 m (France) (Tyburski and Szczygieł 2023).
A review of the data on the methods of securing forest areas along public roads in selected European countries and a national analysis of the occurrence of fires in these areas allow for a re-examination of the current regulations in this area, not only in terms of ensuring an adequate level of fire protection in the forests, but also taking into account the economic calculation of the establishment of type A fire belts and clearing the area in its current form.
In the analysed period, 11,106 fires with an area of 3,780.44 ha occurred in the State Forests, of which 768 fires with a total area of 55.46 ha occurred along roads. The average area of a fire in all forests was 0.34 ha, while along roads it was 0.07 ha, which is about five times less. The share of fires along roads in the total number of fires was 6.92%, and the share of burnt area was 1.47%. As detailed analyses show, fires along public roads are not only characterised by a significantly smaller burnt area, but also require fewer fire brigade interventions and the duration of rescue and extinguishing work is shorter than for fires that occur deep in the forest. This difference is probably due in part to the faster detection of fires along roads, as around 75% of these incidents are discovered by bystanders. Field inspections of fires near public roads revealed that only 4.3% were directly related to the road, having been caused by a car accident. The vast majority of fires spread from deep within the forest towards the road, which may be because removing dead biomass near a public road can facilitate forest accessibility, potentially increasing fire risk. Fires along public roads occurred most frequently (52%) in the forest areas in I FFHC. In II FFHC, 39% of fires occurred and the fewest (9%) occurred in forests of III FFHC. The average value of damage caused by fires along roads was PLN 605.45 and for fires in other forests was PLN 2,167.86.
In the last 50 years, there had been a clear downward trend in the average forest fire area along public roads: in 1975–1982 it was 1.34 ha, in 1990–2022 it was 0.36 ha and in 2003–2004 it was 0.26 ha (Piwnicki et al. 2006), to reach a minimum value of 0.07 ha in the period 2017–2023, which is largely explained by changing conditions. In the period 2018–2022, the costs of establishing and maintaining type A strips and cleaning up the State Forests amounted to PLN 35.84 million, which accounted for 7% of the total expenditure on forest fire protection. Expenditure on clearing work (PLN 27.95 million) was significantly higher than that on type A strips (PLN 7.89 million). The average annual costs amounted to PLN 77,446 for the construction of new lanes, PLN 1,501,285 for their maintenance and PLN 5,588,855 for cleaning up the area, totalling PLN 7,167,586. However, the average annual losses due to fires on public roads amounted to PLN 162,745, that is, they were almost 44 times lower than the expenditure on fire breaks and cleaning up the area, which raises serious doubts about the rationality of the measures taken and their effective impact on increasing fire safety in forest areas where type A fire breaks are created and the area is cleaned up.
The above arguments force us to take a critical look at the current national regulations, which were created many years ago in a different socioeconomic environment and do not fully correspond to today’s conditions and the functioning forest fire protection system, which must also take into account the economic calculation. This calculation must take into account the acceptable level of risk, which refers to the potential losses in the event of a fire, and these are incomparably low in relation to the costs of creating and maintaining fire breaks and cleaning up the area. The method of creating fire breaks along public roads has been changed twice in the last 20 years. The mineralised furrow has been removed, and the width of the cleared strip of trees has been reduced from 50 to 30 m. These changes have not led to a deterioration in forest fire protection, which is confirmed by the average area of fires along public roads, which has decreased from 1.34 to 0.07 ha over the last 50 years. Studies have shown that the maintenance of type A fire belts and 30-m-wide strips of cleared land in accordance with current regulations is not justified or rational. The current practice of creating these belts does not produce clear effects in terms of a significant improvement in forest fire safety, which makes it necessary to reflect on their justification and adaptation to actual needs. Flammable forest biomass is removed along a 30-m belt and often accumulated in embankments and piles, which increases the fire hazard and produces the opposite effect to that intended by those who created the relevant regulations. There have been instances where embankments or piles have been set on fire, which is why the ‘Forest Fire Protection Instructions’ (2020) include a provision prohibiting such practices. However, the question of how to manage the collected biomass remains a key issue for land managers, primarily due to the costs of maintaining the belts. Even if left in place, dispersed biomass poses a lower fire risk than when it is collected in various forms and at greater distances than the regulations specify.
In view of the arguments put forward, it is recommended to refrain from the creation of type A belts and the organisation of the terrain, which requires legislative measures to amend the current legal regulations.
Alternative solutions at the discretion of the forest manager, depending on the fire risk assessment, could be the following:
7. Maintaining the obligation to establish type A strips and to clear the area in forest areas classified as category I forest fire risk.
8. Maintaining the obligation to clean-up only in younger stands where early or late cleaning has been carried out, which consists of removing the remains of these practices. If the biomass is removed from the stand, it can be chipped, for example, and if it is brought into the area of older stands, it should not be deposited in the form of piles or embankments. The biomass should be spread evenly over the area.
9. Leave the requirement to establish type A strips only in stands adjacent to an industrial or storage facility, storage facilities and public utility buildings.
10. Reduce the required width of the area to be cleared from 30 to 15 m, also taking into account the width of the roadside.