
Figure 1.

Figure 2.

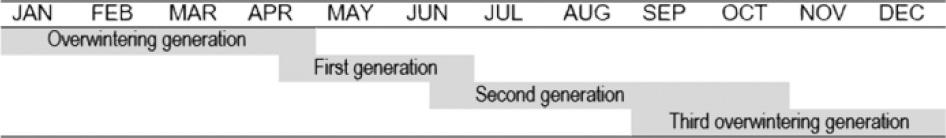
Figure 3.

Figure 4.
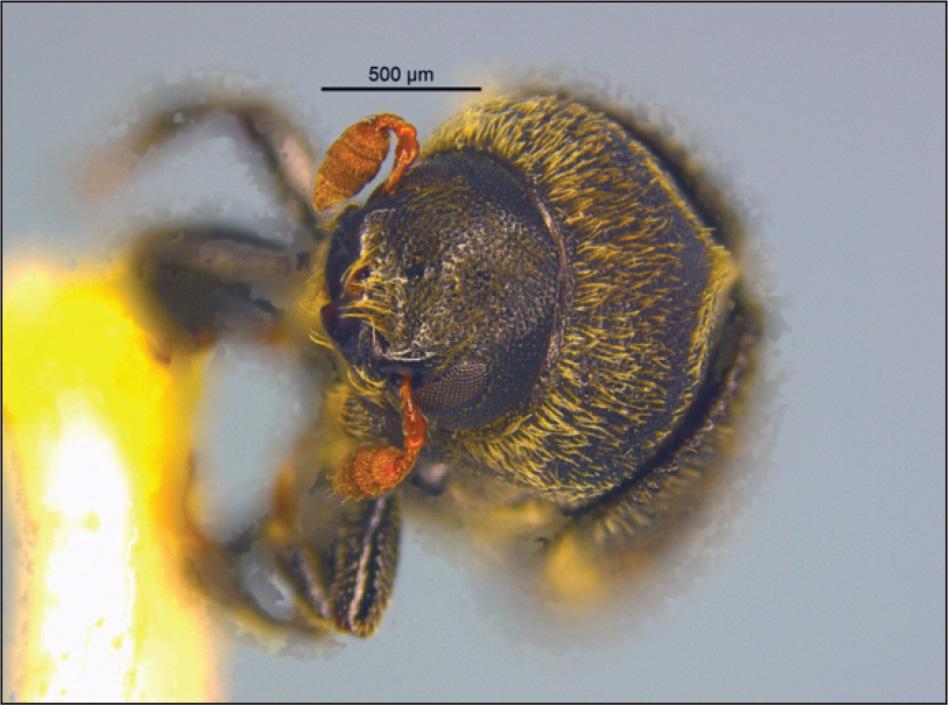
Figure 5.

Figure 6.
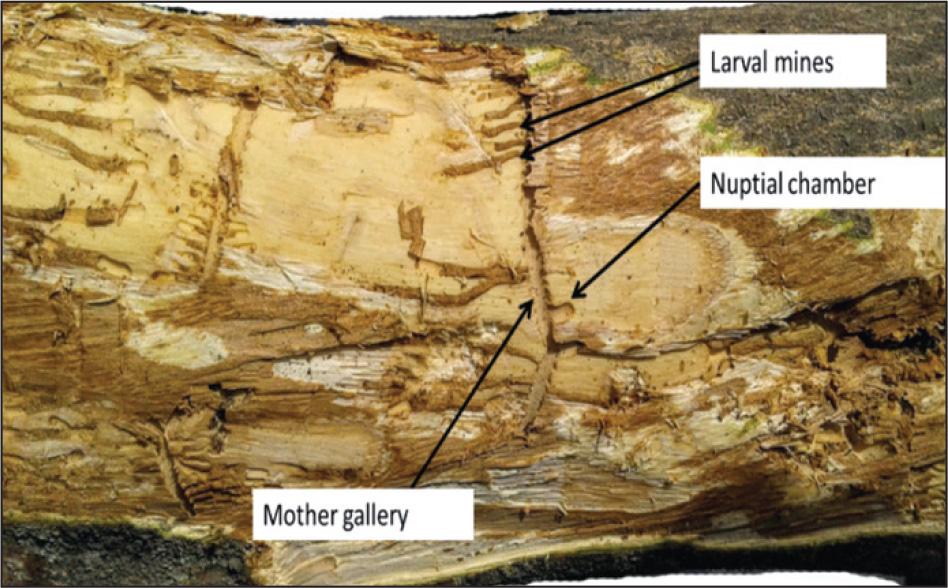
Figure 7.
Measurement of galleries of H_ macmahoni
| Variable | n | Minimum (cm) | Maximum (cm) | Mean (cm) | SD (cm) |
|---|---|---|---|---|---|
| Maternal gallery | 10 | 2.7 | 8 | 5.61 | 1.87 |
| Larval gallery | 10 | 4.4 | 7 | 5.25 | 0.74 |
Interspecific nucleotide differences of H_ macmahoni and its related species
| Variable | H. macmahoni HT-1 | H. macmahoni HT-2 | H. varius | H. wachtliorni | H. crenatus |
|---|---|---|---|---|---|
| H. macmahoni HT-1 | x | 2.2 | 13.1 | 14.6 | 16 |
| H. macmahoni HT-2 | 2.2 | x | 13.8 | 12.3 | 14.7 |