
Table 1.
Classification error matrix in Google Earth Engine
| Class 0 | Class 1 | Class 2 | Class 3 | |
|---|---|---|---|---|
| Class 0 | n00 | n01 | n02 | n13 |
| Class 1 | n10 | n11 | n12 | n23 |
| Class 2 | n20 | n21 | n22 | n23 |
| Class 3 | n30 | n31 | n32 | n33 |
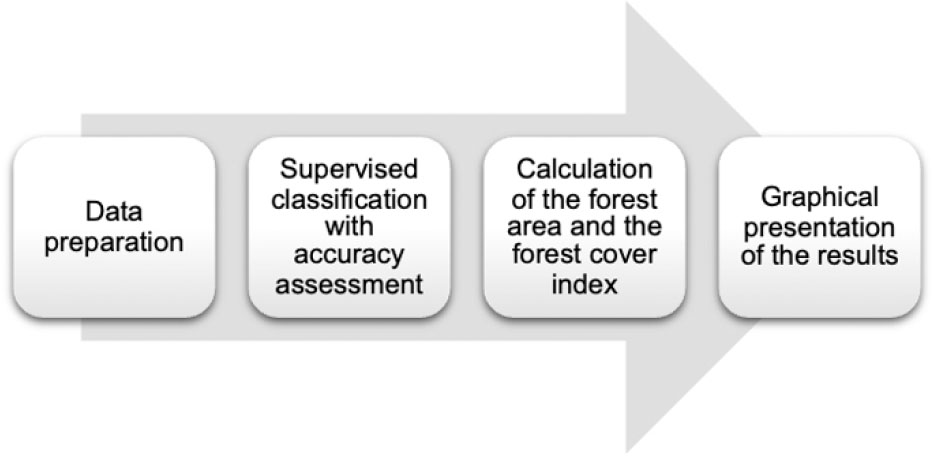
Figure 1.
Schematic of the algorithm
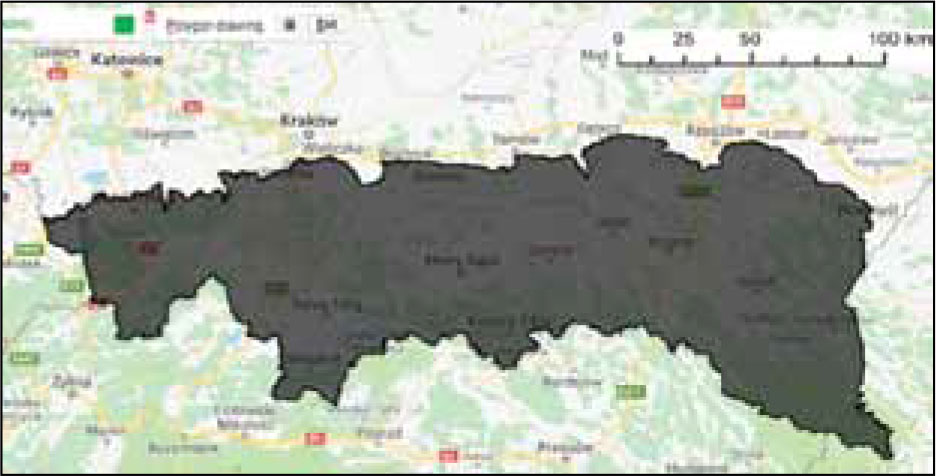
Figure 2.
Study area–Polish Carpathian region
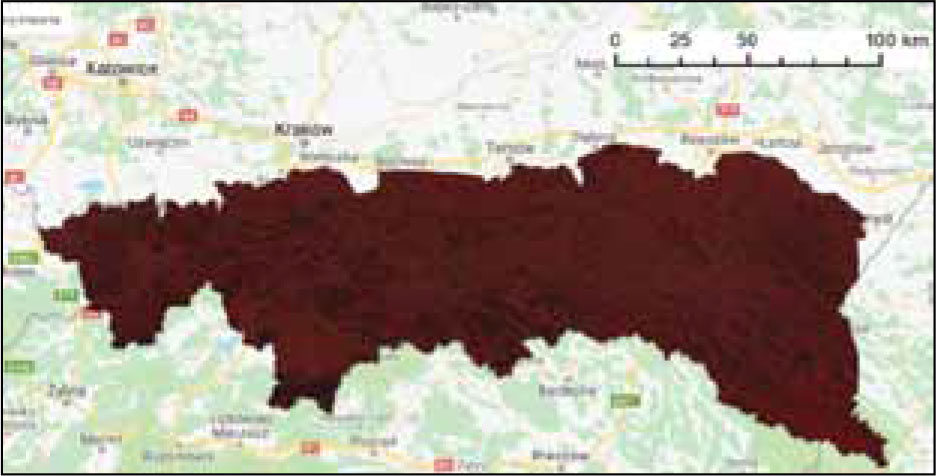
Figure 3.
Colour composition from near infrared, green and blue channels
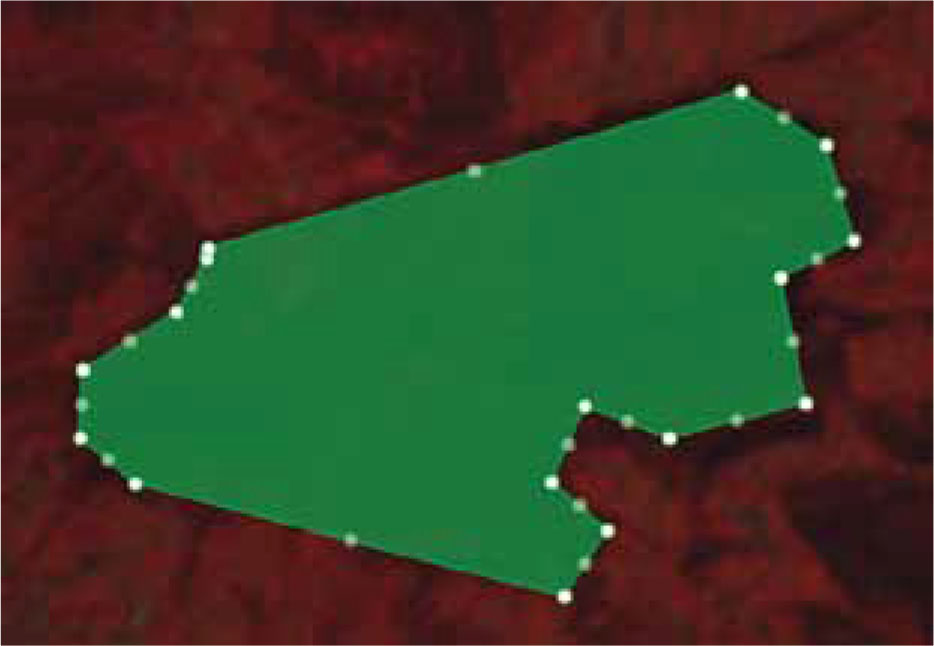
Figure 4.
Example of a drawn training field
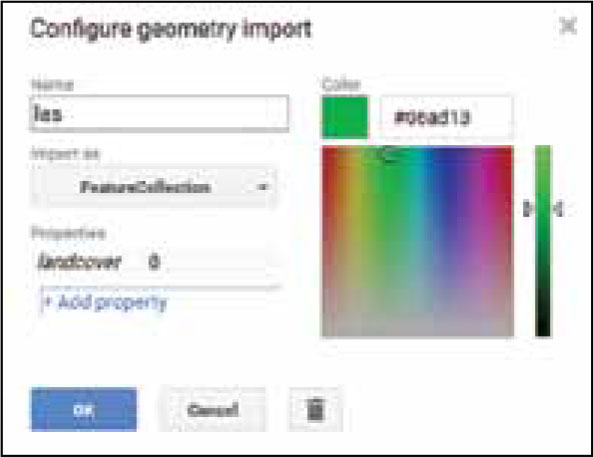
Figure 5.
Dialogue box for adding a new layer
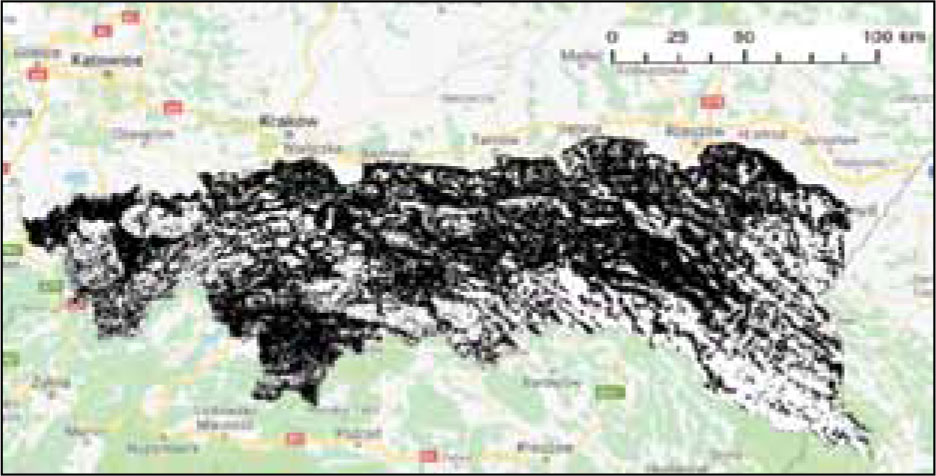
Figure 6.
Binary image (white represents forests)
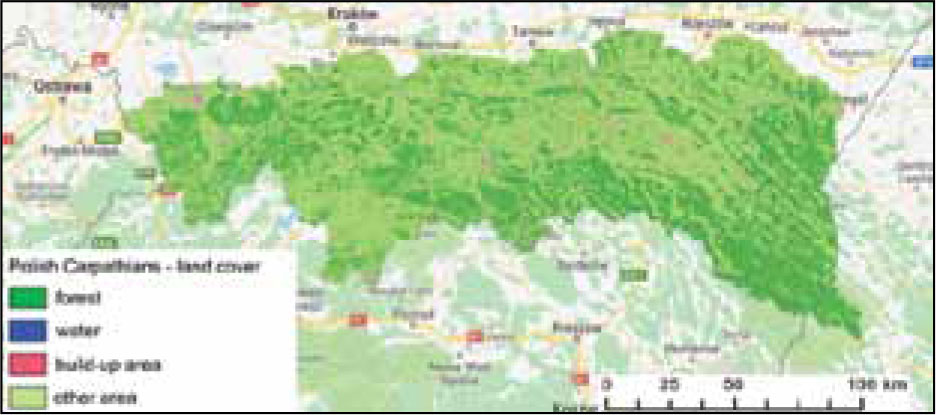
Figure 7.
Classified image in the Google Earth Engine map window
Table 2.
Error matrix for validation data
| Forest | Water | Other area | Built-up area | |
|---|---|---|---|---|
| Forest | 13 302 | 0 | 313 | 5 |
| Water | 6 | 13 247 | 45 | 45 |
| Other areas | 541 | 14 | 7599 | 90 |
| Built-up area | 1 | 10 | 143 | 723 |
Table 3.
Results of the accuracy analysis
| Class | Manufacturer accuracy | User accuracy |
|---|---|---|
| Forest | 0.976 | 0.960 |
| Water | 0.993 | 0.998 |
| Other | 0.922 | 0.938 |
| Construction | 0.824 | 0.837 |
| Overall accuracy | 0.966 | |
| Kappa | 0.950 | |
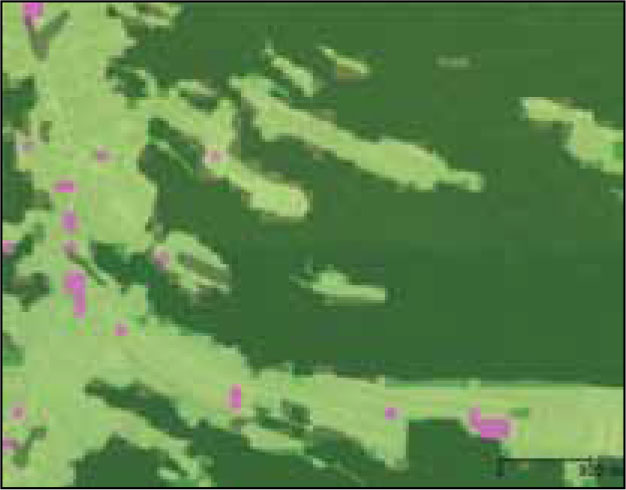
Figure 8.
Comparison of the classified image with the forest mask of the FORECOM project