
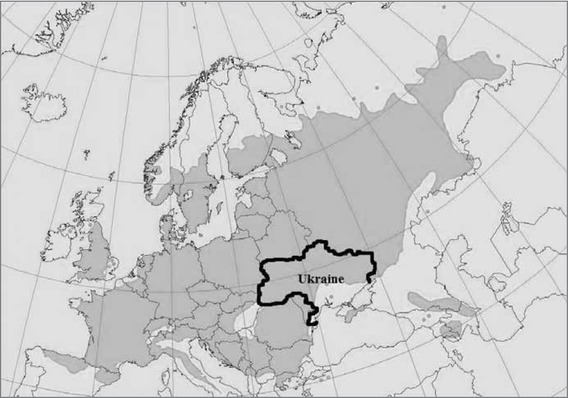
Figure 1
Distribution map of Tilia cordata Mill. (dark-grey) in Europe (Svejgaard 2003; Radoglou et al. 2009; De Jaegere et al. 2016)
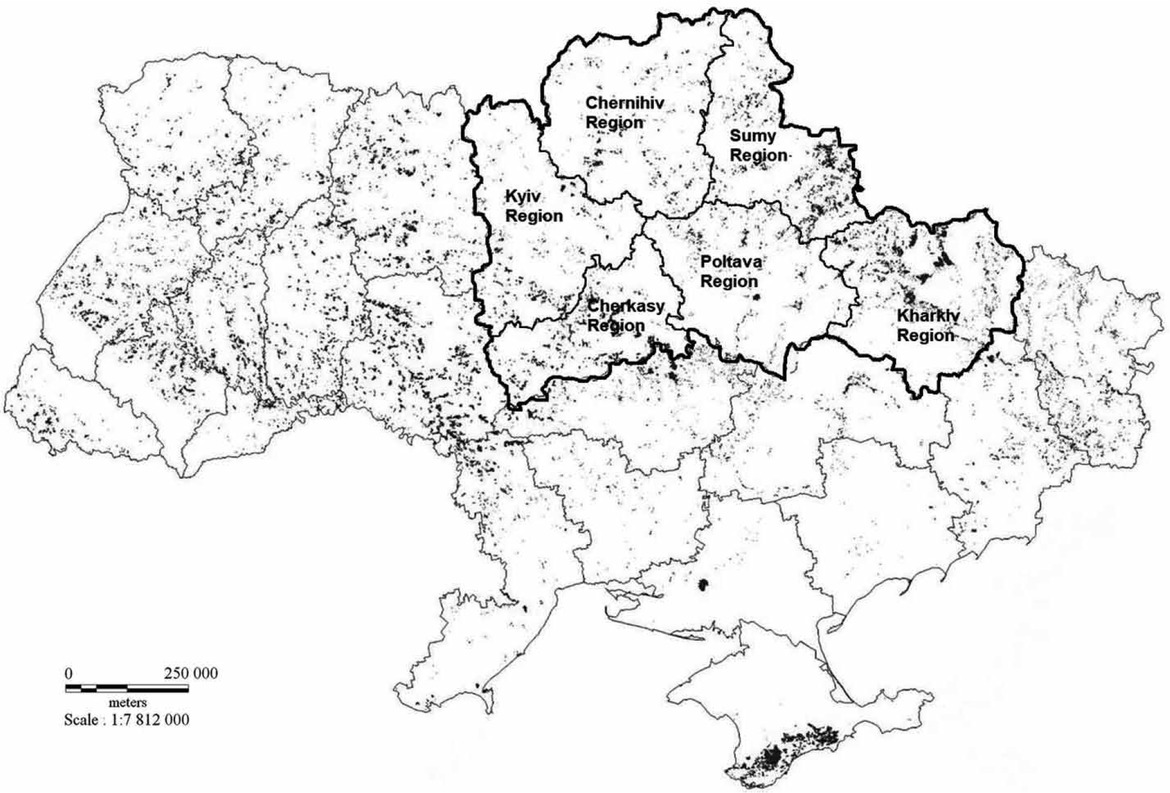
Figure 2
Location of the study site (grey pattern is the distribution of oak and lime stands within Ukraine and the study area)
Table 1
Current state of small-leaved lime (Tilia cordata) stands in Ukraine (as of 2016)
| Administrative regions | Total forest area (ha) | Including small-leaved lime stands | |
|---|---|---|---|
| ha | Percent of the total area | ||
| Autonomous of Crimea Republic | 227,700 | 150 | 0.1 |
| Cherkasy Region | 255,400 | 2,660 | 1.0 |
| Chernihiv Region | 355,500 | 1,680 | 0.5 |
| Chernivtsi Region | 157,300 | 350 | 0.2 |
| Dnipropetrovsk Region | 65,700 | 50 | 0.1 |
| Donetsk Region | 92,500 | 110 | 0.1 |
| Ivano-Frankivsk Region | 425,800 | 1,830 | 0.4 |
| Kharkiv Region | 282,300 | 1,660 | 0.6 |
| Kherson Region | 77,300 | – | <0.1 |
| Khmelnytskyi Region | 167,400 | 260 | 0.2 |
| Kyiv Region | 355,100 | 1,150 | 0.3 |
| Kirovohrad Region | 103,500 | 740 | 0.7 |
| Luhansk Region | 228,200 | 150 | 0.1 |
| Lviv Region | 428,200 | 1,280 | 0.3 |
| Mykolaiv Region | 37,400 | – | <0.1 |
| Odesa Region | 90,200 | 80 | 0.1 |
| Poltava Region | 157,300 | 2,220 | 1.4 |
| Rivne Region | 584,200 | 200 | <0.1 |
| Sumy Region | 255,600 | 4,240 | 1.7 |
| Ternopil Region | 143,600 | 460 | 0.3 |
| Transcarpathian Region | 461,200 | 20 | <0.1 |
| Vinnytsia Region | 199,700 | 580 | 0.3 |
| Volyn Region | 436,800 | 100 | <0.1 |
| Zaporizhzhia Region | 34,000 | 10 | <0.1 |
| Zhytomyr Region | 660,300 | 450 | 0.1 |
| Total Ukraine | 6,282,200 | 20,430 | 0.3 |
Table 2
Distribution of lime stands by origin within the study area
| Administrative regions | Origin of small-leaved lime (Tilia cordata) stands | Total small-leaved lime | ||||||
|---|---|---|---|---|---|---|---|---|
| vegetative | natural seed | planted seed | (Tilia cordata) stands | |||||
| ha | % | ha | % | ha | % | ha | % | |
| Cherkasy Region | 1,129 | 42.4 | 265 | 10.0 | 1,266 | 47.6 | 2,660 | 100 |
| Chernihiv Region | 1,405 | 83.6 | 136 | 8.1 | 139 | 8.3 | 1,680 | 100 |
| Kharkiv Region | 1,305 | 78.6 | 38 | 2.3 | 317 | 19.1 | 1,660 | 100 |
| Kyiv Region | 574 | 49.9 | 210 | 18.3 | 366 | 31.8 | 1,150 | 100 |
| Poltava Region | 1,784 | 80.4 | 29 | 1.3 | 407 | 18.3 | 2,220 | 100 |
| Sumy Region | 2,847 | 67.1 | 609 | 14.4 | 784 | 18.5 | 4,240 | 100 |
| Total | 9,044 | 66.5 | 1,287 | 9.5 | 3,279 | 24.0 | 13,610 | 100 |
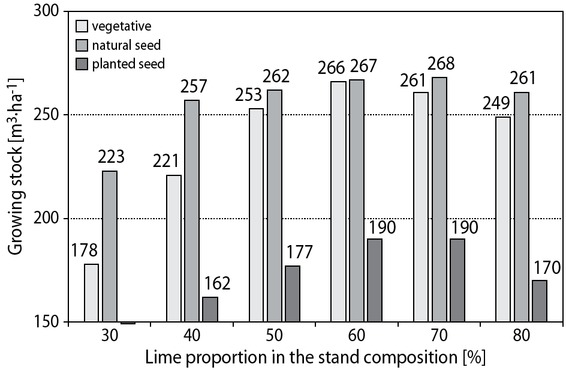
Figure 3
Productivity of stands with different lime proportion in their composition
Table 3
Percentage of oak-lime stands in the total area of oak forests
| Administrative regions | Area of oak stands [ha] | Area of oak- lime stands [ha] | Percentage of oak-lime stands |
|---|---|---|---|
| Cherkasy Region | 117,690 | 59,860 | 50.9 |
| Chernihiv Region | 54,560 | 11,740 | 21.5 |
| Kharkiv Region | 150,800 | 52,310 | 34.7 |
| Kyiv Region | 64,380 | 14,440 | 22.4 |
| Poltava Region | 55,780 | 24,910 | 44.7 |
| Sumy Region | 95,500 | 46,520 | 48.7 |
| Total | 538,710 | 209,780 | 38.9 |
Table 4
Distribution of the area of oak stands with different proportions of lime in their composition (numerator – ha, denominator – % of the area)
| Origin of small-leafed lime (Tilia cordata) stands | Unit | Lime proportion in oak stands | ||||||
|---|---|---|---|---|---|---|---|---|
| 10% | 20% | 30% | 40% | 50% | 60% | total | ||
| 1 | 2 | 3 | 4 | 5 | 6 | 7 | 8 | 9 |
| Cherkasy Region | ||||||||
| Vegetative | ha | 14,894 | 11,734 | 3,285 | 731 | 155 | 60 | 30,860 |
| % | 48.3 | 38.0 | 10.6 | 2.4 | 0.5 | 0.2 | 100 | |
| Natural seed | ha | 8,503 | 6,205 | 1,848 | 506 | 101 | 10 | 17,172 |
| % | 49.5 | 36.1 | 10.8 | 2.9 | 0.6 | 0.1 | 100 | |
| Planted seed | ha | 4,078 | 4,126 | 1,959 | 963 | 488 | 214 | 11,828 |
| % | 34.5 | 34.9 | 16.6 | 8.1 | 4.1 | 1.8 | 100 | |
| Total | ha | 27,474 | 22,065 | 7,092 | 2,201 | 744 | 284 | 59,860 |
| % | 45.9 | 36.9 | 11.8 | 3.7 | 1.2 | 0.5 | 100 | |
| Chernihiv Region | ||||||||
|---|---|---|---|---|---|---|---|---|
| Vegetative | ha | 3,330 | 2,177 | 922 | 337 | 174 | 28 | 6,969 |
| % | 47.8 | 31.2 | 13.2 | 4.8 | 2.5 | 0.4 | 100 | |
| Natural seed | ha | 1,208 | 1,018 | 661 | 380 | 48 | 8 | 3,324 |
| % | 36.3 | 30.6 | 19.9 | 11.4 | 1.5 | 0.2 | 100 | |
| Planted seed | ha | 589 | 484 | 232 | 91 | 33 | 24 | 1,452 |
| % | 40.5 | 33.3 | 16.0 | 6.2 | 2.3 | 1.7 | 100 | |
| Total | ha | 5,126 | 3,679 | 1,813 | 808 | 254 | 60 | 11,740 |
| % | 43.7 | 31.3 | 15.4 | 6.9 | 2.2 | 0.5 | 100 | |
| 1 | 2 | 3 | 4 | 5 | 6 | 7 | 8 | 9 |
|---|---|---|---|---|---|---|---|---|
| Kharkiv Region | ||||||||
| Vegetative | ha | 22,774 | 11,231 | 3,730 | 1,053 | 196 | 42 | 39,025 |
| % | 58.4 | 28.8 | 9.6 | 2.7 | 0.5 | 0.1 | 100 | |
| Natural seed | ha | 4,541 | 2,823 | 723 | 276 | 155 | 26 | 8,543 |
| % | 53.2 | 33.0 | 8.5 | 3.2 | 1.8 | 0.3 | 100 | |
| Planted seed | ha | 1,917 | 1,467 | 872 | 222 | 166 | 99 | 4,742 |
| % | 40.4 | 30.9 | 18.4 | 4.7 | 3.5 | 2.1 | 100 | |
| Total | ha | 29,232 | 15,521 | 5,324 | 1,551 | 517 | 167 | 52,310 |
| % | 55.9 | 29.7 | 10.2 | 3.0 | 1.0 | 0.3 | 100 | |
| Kyiv Region | ||||||||
|---|---|---|---|---|---|---|---|---|
| Vegetative | ha | 4,481 | 1,173 | 422 | 187 | 11 | 29 | 6,303 |
| % | 71.1 | 18.6 | 6.7 | 3.0 | 0.2 | 0.5 | 100 | |
| Natural seed | ha | 2,850 | 1,116 | 489 | 185 | 83 | 18 | 4,741 |
| % | 60.1 | 23.5 | 10.3 | 3.9 | 1.8 | 0.4 | 100 | |
| Planted seed | ha | 2,020 | 802 | 329 | 131 | 82 | 31 | 3,396 |
| % | 59.5 | 23.6 | 9.7 | 3.9 | 2.4 | 0.9 | 100 | |
| Total | ha | 9,351 | 3,091 | 1,240 | 503 | 177 | 78 | 14,440 |
| % | 64.8 | 21.4 | 8.6 | 3.5 | 1.2 | 0.5 | 100 | |
| Poltava Region | ||||||||
|---|---|---|---|---|---|---|---|---|
| Vegetative | ha | 8,823 | 6,398 | 2,772 | 760 | 208 | 28 | 18,988 |
| % | 46.5 | 33.7 | 14.6 | 4.0 | 1.1 | 0.1 | 100 | |
| Natural seed | ha | 1,333 | 971 | 423 | 165 | 35 | 13 | 2,940 |
| % | 45.3 | 33.0 | 14.4 | 5.6 | 1.2 | 0.5 | 100 | |
| Planted seed | ha | 1,191 | 890 | 479 | 254 | 106 | 61 | 2,982 |
| % | 39.9 | 29.9 | 16.1 | 8.5 | 3.6 | 2.1 | 100 | |
| Total | ha | 11,346 | 8,259 | 3,674 | 1,179 | 349 | 103 | 24,910 |
| % | 45.5 | 33.2 | 14.7 | 4.7 | 1.4 | 0.4 | 100 | |
| Sumy Region | ||||||||
|---|---|---|---|---|---|---|---|---|
| Vegetative | ha | 12,140 | 9,267 | 4,309 | 1,593 | 462 | 155 | 27,925 |
| % | 43.5 | 33.2 | 15.4 | 5.7 | 1.7 | 0.6 | 100 | |
| Natural seed | ha | 5,884 | 4,893 | 2,137 | 572 | 151 | 38 | 13,674 |
| % | 43.0 | 35.8 | 15.6 | 4.2 | 1.1 | 0.3 | 100 | |
| Planted seed | ha | 1,890 | 1,595 | 811 | 418 | 168 | 41 | 4,921 |
| % | 38.4 | 32.4 | 16.5 | 8.5 | 3.4 | 0.8 | 100 | |
| Total | ha | 19,913 | 15,754 | 7,256 | 2,582 | 781 | 233 | 46,520 |
| % | 42.8 | 33.9 | 15.6 | 5.6 | 1.7 | 0.5 | 100 | |
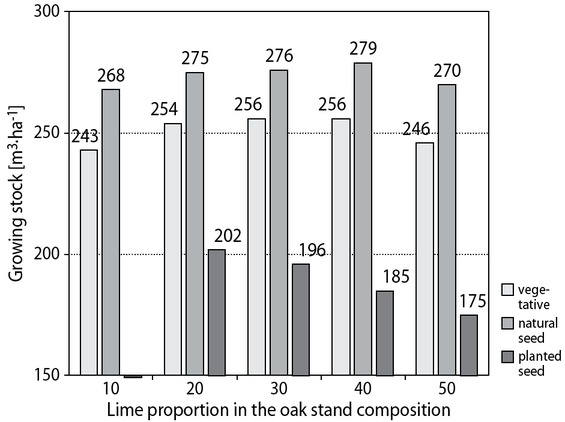
Figure 4
Productivity of oak stands with different lime proportion in their composition
Table 5
Natural regeneration aged below 15 years under the canopy of oak stands of different ages, compositions and relative densities of stocking
| Sample plot number | Characteristics of oak stands | The number of naturally regenerated seedlings | ||||
|---|---|---|---|---|---|---|
| total [trees ha-1] | including small-leaved lime | |||||
| stand composition | [years] age | density relative of stocking | trees [ha-1] | % | ||
| Oak stands aged 50–100 years | ||||||
| 1 | Oak 50%, ash 30%, N-maple 10%, lime 10% | 50 | 0.85 | 4,300 | 200 | 4.7 |
| 2 | Oak 40%, ash 30%, N-maple 20%, lime 10% | 60 | 0.65 | 8,300 | 200 | 2.4 |
| 3 | Oak 50%, ash 30%, lime 10%, N-maple 10% | 70 | 0.60 | 14,600 | 400 | 2.7 |
| 4 | Oak 80%, ash 10%, lime 10% | 70 | 0.60 | 14,800 | 400 | 2.7 |
| 5 | Oak 70%, lime 30% | 79 | 0.80 | 6,500 | 500 | 7.7 |
| 6 | Oak 90%, lime 10% | 92 | 0.62 | 12,900 | 200 | 1.6 |
| 7 | Oak 60%, lime 20%, ash 10%, N-maple 10% | 99 | 0.83 | 11,600 | 500 | 4.3 |
| Mean | 74 | 0.71 | 10,400 | 300 | 3.7 | |
| Oak stands aged 101–130 years | ||||||
|---|---|---|---|---|---|---|
| 8 | Oak 60%, lime 30%, N-maple 10% | 104 | 0.76 | 5,900 | 1,200 | 20.3 |
| 9 | Oak 70%, lime 20%, N-maple 10% | 104 | 0.75 | 22,100 | 1,100 | 5.0 |
| 10 | Oak 70%, lime 20%, N-maple 10% | 105 | 0.75 | 3,900 | 1,000 | 25.6 |
| 11 | Oak 70%, ash 10%, lime 10%, N-maple 10% | 108 | 0.70 | 16,700 | 300 | 1.8 |
| 12 | Oak 70%, lime 20%, ash 10% | 110 | 0.65 | 12,200 | 800 | 6.6 |
| 13 | Oak 60%, ash 20%, lime 20% | 115 | 0.66 | 8,600 | 2,100 | 24.4 |
| 14 | Oak 80%, lime 10%, N-maple 10% | 124 | 0.80 | 9,400 | 1,400 | 14.9 |
| Mean | 110 | 0.70 | 11,300 | 1,100 | 14.1 | |
| Oak stands aged 131–200 years | ||||||
|---|---|---|---|---|---|---|
| 15 | Oak 50%, ash 20%, lime 20%, N-maple 10% | 144 | 0.80 | 8,100 | 400 | 4.9 |
| 16 | Oak 50%, ash 20%, N-maple 20%, lime 10% | 157 | 0.74 | 10,200 | 200 | 2.0 |
| 17 | Oak 100% | 183 | 0.61 | 12,900 | 100 | 0.8 |
| 18 | Oak 90%, lime 10% | 188 | 0.66 | 25,000 | 600 | 2.4 |
| 19 | Oak 100% | 193 | 0.69 | 26,800 | 300 | 1.1 |
| 20 | Oak 50%, lime 30%, ash 10%, N-maple 10% | 198 | 0.59 | 13,000 | 200 | 1.5 |
| Mean | 177 | 0.70 | 16,000 | 300 | 2.1 | |