
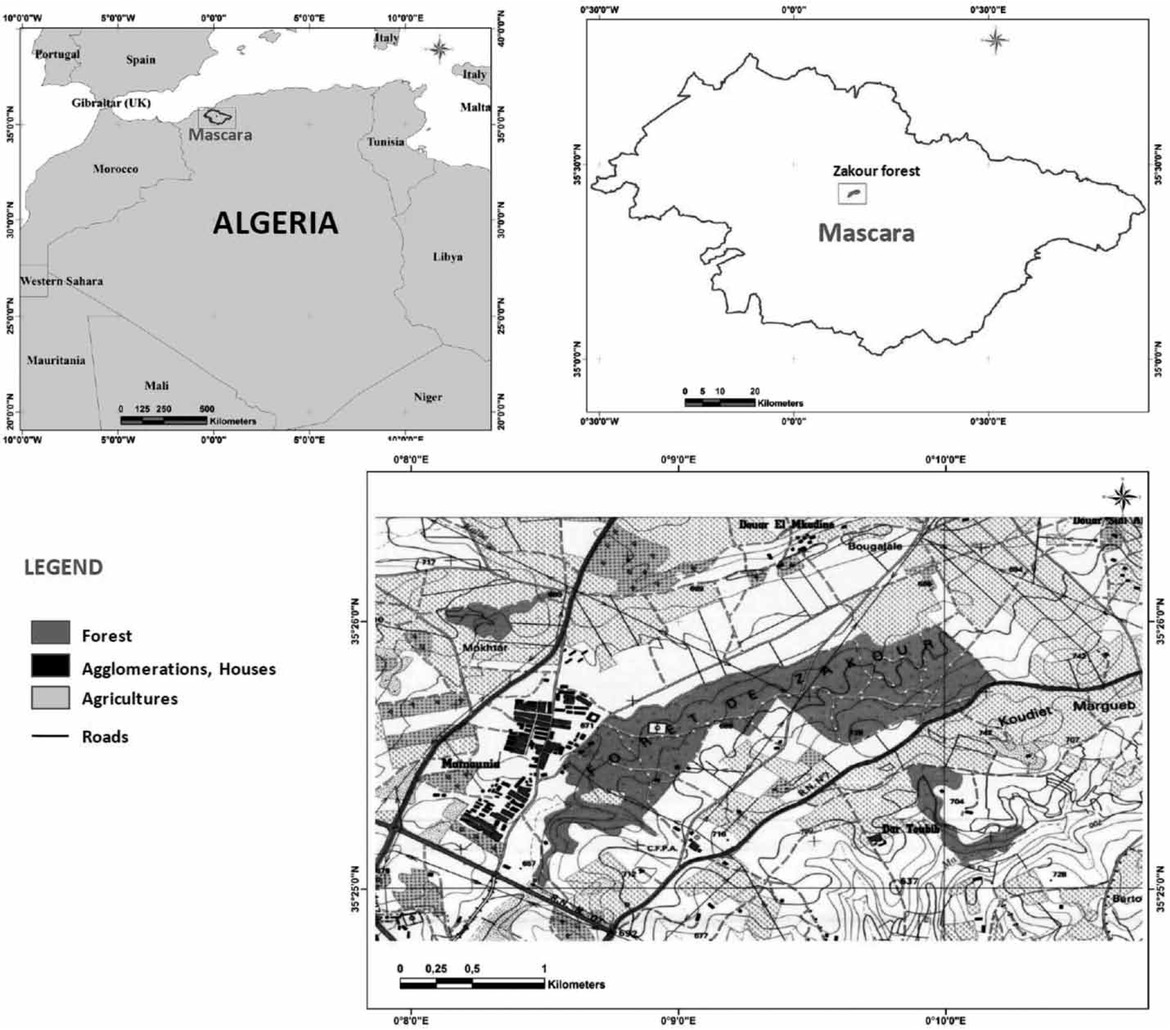
Figure 1
Geographical location of the Zakour forest (Mamounia – Mascara)
Table 1
Summary of the revised and adopted parameters for the model and their weights
| Parameters | Subfactors | Weight | Classes | Values | degrees Risk | |
|---|---|---|---|---|---|---|
| 1 | 2 | 3 | 4 | 5 | 6 | |
| Vegetation | density | 7 | high density | 3 | strong | |
| average density | 2 | medium | ||||
| low density | 1 | low | ||||
| vegetable essences | 7 | Quercus ilex | 5 | very strong | ||
| Pinus halepensis | 4 | strong | ||||
| Olea europea | 3 | medium | ||||
| Pelouse | 2 | low | ||||
| Slope (%) | 5 | ˃35% | 5 | very strong | ||
| 25–35% | 4 | strong | ||||
| 10–25% | 3 | medium | ||||
| 10–5% | 2 | low | ||||
| ˂5% | 1 | very low | ||||
| Exposition (°) | 5 | south-west | 180–270° | 4 | very strong | |
| south east | 90–180° | 3 | strong | |||
| north west | 270–360° | 2 | medium | |||
| northeast | 0–90° | 1 | low | |||
| Altitude (m) | 5 | ˂800 | 5 | very strong | ||
| 800–900 | 4 | strong | ||||
| 900–1,000 | 3 | medium | ||||
| 1,000–1,100 | 2 | low | ||||
| ˃1,100 | 1 | very low | ||||
| Distance from roads (m) | order 1 | 3 | 0–100 | 5 | very strong | |
| 100–200 | 4 | strong | ||||
| 200–500 | 3 | medium | ||||
| 500–1,000 | 2 | low | ||||
| ˃1,000 | 1 | very low | ||||
| order 2 | 3 | 0–50 | 5 | very strong | ||
| 50–100 | 4 | strong | ||||
| 100–200 | 3 | medium | ||||
| 200–500 | 2 | low | ||||
| ˃500 | 1 | very low | ||||
| Distance from built-up areas (m) | 3 | 0–100 | 5 | very strong | ||
| 100–500 | 4 | strong | ||||
| 500–1,000 | 3 | medium | ||||
| 1,000–2,000 | 2 | low | ||||
| ˃2,000 | 1 | very low | ||||
| Distance from houses/cultivated land (m) | 3 | 0–50 | 5 | very strong | ||
| 50–100 | 4 | strong | ||||
| 100–400 | 3 | medium | ||||
| 400–1,000 | 2 | low | ||||
| ˃1,000 | 1 | very low | ||||
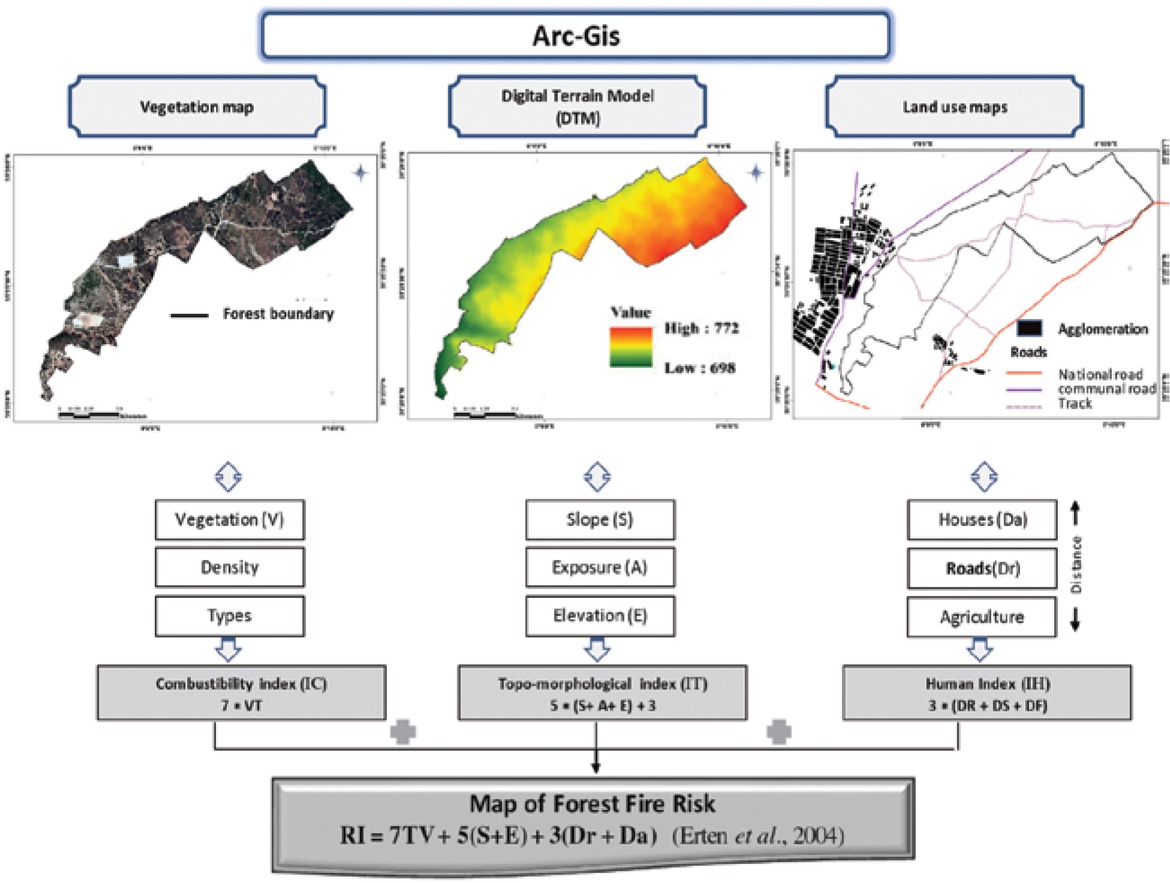
Figure 2
Flow chart of the methodological approach applied to draw up a fire risk map for the Zakour forest (Municipality of Mamounia)
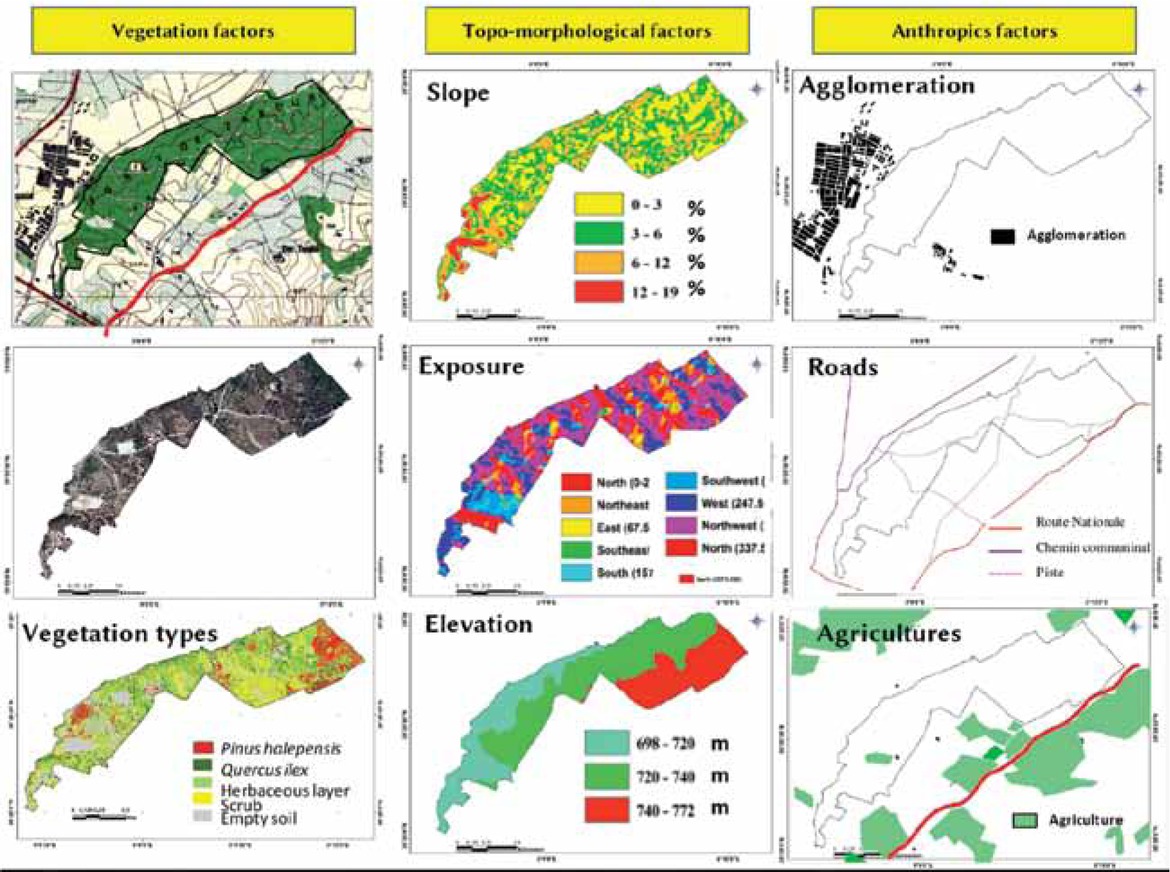
Figure 3
Fire risk factors
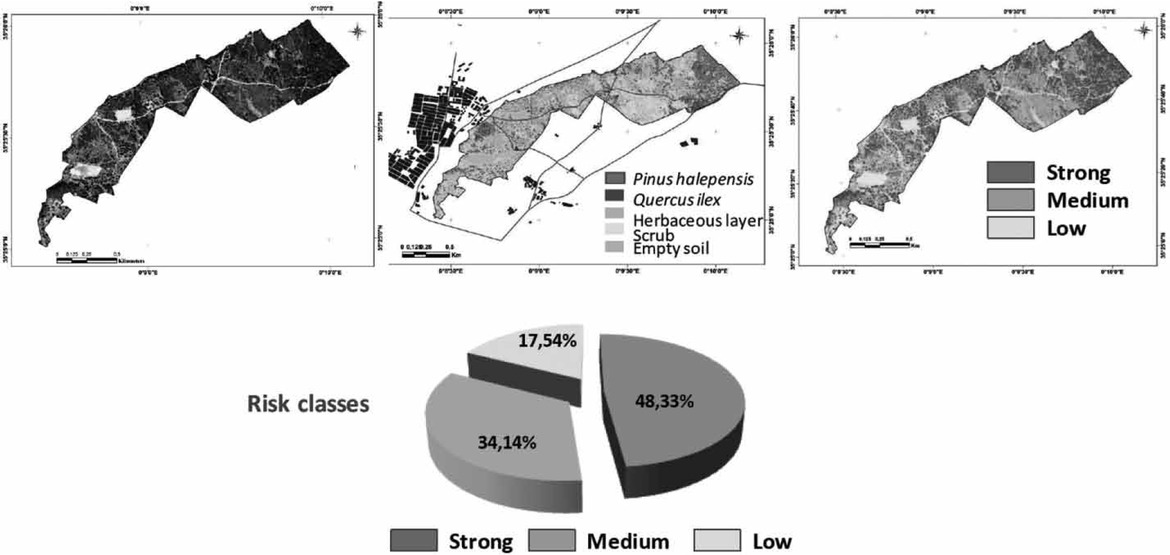
Figure 4
Combustibility risk map (CI) for the study area
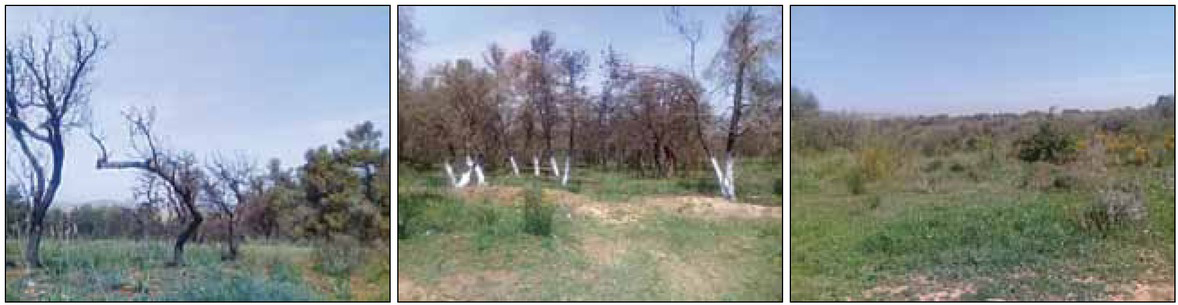
Figure 5
Vegetation types in the study forest (Cork oak, Aleppo pine, Brushwood)
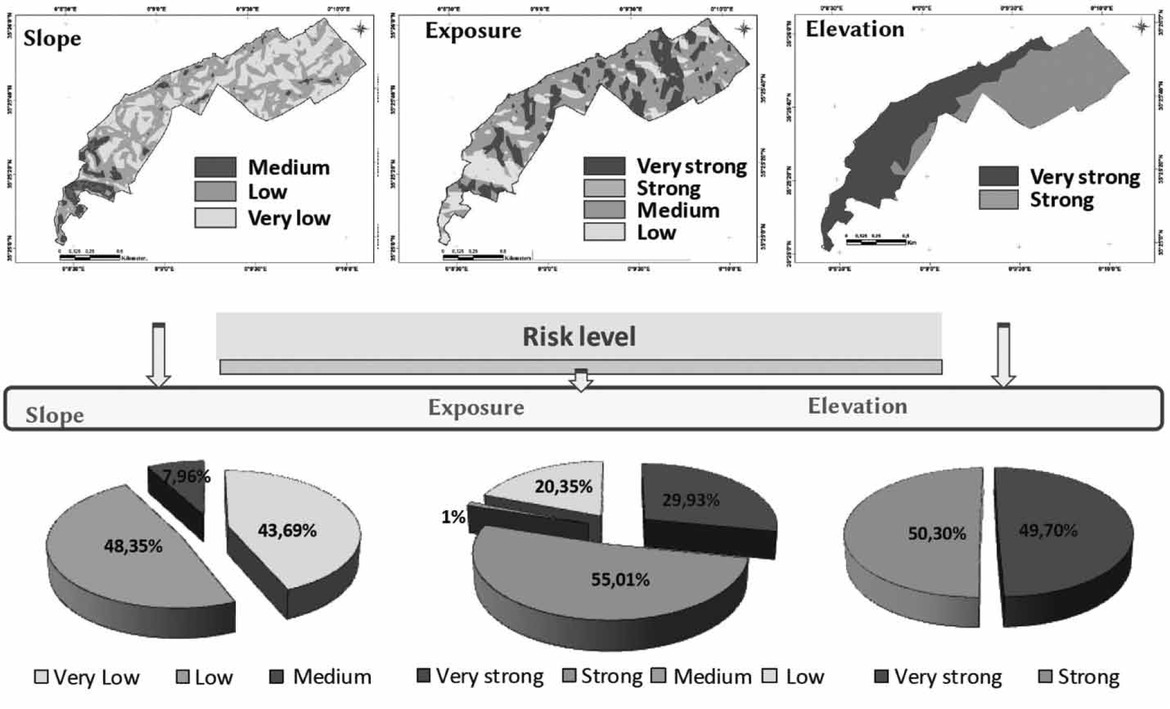
Figure 6
Risk map of the topo-morphological index (IT) of the study area
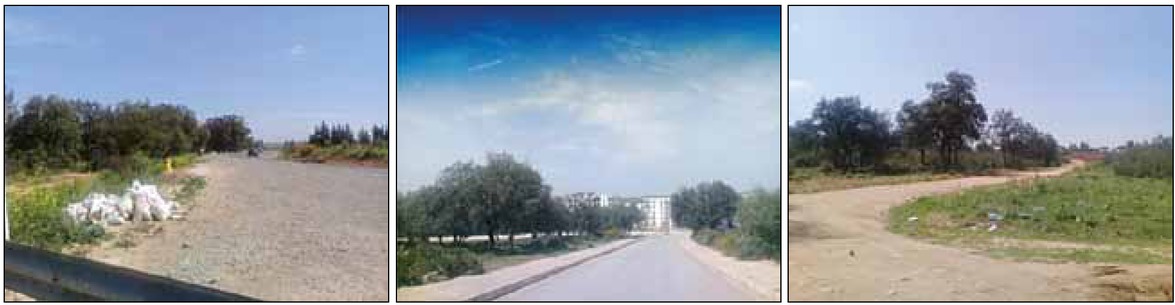
Figure 7
Impact of Roads on the Zakour Forest
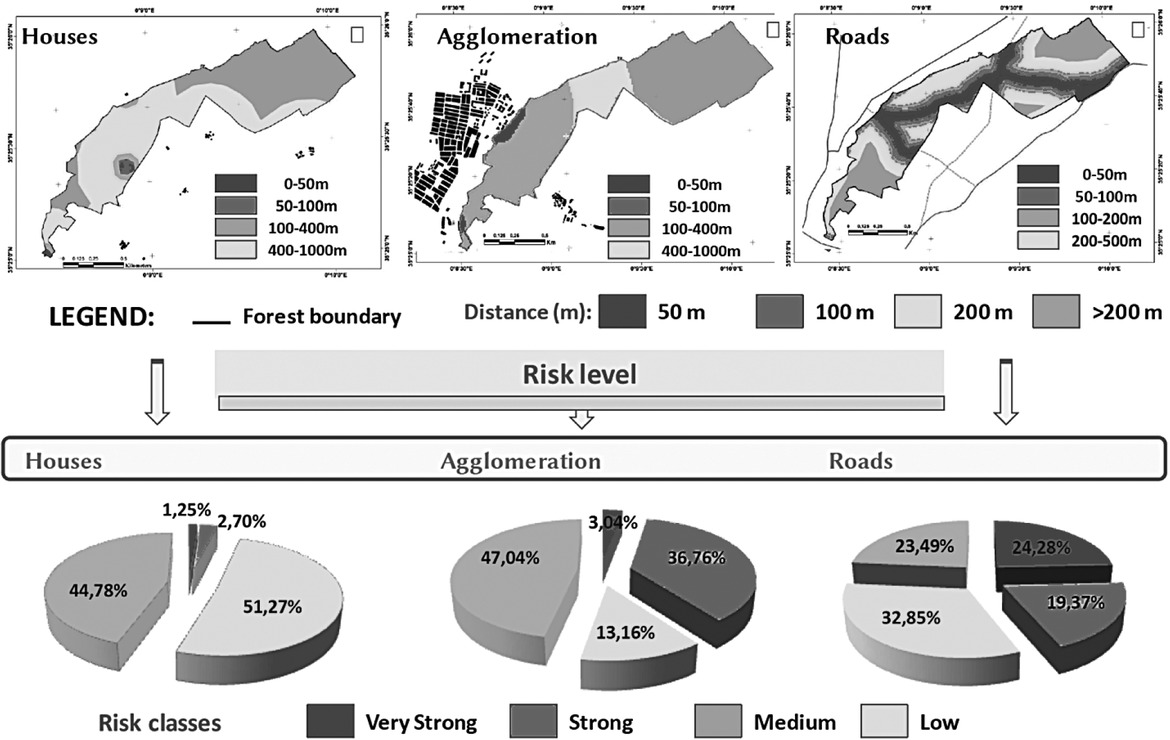
Figure 8
Combustibility risk map (CI) for the study area
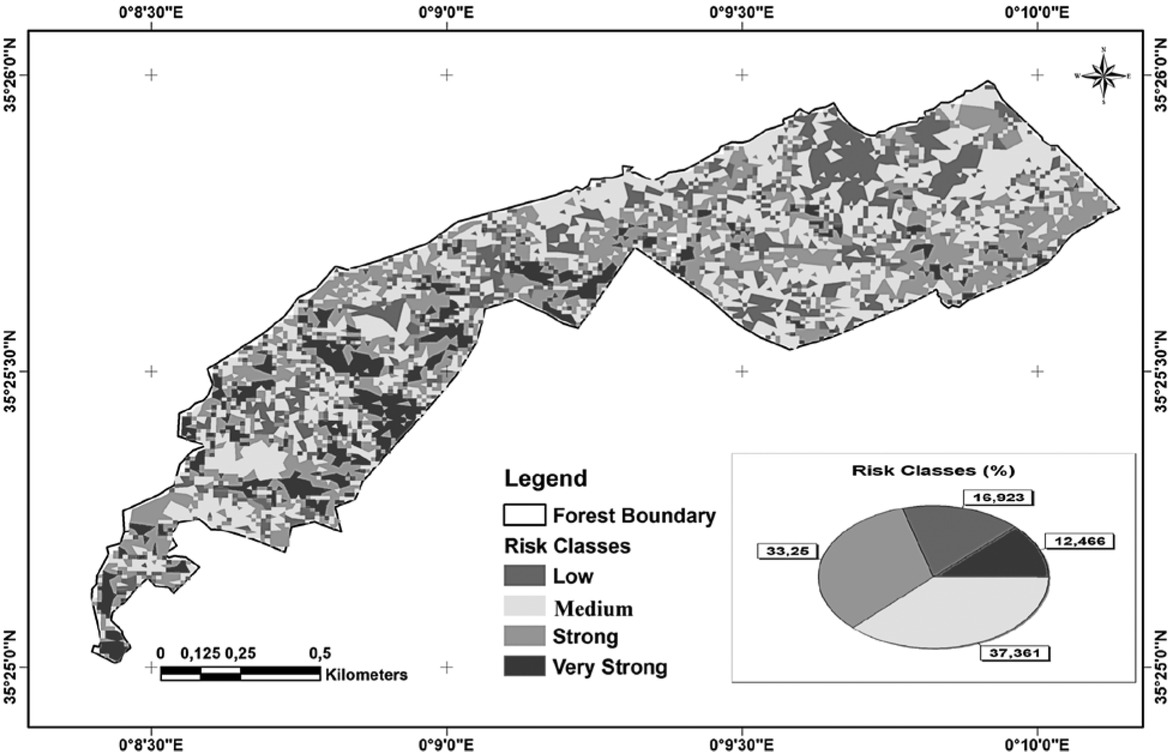
Figure 9
Map of potential fire risk in the Zakour Forest