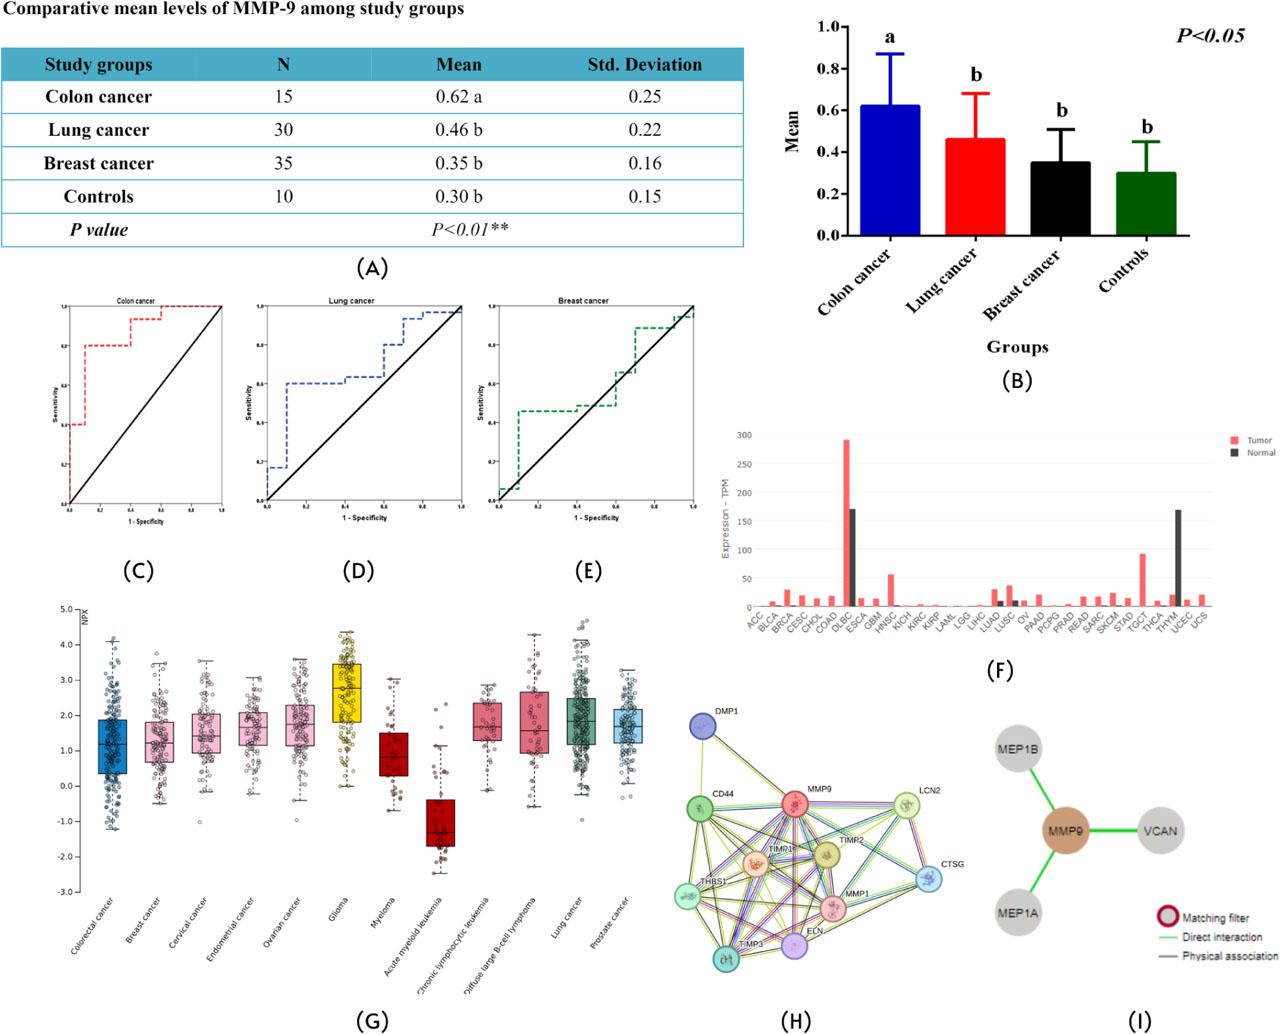
Figure 1:

MMP9 functional partners and their respective scores_
| Functional partners | Score |
|---|---|
| TIMP1 | 0.999 |
| TIMP2 | 0.998 |
| LCN2 | 0.998 |
| CD44 | 0.998 |
| THBS1 | 0.997 |
| TIMP3 | 0.995 |
| CTSG | 0.992 |
| DMP1 | 0.982 |
| ELN | 0.979 |
| MMP1 | 0.974 |
Comparative mean levels of MMP9 between disease progression and stable disease_
| Response to chemotherapy | n | Mean | Std deviation | |
|---|---|---|---|---|
| MMP9 | Disease progression | 73 | 0.41 | 0.21 |
| Stable disease | 7 | 0.6 | 0.29 | |
| P-value | P > 0.05 | |||
ROC curve, sensitivity, and specificity of MMP9 in screening cancer patients_
| Cancer type | AUC | Std error | P-value | Cutoff | Sensitivity % | Specificity % |
|---|---|---|---|---|---|---|
| Colon | 0.867 | 0.075 | 0.05* | 0.39 | 80% | 90% |
| Lung | 0.69 | 0.093 | 0.08 | 0.37 | 60% | 90% |
| Breast | 0.577 | 0.099 | 0.46 | 0.3 | 49% | 50% |
| AUC: area under the curve | ||||||
Anthropometric and clinical features of participants_
| Count | Percentage | P-value | ||
|---|---|---|---|---|
| Age groups (years) | 25–34 | 3 | 3.30% | P<0.001*** |
| 35–44 | 7 | 7.80% | ||
| 45–54 | 27 | 30.00% | ||
| 55–64 | 31 | 33.30% | ||
| >64 | 24 | 25.60% | ||
| Gender | Males | 30 | 33.30% | P<0.001*** |
| Females | 60 | 66.70% | ||
| Groups | Colon cancer | 15 | 16.70% | P<0.001*** |
| Lung cancer | 30 | 33.30% | ||
| Breast cancer | 35 | 38.90% | ||
| Controls | 10 | 11.10% | ||
| Stage | Late | 73 | 91.25% | P<0.001*** |
| Early | 7 | 8.75% | ||
| Response to chemotherapy | Disease progression | 73 | 91.25% | P<0.001*** |
| Stable disease | 7 | 8.75% |
Top 15 nearest neighbors based on tissue RNA expression_
| Neighbor | Description | Correlation | Cluster |
|---|---|---|---|
| NKG7 | Natural killer cell granule protein 7 | 0.9842 | 6 |
| CLEC12A | C-type lectin domain family 12 member A | 0.9825 | 81 |
| CTSW | Cathepsin W | 0.9825 | 81 |
| NFE2 | Nuclear factor, erythroid 2 | 0.9789 | 81 |
| GNLY | Granulysin | 0.9772 | 77 |
| PIK3R5 | Phosphoinositide-3-kinase regulatory subunit 5 | 0.9772 | 77 |
| RETN | Resistin | 0.9754 | 6 |
| PADI4 | Peptidyl arginine deiminase 4 | 0.9754 | 6 |
| IL18RAP | Interleukin 18 receptor accessory protein | 0.9737 | 81 |
| FMNL1 | Formin-like 1 | 0.9737 | 81 |
| FOLR3 | Folate receptor gamma | 0.9684 | 6 |
| SLFN14 | Schlafen family member 14 | 0.9667 | 6 |
| ADGRG3 | Adhesion G protein-coupled receptor G3 | 0.9667 | 6 |
| HK3 | Hexokinase 3 | 0.9632 | 81 |
| GYPE | Glycophorin E (MNS blood group) | 0.9632 | 77 |
Comparative mean levels of MMP9 between late- and early-stage diseases_
| Stages | n | Mean | Std deviation | |
|---|---|---|---|---|
| MMP9 | Late | 73 | 0.43 | 0.21 |
| Early | 7 | 0.36 | 0.19 | |
| P-value | P > 0.05 | |||
Genes and pathways implicated with MMP9 in lung, colon, and breast cancers_
| Lung cancer | |
| Genes | Pathways |
|
|
| Colon cancer | |
| Genes | Pathways |
|
|
| Breast cancer | |
| Genes | Pathways |
|
|