
Table 1:
International Consensus Classification (ICC) 2022 of AML.
| ICC 2022 |
|---|
| AML with recurrent genetic abnormalities (requiring equal or greater than 10% blasts, except*) |
| AML with t(8;21)(q22;q22.1)/RUNX1::RUNX1T1 |
| AML with inv(16)(p13.1q22) or t(16;16)(p13.1;q22)/CBFB::MYH11 |
| Acute promyelocytic leukemia (APL) with t(15;17) (q24.1;q21.2)/PML::RARA; APL with other RARA rearrangements |
| AML with t(9;11)(p21.3;q23.3)/MLLT3::KMT2A; AML with other KMT2A rearrangements |
| AML with t(6;9)(p22.3;q34.1)/DEK::NUP214 |
| AML with inv(3)(q21.3q26.2) or t(3;3)(q21.3;q26.2)/GATA2::MECOM(EVI1); AML with other MECOM rearrangements |
| AML with BCR::ABL1 fusion* |
| AML with other rare recurring translocations |
| AML with mutated NPM1 |
| AML with in-frame bZIP CEBPA mutations |
| AML requiring equal or greater than 20% blasts** |
| AML with mutated TP53 (VAF >10%) |
| AML with myelodysplasia-related gene mutations |
| AML with myelodysplasia-related cytogenetic abnormalities |
| Therapy-related myeloid neoplasms |
| NA (BECOMING DIAGNOSTIC QUALIFIER) |
| AML not otherwise specified; subtyping optional |
| AML with minimal differentiation |
| AML without maturation |
| AML with maturation |
| Acute myelomonocytic leukemia |
| Acute monoblastic/monocytic leukemia |
| Pure erythroid leukemia*** |
| Acute megakaryoblastic leukemia |
| Acute basophilic leukemia |
| Myeloid sarcoma |
Table 2:
WHO classification (WHO-HAEM5) of AML.
| WHO 2022 |
|---|
| AML with defining genetic abnormalities (no blast % cut-off, except*) |
| AML with RUNX1::RUNX1T1 fusion |
| AML with CBFB::MYH11 fusion |
| Acute promyelocytic leukemia with PML::RARA fusion |
| AML with KMT2A rearrangement |
| AML with DEK::NUP214 fusion |
| AML with MECOM rearrangement |
| AML with RBM15::MRTFA fusion |
| AML with BCR::ABL1 fusion* |
| AML with NUP98 rearrangement |
| AML with other (rare) defined genetic alterations* |
| AML with NPM1 mutation |
| AML with CEBPA mutation*# |
| AML requiring equal or greater than 20% blasts |
| AML, myelodysplasia-related |
| Therapy-related myeloid neoplasms |
| NA (BECOMING NEW ENTITY OF SECONDARY MYELOID NEOPLAMS) |
| AML, defined by differentiation |
| AML with minimal differentiation |
| AML without maturation |
| AML with maturation |
| Acute myelomonocytic leukemia |
| Acute monoblastic/monocytic leukemia |
| Pure erythroid leukemia |
| Acute megakaryoblastic leukemia |
| Acute basophilic leukemia |
| Myeloid sarcoma |
Table 3:
ELN AML risk classification.
| Risk category† | Genetic abnormality |
| Favorable | |
| Intermediate | |
| Adverse |
|
* Frequencies, response rates, and outcome measures should be reported by risk category, and, if sufficient numbers are available, by specific genetic lesions indicated.
† Mainly based on results observed in intensively treated patients. Initial risk assignment may change during the treatment course based on the results from analyses of measurable residual disease.
§ AML with NPM1 mutation and adverse risk cytogenetic abnormalities are categorized as adverse-risk.
|| Only in-frame mutations affecting the basic leucine zipper (bZIP) region of CEBPA, irrespective of whether they occur as monoallelic or biallelic mutations, have been associated with favorable outcome.
¶ The presence of t(9;11)(p21.3;q23.3) takes precedence over rare, concurrent adverse risk gene mutations.
** Complex karyotype: ≥3 unrelated chromosome abnormalities in the absence of other class-defining recurring genetic abnormalities; excludes hyperdiploid karyotypes with three or more trisomies (or polysomies) without structural abnormalities.
†† Monosomal karyotype: presence of two or more distinct monosomies (excluding loss of X or Y), or one single autosomal monosomy in combination with at least one structural chromosome abnormality (excluding core-binding factor AML).
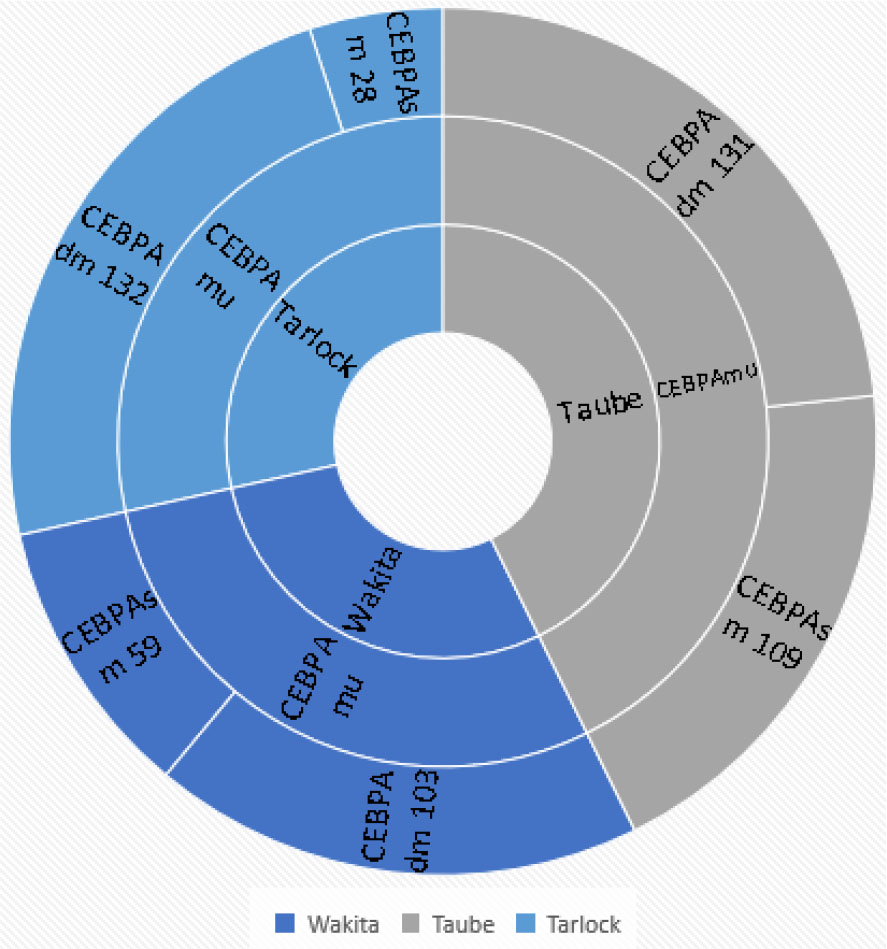
Figure 1:
Frequency distribution of mutations reported in studies separated on the basis of author’s name.
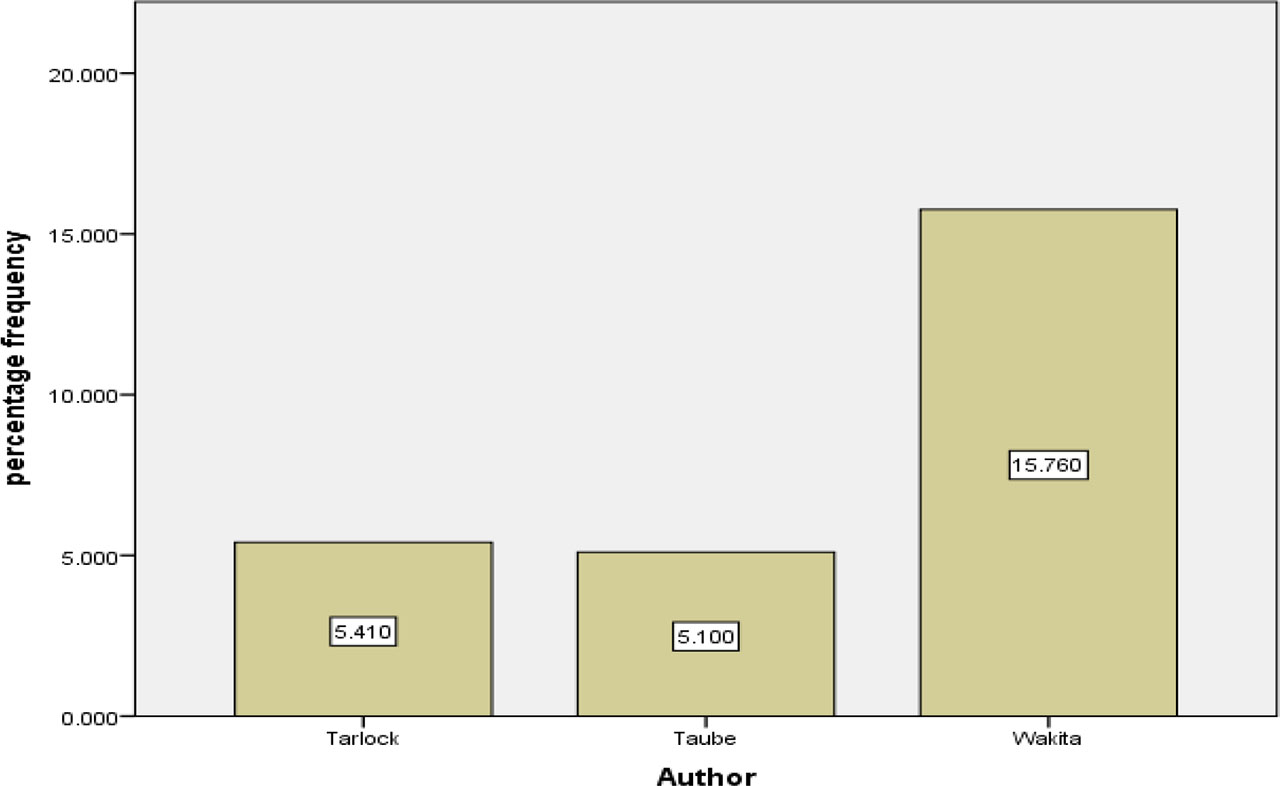
Figure 2:
Comparison of percentage frequency of CEBPAmu found out of total study population.
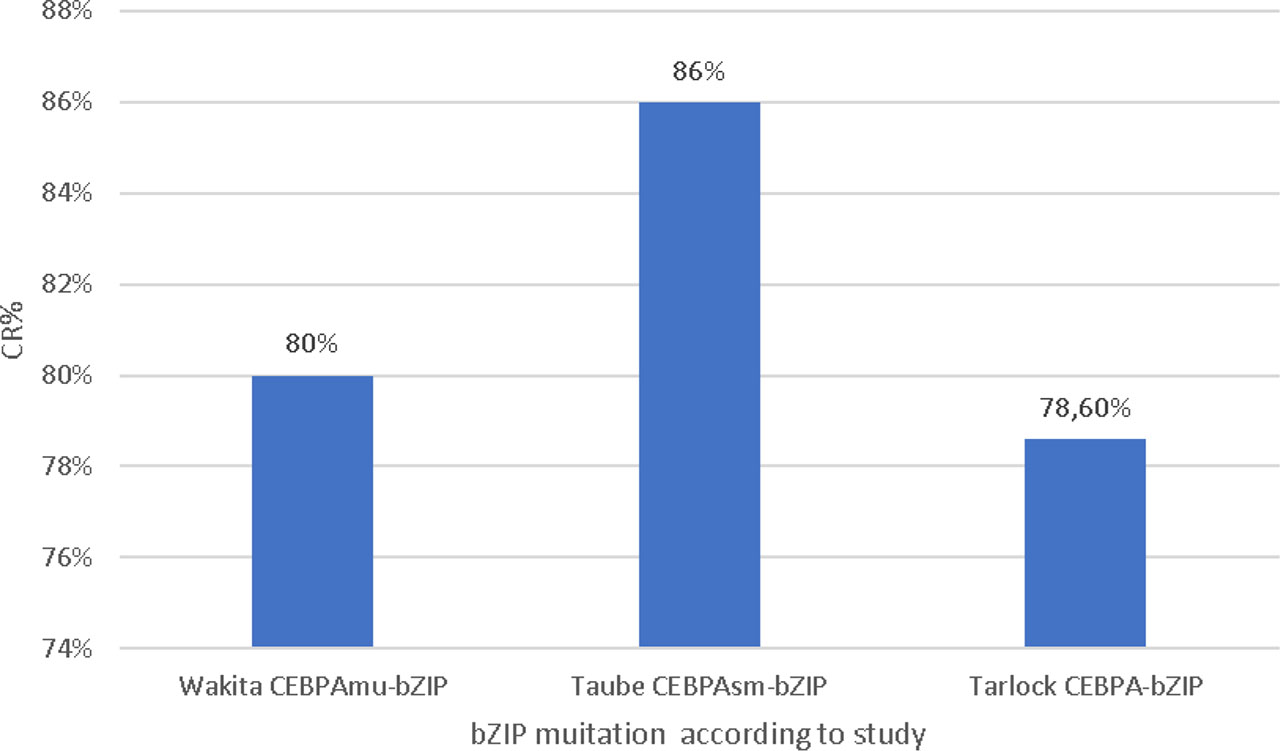
Figure 3:
Complete remission (CR) rate percentage in the three studies.
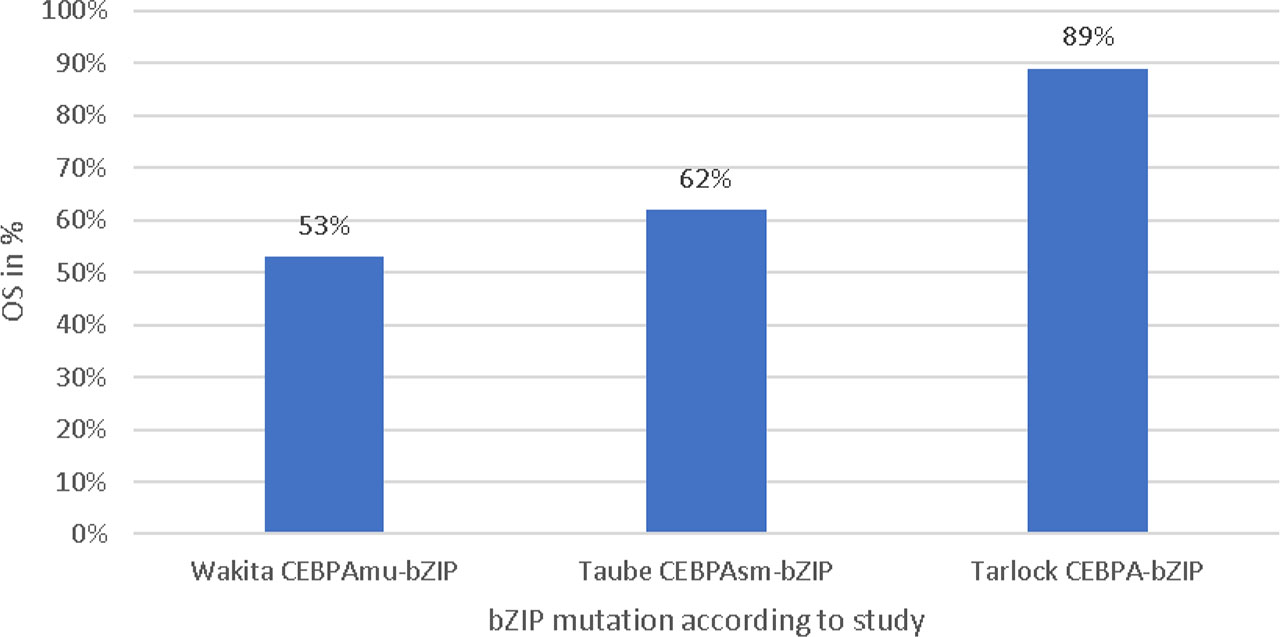
Figure 4:
Overall survival (OS) rate in percentage in the three studies, showing favorable prognosis.