
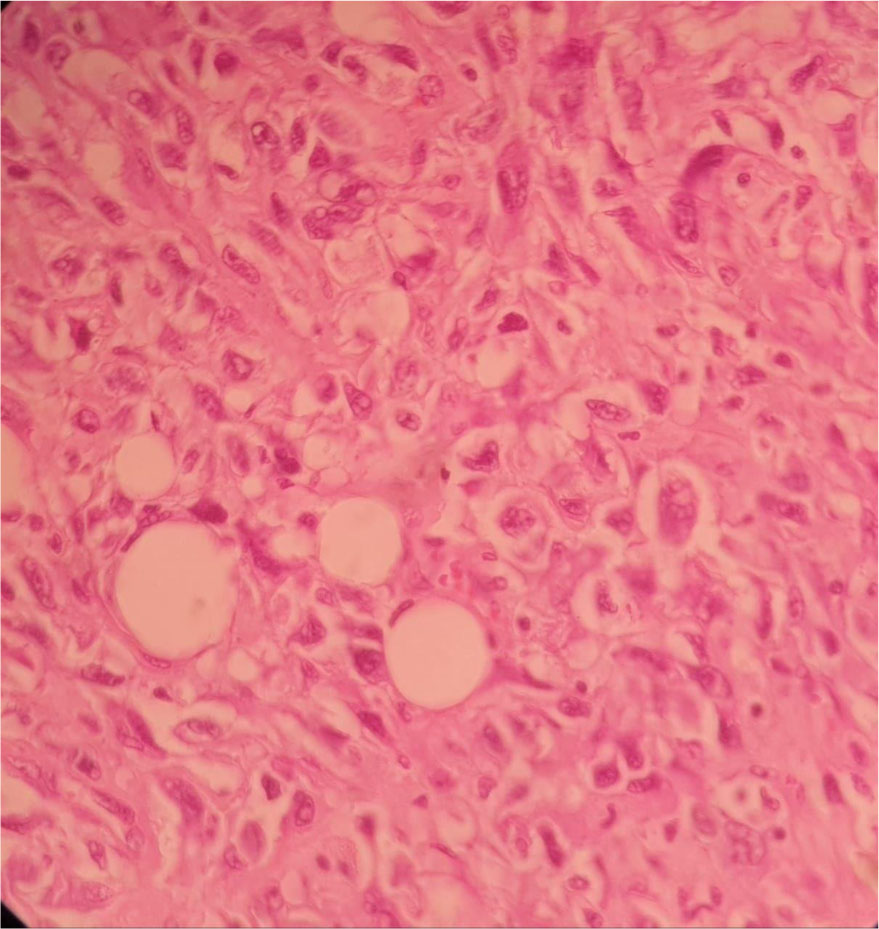
Figure 1:
H&E stain shows bundles of atypical spindle cells (×10 power).
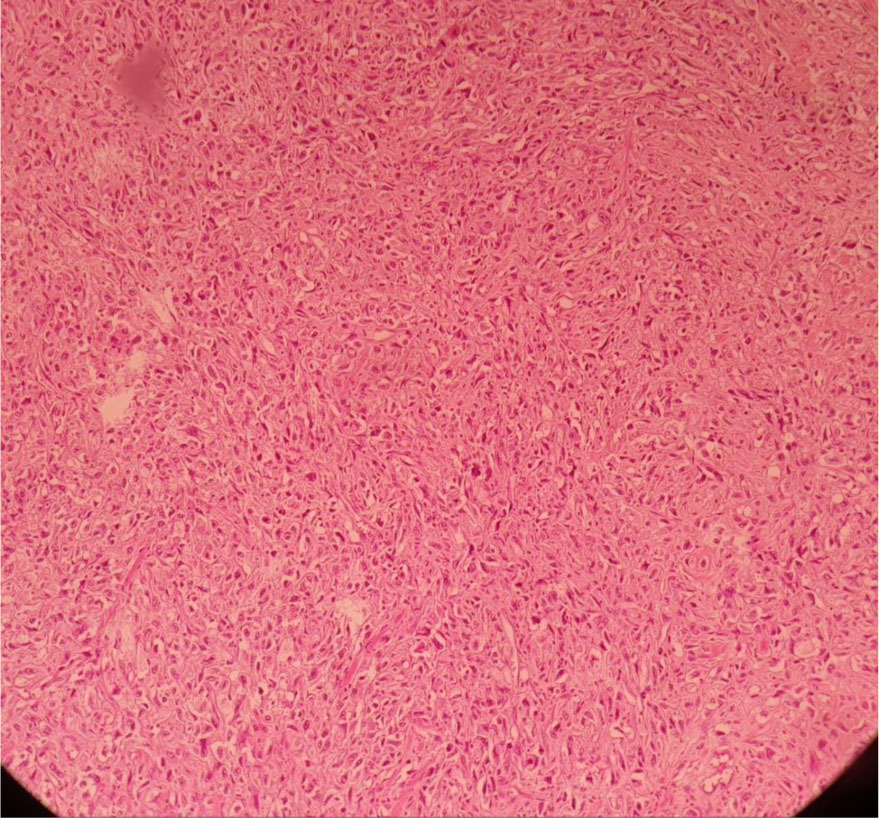
Figure 2:
H&E stain section shows the same atypical spindle cell in high power (×40).
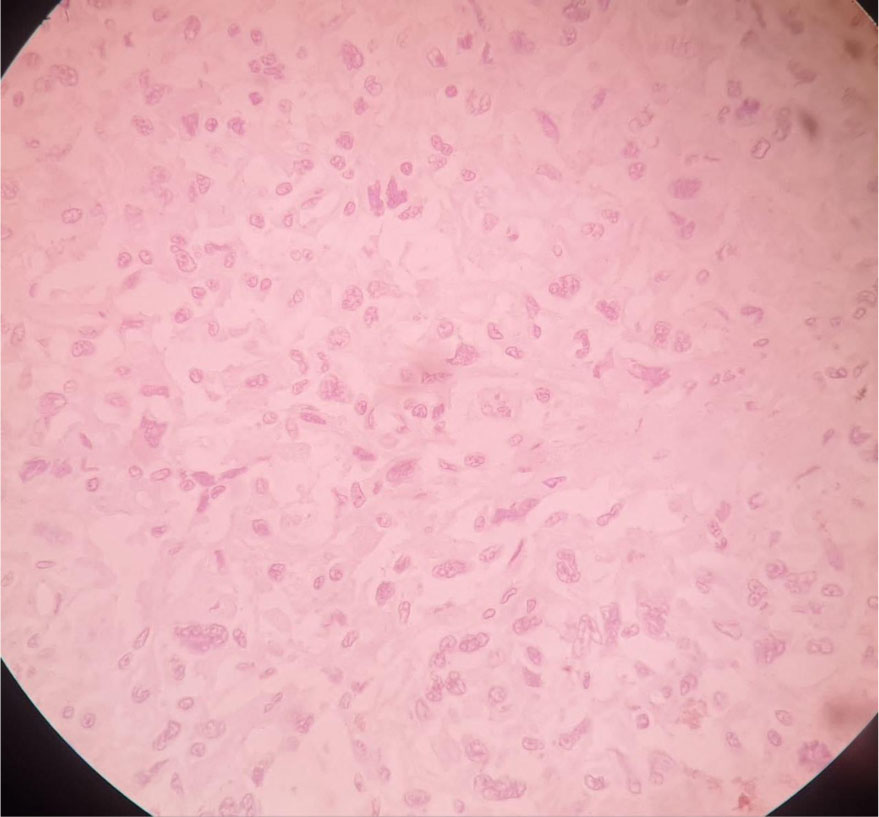
Figure 3:
ER stain negative in high power (×40).
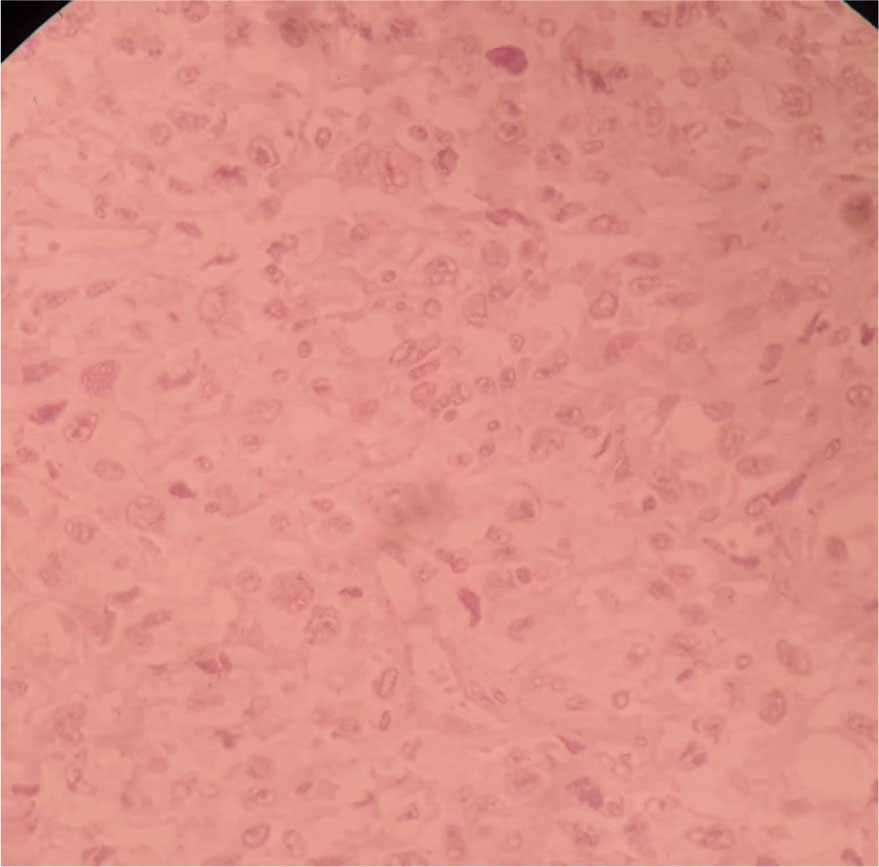
Figure 4:
PR stain negative in high power (×40).
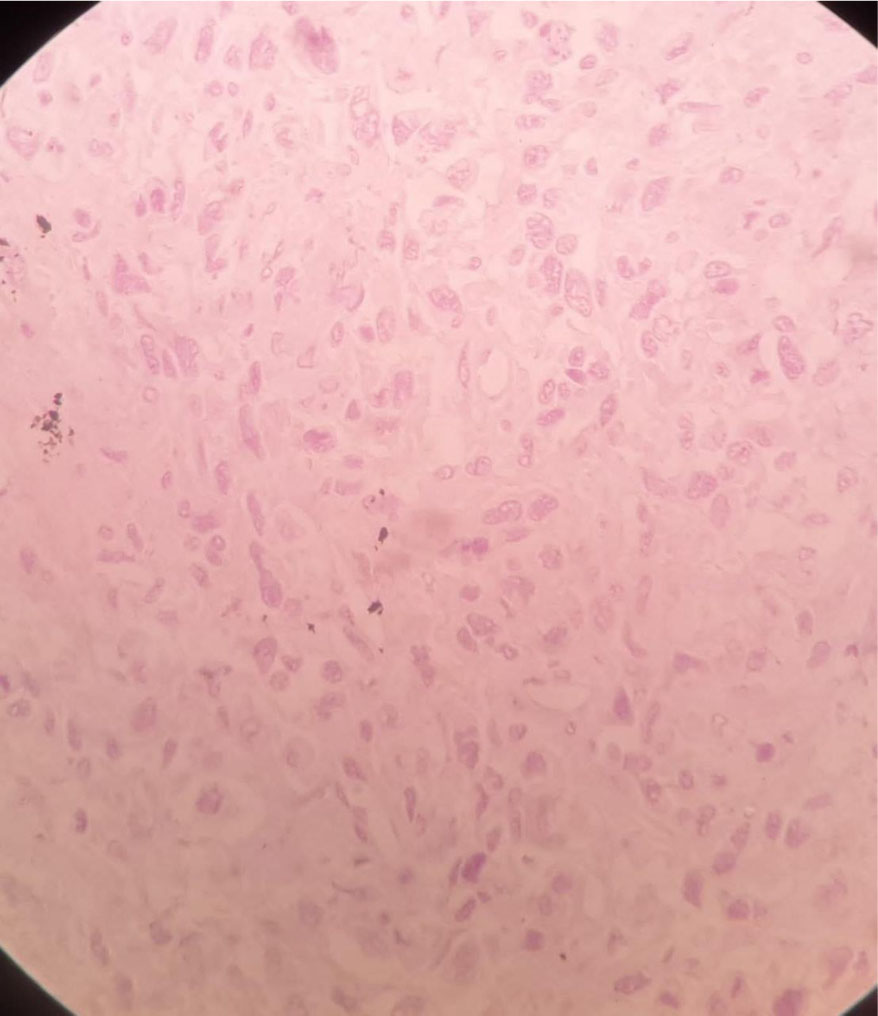
Figure 5:
HER2 stain negative in high power (×40).
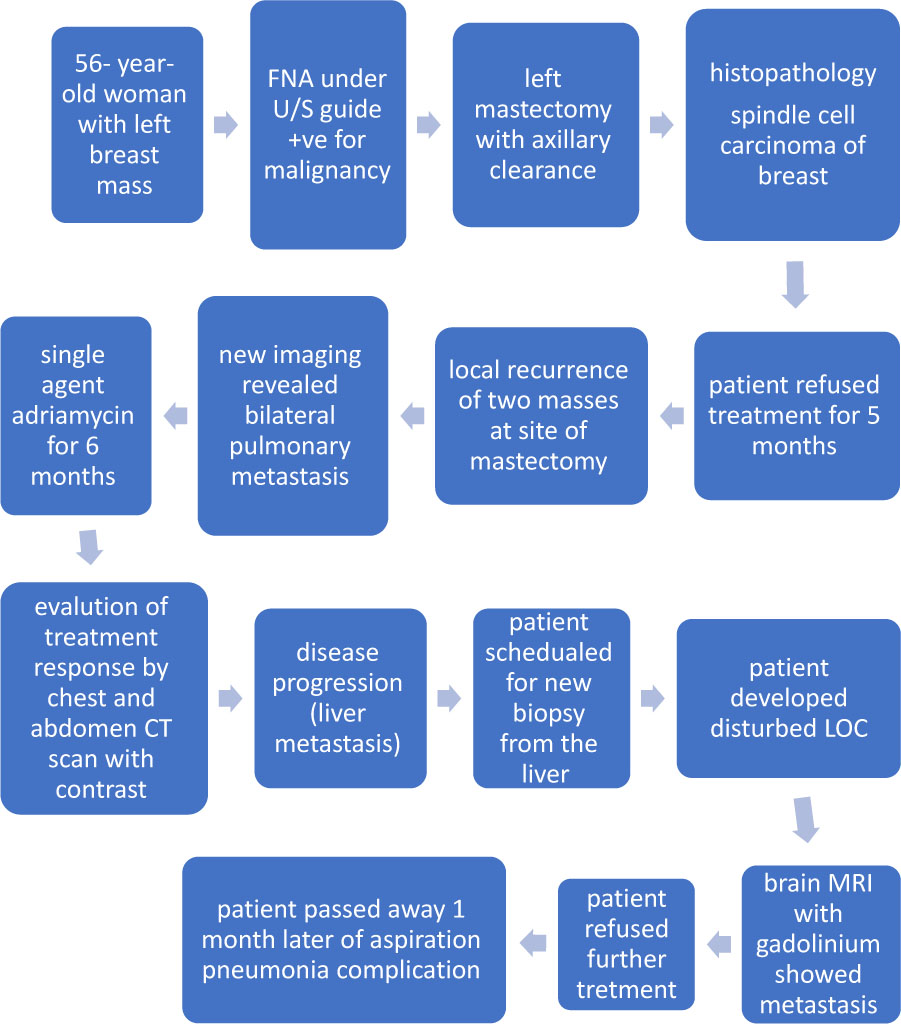
Figure 6:
Treatment Algorithm.