
Table 1
Patient characteristics (n = 22).
| Factor | Medulloblastoma No. | % |
|---|---|---|
| Age (years), range | 8 (1–14) | |
| Gender | ||
| Male | 13 | 59.09 |
| Female | 9 | 40.90 |
| Clinical presentation | ||
| Headache | 17 | 77.2 |
| Vomiting | 18 | 81.8 |
| Lack of balance | 10 | 45.4 |
| Vision problems | 4 | 18.1 |
| Dizziness | 5 | 22.7 |
| Anaesthesia of the hands and feet | 1 | 4.5 |
| Follow-up time (M ± SD) | 49.36 ± 38.33 | |
| Pathological type | ||
| Classic | 13 | 59.09 |
| Desmoplastic | 1 | 4.50 |
| Large cell/anaplastic | 8 | 36.30 |
| Tumour size (M ± SD) | 2.88 ± 1.319 | |
| Tumour location | ||
| Cerebellum | 15 | 68.1 |
| Posterior fossa | 3 | 13.6 |
| Fourth ventricle | 3 | 13.6 |
| Brain stem | 1 | 4.5 |
| Tumour size before surgery, cm | ||
| < 3 | 13 | 59.09 |
| ≥ 3 | 9 | 40.90 |
| Chemotherapy | ||
| Yes | 19 | 86.3 |
| No | 3 | 13.6 |
| End of follow-up | ||
| status | ||
| Deceased | 7 | 31.8 |
| Alive | 15 | 68.1 |
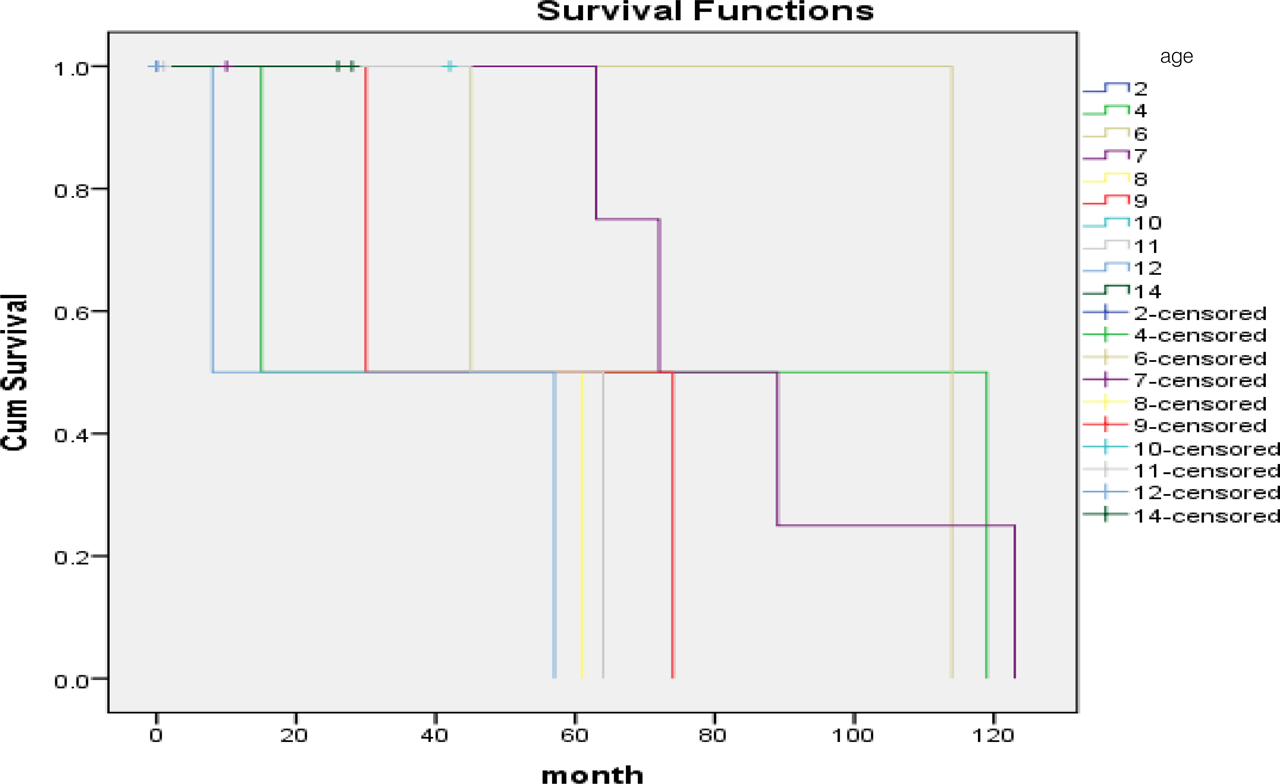
Figure 1
Overall survival rates of pediatric patients with medulloblastoma according to age factors using the Kaplan–Meier curves and log-rank tests.
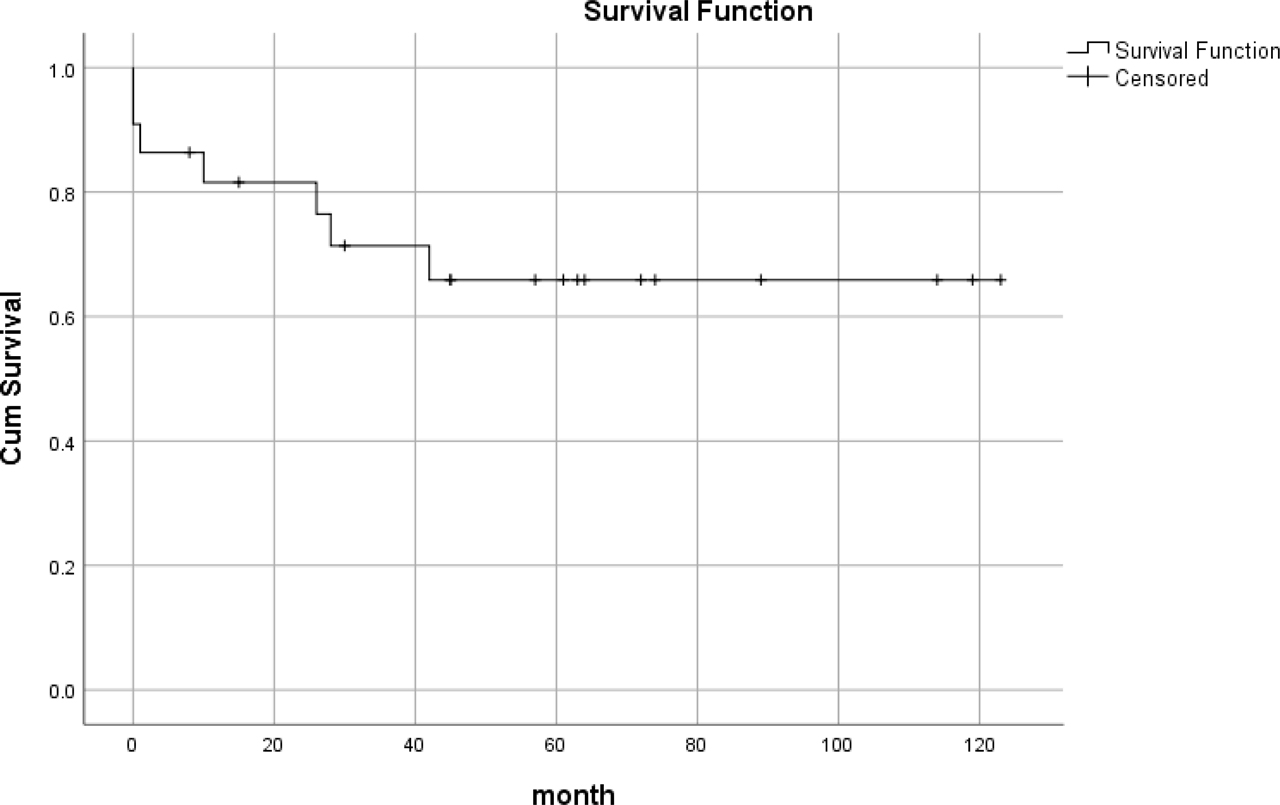
Figure 2
Kaplan–Meier curves showing overall survival rates among 22 pediatric patients with medulloblastoma.