
Tab. 1
Results of the Test of Normality
| Do you provide smart services, such as remote monitoring, remote diagnostics, remote repair, and so on? | Shapiro–Wilk test | |||
|---|---|---|---|---|
| Statistic | df | Sig. | ||
| External cooperation flexibility with customers | Yes | .790 | 51 | .000 |
| No | .868 | 61 | .000 | |
| External cooperation flexibility with suppliers | Yes | .946 | 51 | .021 |
| No | .952 | 61 | .017 | |
| Internal cooperation flexibility | Yes | .842 | 51 | .000 |
| No | .930 | 61 | .002 | |
| Innovation flexibility related to the product | Yes | .923 | 51 | .003 |
| No | .942 | 61 | .006 | |
| Innovation flexibility related to accompanying services | Yes | .916 | 51 | .001 |
| No | .968 | 61 | .117 | |
| Innovation performance | Yes | .964 | 51 | .129 |
| No | .969 | 61 | .122 | |
| Business performance | Yes | .918 | 51 | .002 |
| No | .940 | 61 | .005 | |
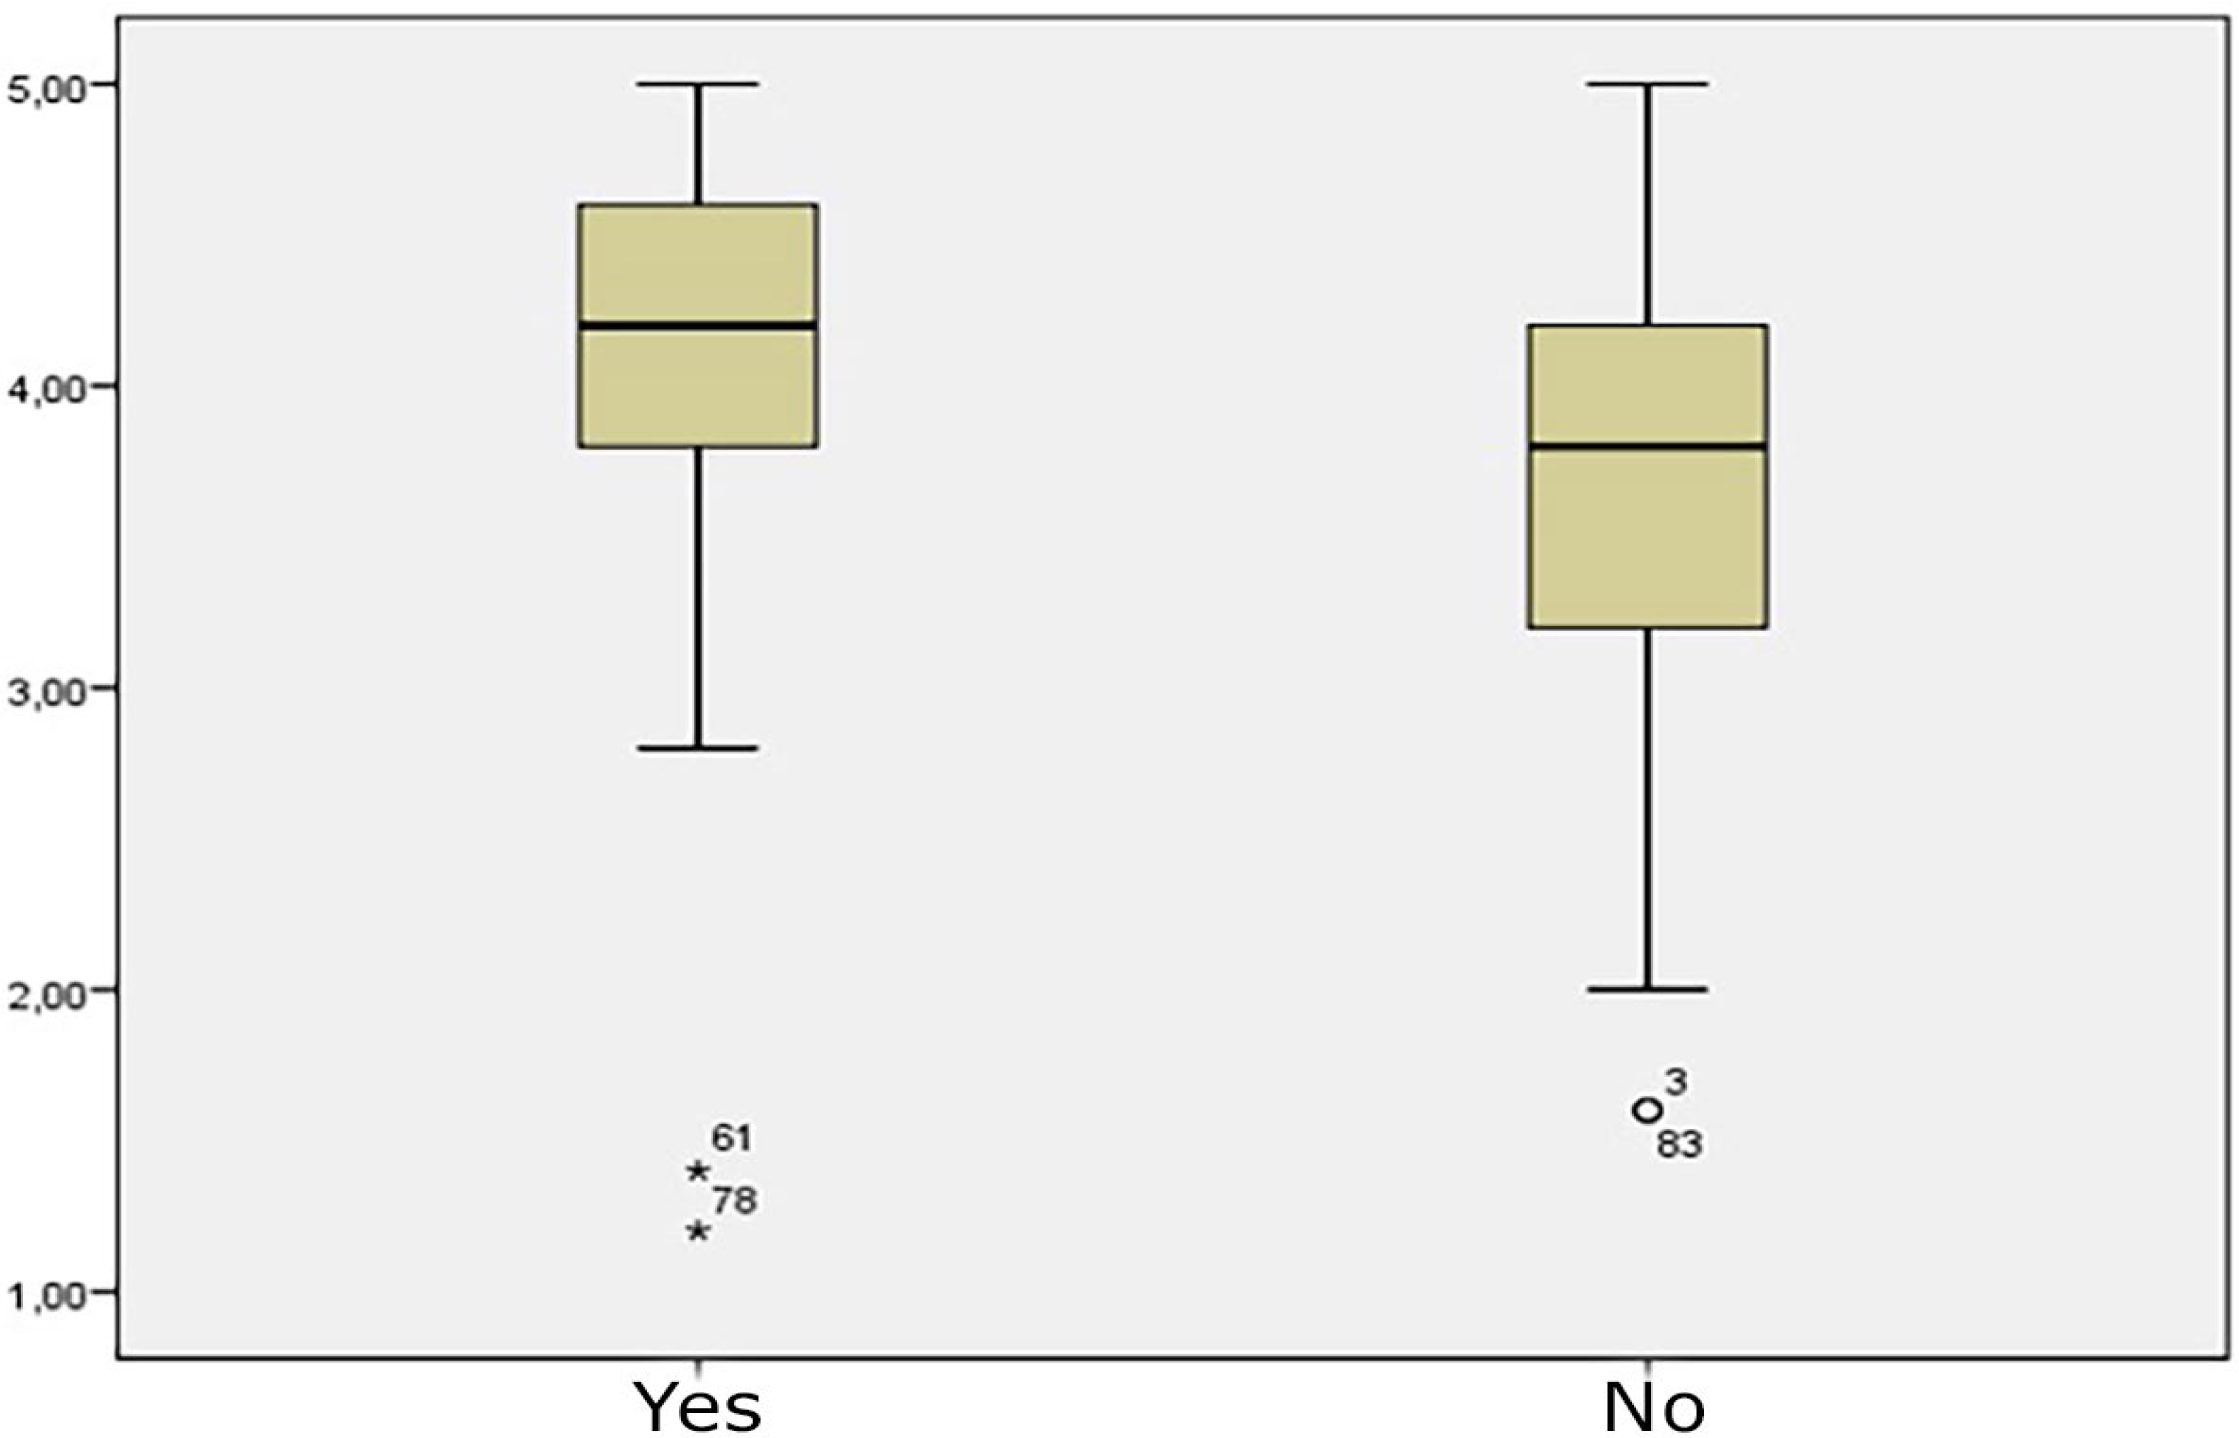
Fig. 1
Verification of extreme and remote observations
Tab. 2
Results of the Test of Normality after the removal of extreme values
| Do you provide smart services, such as remote monitoring, remote diagnostics, remote repair, and so on? | Shapiro–Wilk test | |||
|---|---|---|---|---|
| Statistic | df. | Sig. | ||
| Internal cooperation flexibility | Yes | .956 | 49 | .063 |
| No | .930 | 61 | .002 | |
[i] Source: elaborated by the author based on obtained data.
Tab. 3
Average ranking of areas
| Do you provide smart services, such as remote monitoring, remote diagnostics, remote repair, and so on? | N | Mean Rank | |
|---|---|---|---|
| External cooperation flexibility with customers | Yes | 51 | 62.05 |
| No | 61 | 51.86 | |
| Total | 112 | ||
| External cooperation flexibility with suppliers | Yes | 51 | 61.02 |
| No | 61 | 52.72 | |
| Total | 112 | ||
| Internal cooperation flexibility | Yes | 51 | 67.40 |
| No | 61 | 47.39 | |
| Total | 112 | ||
| Innovation flexibility related to the product | Yes | 51 | 67.91 |
| No | 61 | 46.96 | |
| Total | 112 | ||
| Innovation flexibility related to accompanying services | Yes | 51 | 68.24 |
| No | 61 | 46.69 | |
| Total | 112 | ||
| Business performance | Yes | 51 | 65.81 |
| No | 61 | 48.71 | |
| Total | 112 | ||
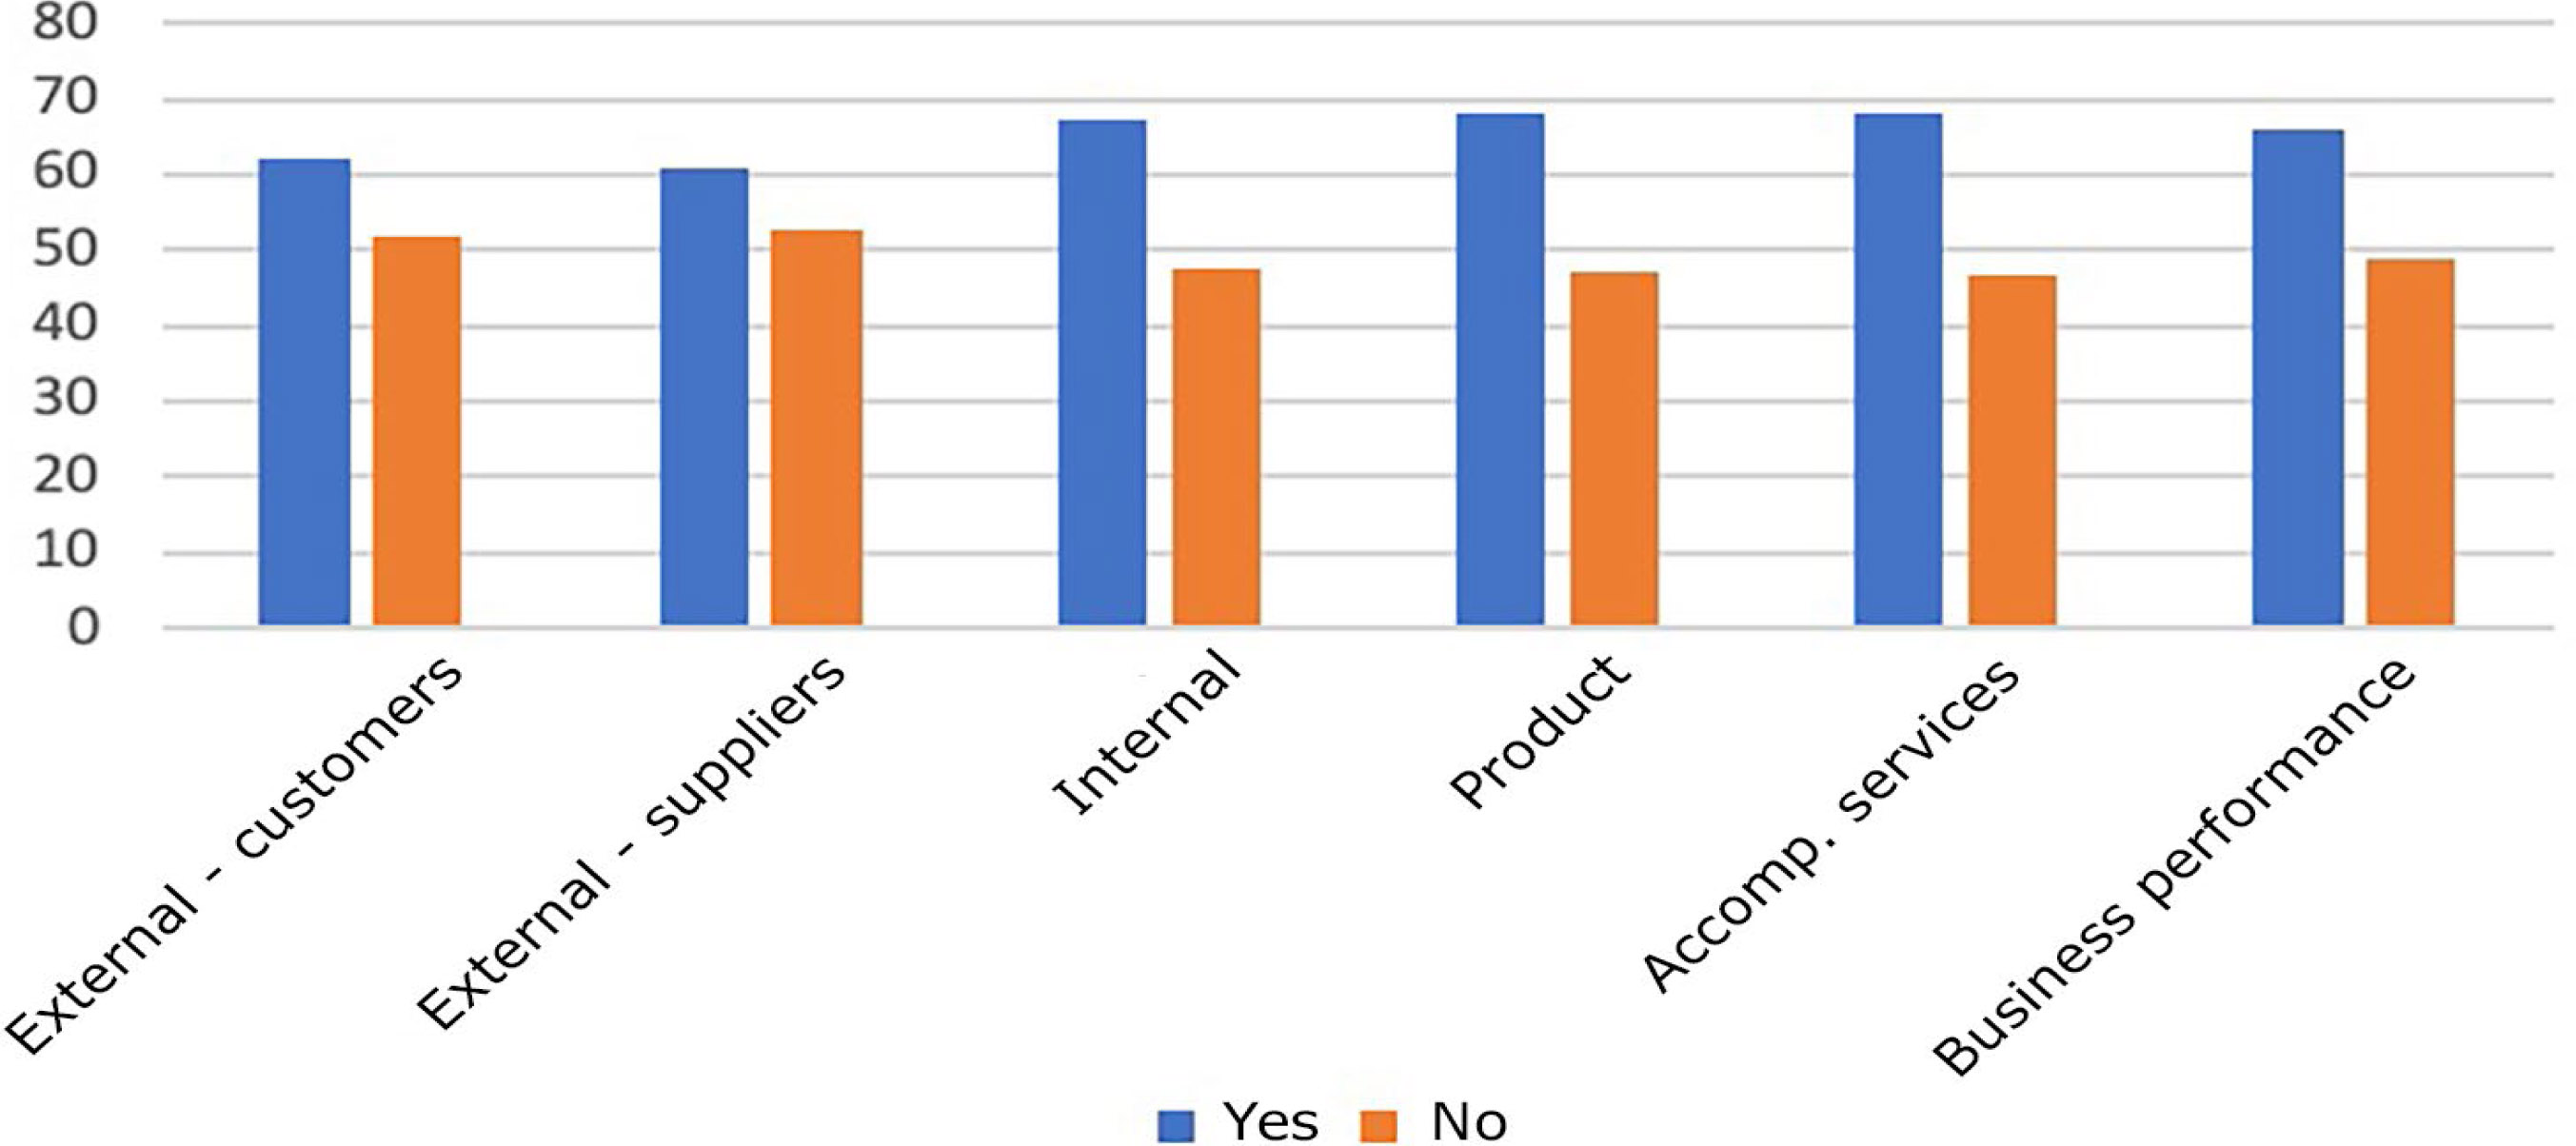
Fig. 2
Graphical display of the mean rank
Tab. 4
Mann–Whitney U test results (Grouping Variable: Do you provide smart services, such as remote monitoring, remote diagnostics, remote repair, and so on?)
| External cooperation flexibility with customers | External cooperation flexibility with suppliers | Internal cooperation flexibility | Innovation flexibility related to the product | Innovation flexibility related to accompanying services | Business performance | |
|---|---|---|---|---|---|---|
| Mann–Whitney U Test | 1272.500 | 1325.000 | 999.500 | 973.500 | 957.000 | 1080.500 |
| Asymp. Sig. (2-tailed) | .095 | .177 | .001 | .001 | .000 | .005 |