
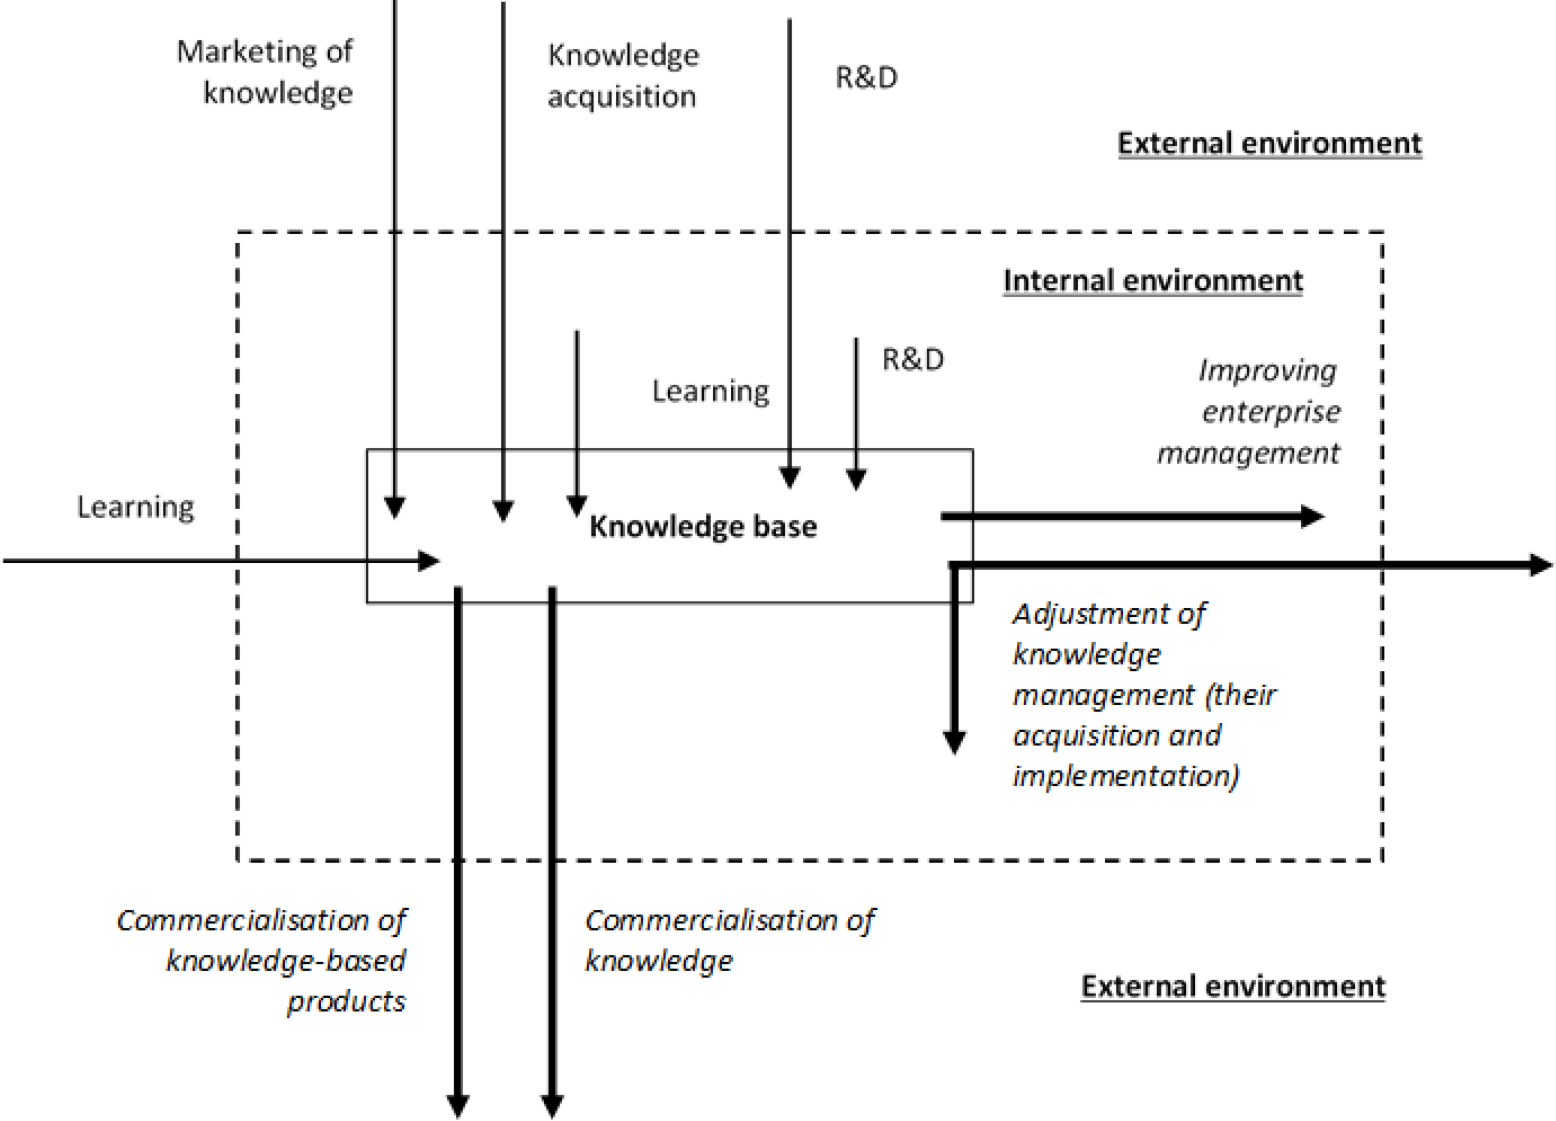
Fig. 1
Scheme depicting the production (acquisition) and utilisation (commercialisation) of knowledge at industrial enterprises
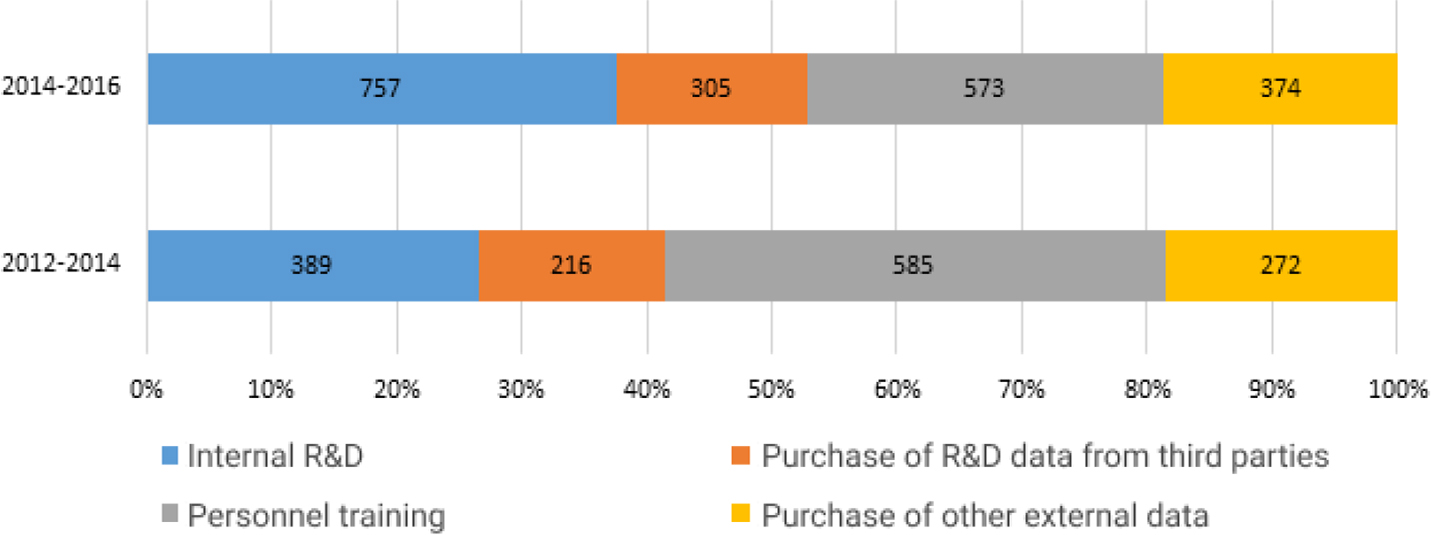
Fig. 2
Percentage distribution of innovation-active enterprises that create technological innovations (by the sources of knowledge)
Source: elaborated by the authors based on Scientific and Innovative Activity of Ukraine (2018).
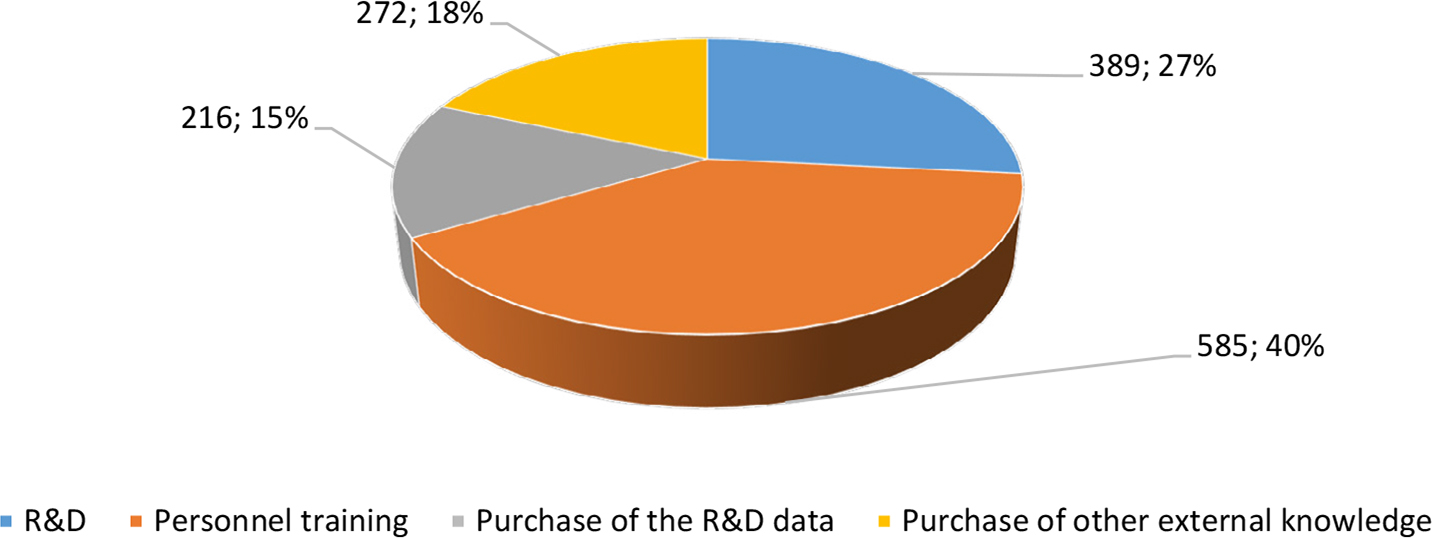
Fig. 3
Structure of Ukrainian enterprises that created technological innovations in 2012–2014 (by the sources of new knowledge)
Source: elaborated by the authors based on Scientific and Innovative Activity of Ukraine (2018).
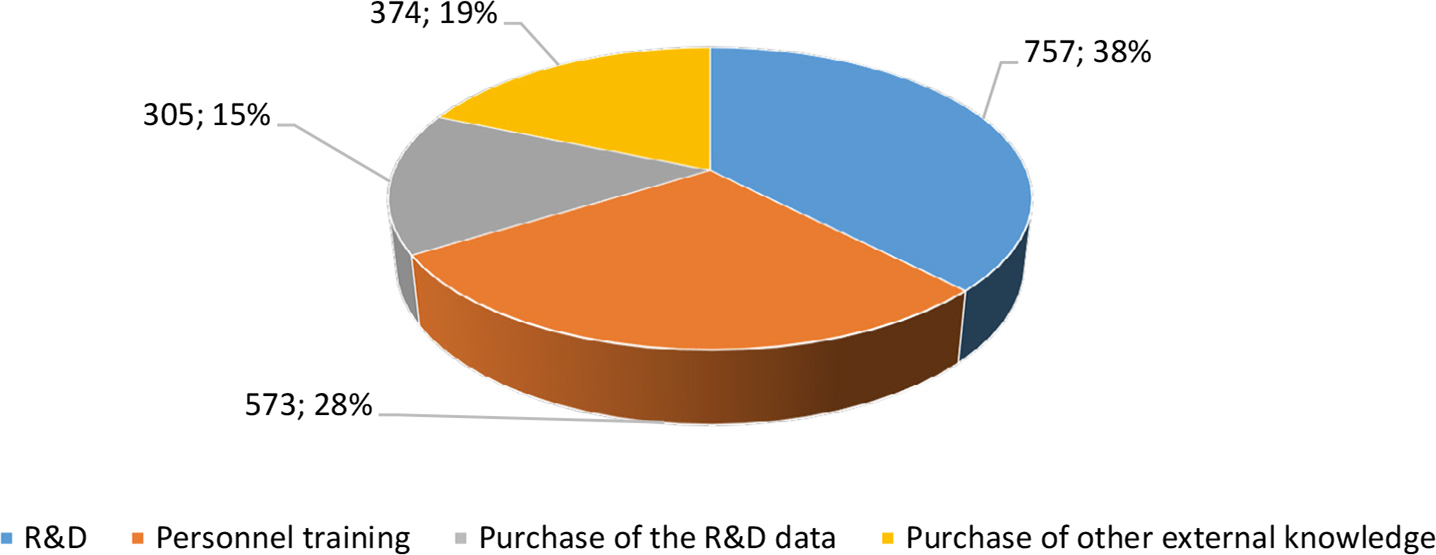
Fig. 4
Structure of Ukrainian enterprises that created technological innovations in 2014–2016 (by the sources of new knowledge)
Source: elaborated by the authors based on Scientific and Innovative Activity of Ukraine (2018).
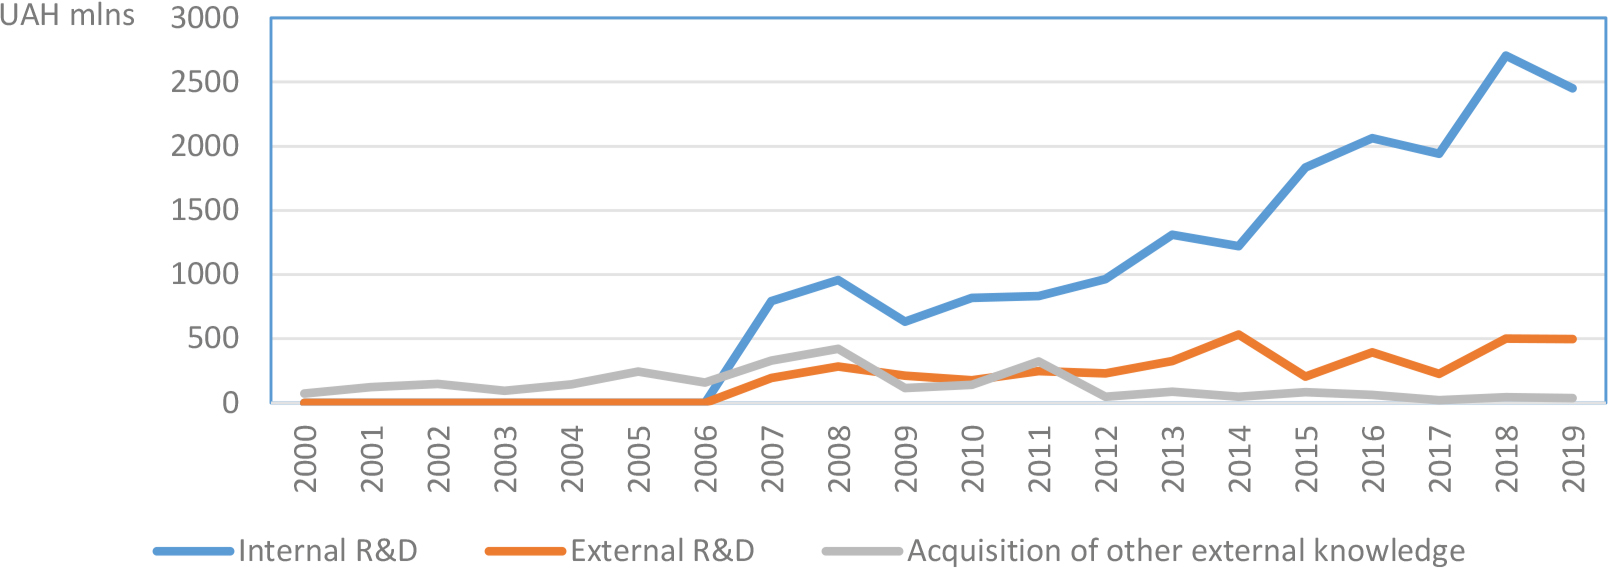
Fig. 5
Expenditures volumes by areas of innovative activity in 2000–2019
Source: elaborated by the authors based on the State Statistics Service of Ukraine (2019).
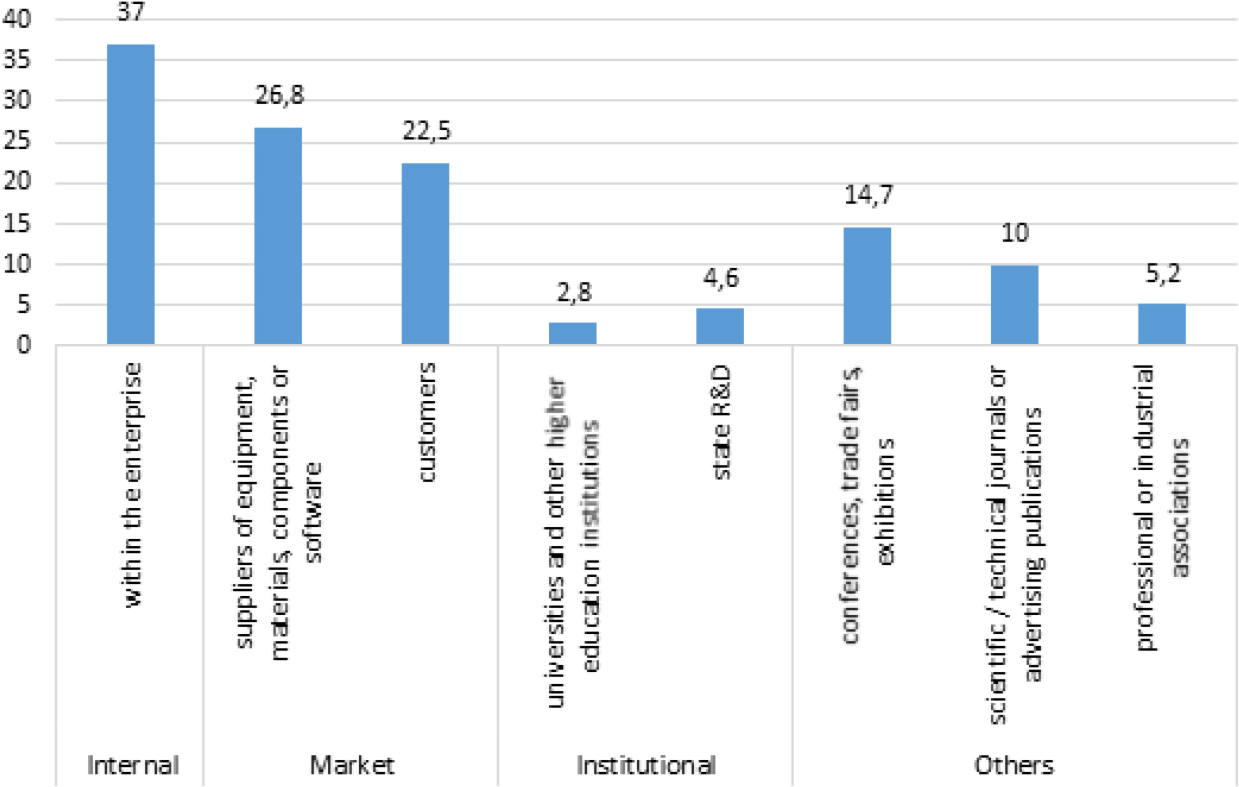
Fig. 6
Innovative development sources used by Ukrainian enterprises that created technological innovations in 2014–2016, %
Source: elaborated by the authors based on Scientific and Innovative Activity of Ukraine (2018).
Tab. 1
Patent activity of Ukrainian applicants: legal entities and individuals
| Objects of intellectual property | A number of applications/patents per year | ||||
|---|---|---|---|---|---|
| 2010 | 2015 | 2016 | 2017 | ||
| Inventions | Applications | 2554 | 2273 | 2232 | 2285 |
| Patents | 2034 | 1510 | 1277 | 1224 | |
| Useful models | Applications | 10528 | 8490 | 9473 | 8977 |
| Patents | 9229 | 8035 | 8931 | 9365 | |
| Industrial designs | Applications | 1442 | 1811 | 2016 | 2249 |
| Patents | 1258 | 1957 | 2134 | 2113 | |
| Trademarks | Applications | 1671 | 21245 | 26064 | 26276 |
| Patents | 13058 | 9539 | 11007 | 12989 | |
[i] Source: elaborated by the authors based on Scientific and Innovative Activity of Ukraine (2018).
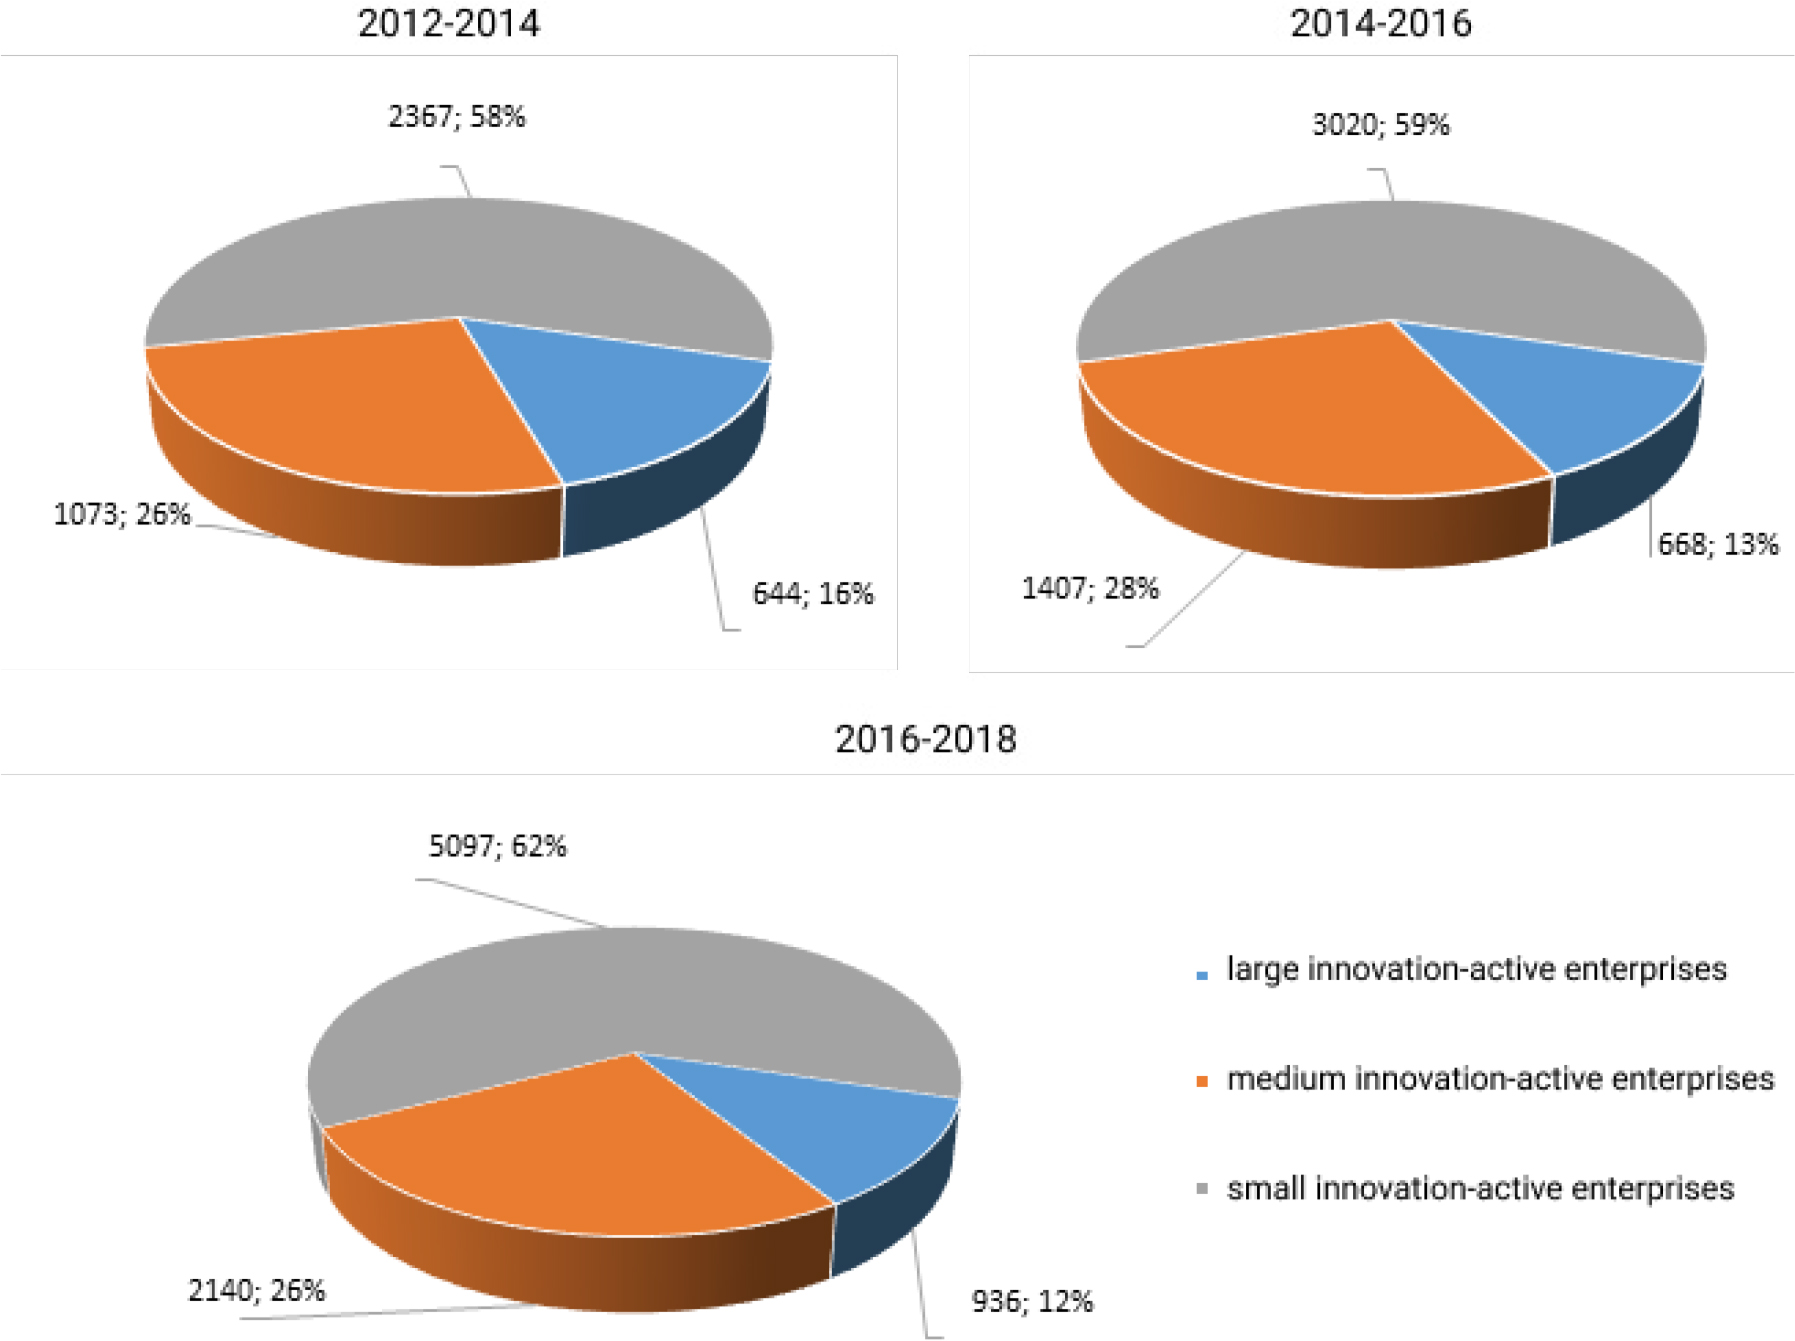
Fig. 7
Innovation-active enterprises of Ukraine grouped by their size
Source: elaborated by the authors based on Scientific and Innovative Activity of Ukraine (2018).
Tab. 2
Types of technological innovations implemented by Ukrainian enterprises
| Indicators of innovative activity | Years | |||
|---|---|---|---|---|
| 2012–2014 | 2014–2016 | 2016–2018 | ||
| Enterprises that implemented technological innovations, total number | 2663 | 3278 | 2937 | |
| Product innovations only | Number | 446 | 347 | 765 |
| % | 16.7 | 10.6 | 26.0 | |
| Process innovations only | Number | 1003 | 1601 | 1038 |
| % | 37.7 | 48.9 | 35.3 | |
| Product and process innovations | Number | 1008 | 1260 | 1134 |
| % | 37.9 | 38.4 | 38.7 | |
| Continuous and interrupted innovations | Number | 206 | 70 | - |
| % | 7.7 | 2.1 | - | |
[i] Source: elaborated by the authors based on Scientific and Innovative Activity of Ukraine (2018, 2019).
Tab. 3
Strengths and weaknesses of knowledge management in industrial enterprises of Ukraine
| Strengths | weaknesses |
|---|---|
| 1. A growing number of enterprises with technological innovations that actively produce (acquire) new knowledge. There is an increase (unstable) in the cost of producing (acquiring) new knowledge | 1. The share of innovative firms in the total number of enterprises isinsignificant |
| 2. The patent activity has positive trends, especially concerning applications for registration of utility models and industrial designs | 2. The sales of patents are insignificant |
| 3. The structure of innovation-active enterprises by their size corresponds to the average European trend. There is an increase in the number of all categories of innovative enterprises | 3. The structure of the acquired new knowledge is irrational, given the existing needs of enterprises |
| 4. The number of enterprises implementing marketing and organisational innovations is growing | 4. The fluctuations occur in the number of enterprises implementing technological innovations. There are no tendencies showing their growth |
Tab. 4
Opportunities and threats of knowledge management in industrial enterprises of Ukraine
| Opportunities | Threats |
|---|---|
| 1. The needs of production and commercialisation of new knowledge that serve as the basis for innovation: intellectual property, innovative products, and technologies | 1. The weakness of the national innovation system: low effectiveness of state regulation and stimulation of innovative activities; an underdeveloped innovation infrastructure, etc. |
| 2. The existence of competitive advantages in certain industries, which will allow implementing the strategy of advanced innovation development | 2. Almost no state industrial policy, the tendency to deindustrialise the country |
| 3. Enhancing problems that cannot be solved with the help of existing equipment and technologies and management methods. This creates opportunities for innovative breakthroughs as a way to solve problems | 3. The growing technological gap between Ukraine and the developed countries |
| 4. Encouraging the return of qualified personnel who have knowledge, experience, and connections abroad; encouraging the creation of small and medium-sized industrial enterprises | 4. Threats of the global economic crisis and economic recession in world markets |
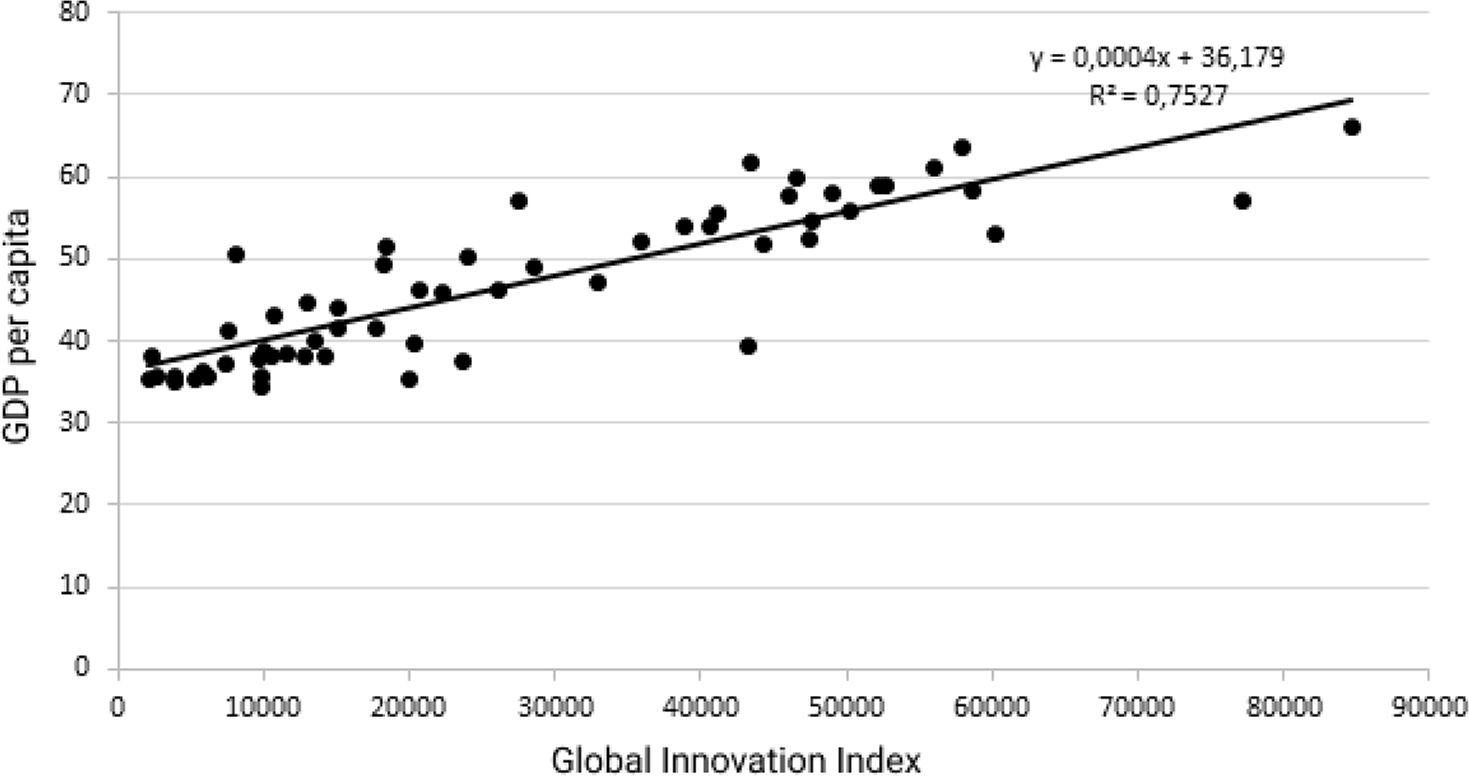
Fig. 8
Stochastic convergence between the country’s Global Innovation Index and GDP per capita
Source: Shypulina (2017).