
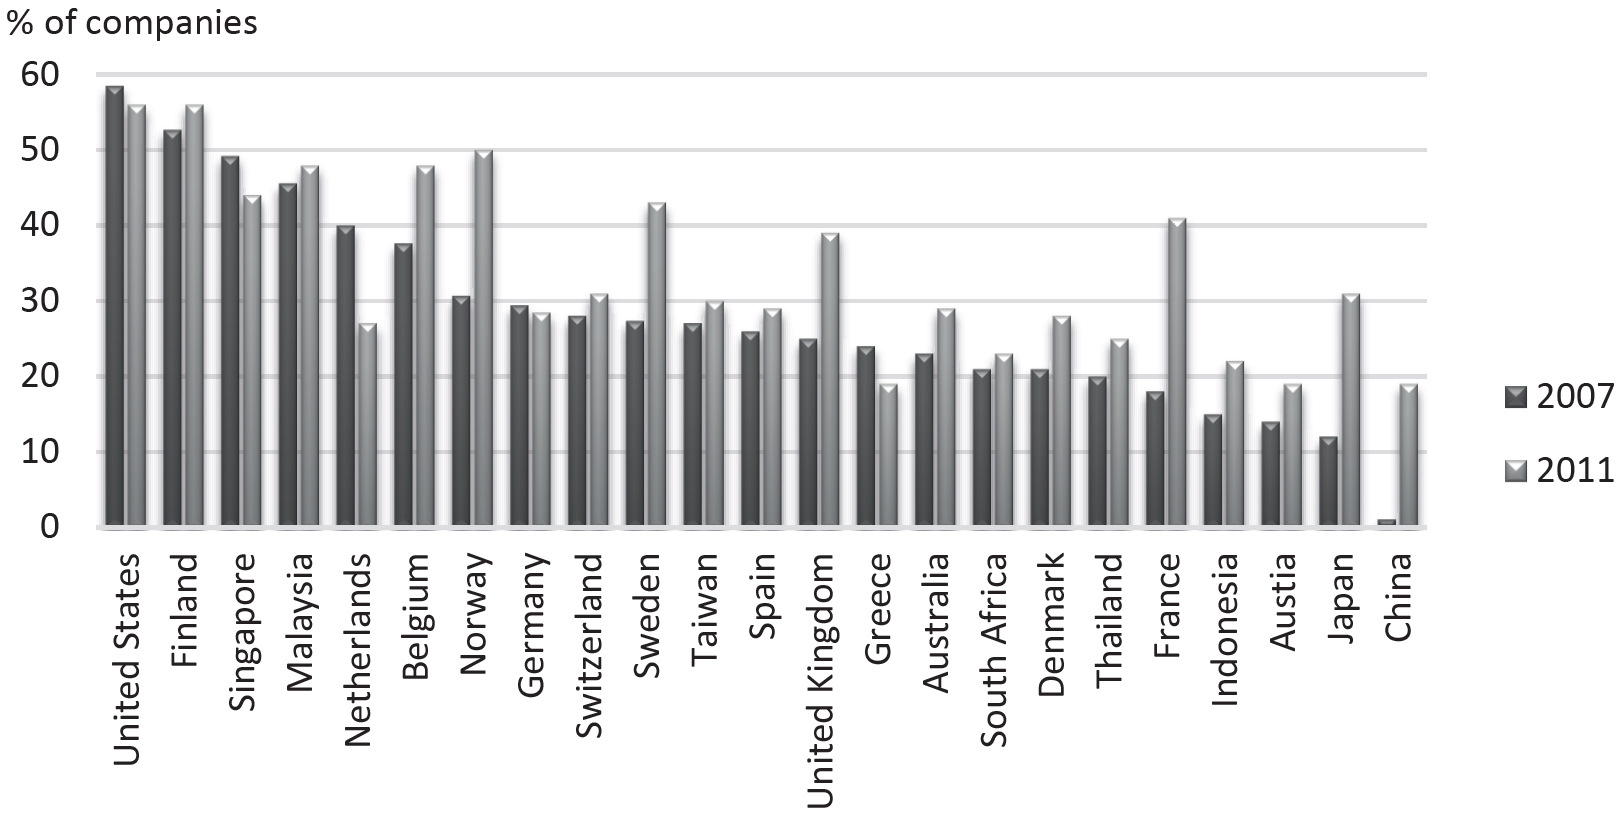
Fig. 1
Percentage of manufacturing companies with an integrated product and service offerings
Source: elaborated by the author based on (Neely, 2008; Neely et al., 2011).
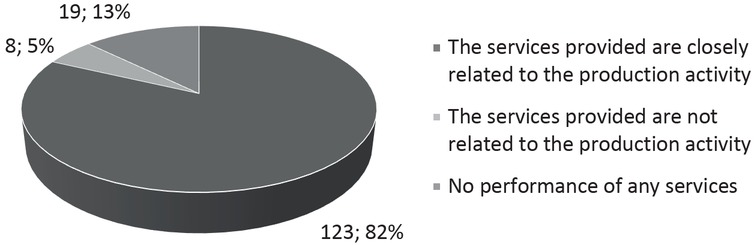
Fig. 2
Structure of the research sample in terms of services delivered
Tab. 1
Frequency of services provided by the surveyed manufacturers of the machine industry
| SERVICE TYPE | ASSESS ON A SCALE FROM 1 TO 7, HOW OFTEN THESE SERVICES ARE PROVIDED, IF: 1 – MEANS THAT THESE SERVICES ARE NOT PROVIDED AT ALL IN THE COMPANY, 7 – MEANS THAT THESE SERVICES ARE PROVIDED VERY OFTEN (SEVERAL TIMES A MONTH/DAILY) PERCENT [%] | |||||||
|---|---|---|---|---|---|---|---|---|
| 1 | 2 | 3 | 4 | 5 | 6 | 7 | sum | |
| Warranty after-sales service | 19 | 2 | 3 | 1 | 3 | 23 | 49 | 100 |
| Post-warranty after-sales service | 22 | 1 | 2 | 1 | 5 | 22 | 47 | 100 |
| Pre-sales consultations | 24 | 3 | 3 | 3 | 7 | 15 | 44 | 100 |
| Maintenance and technical support | 30 | 0 | 3 | 6 | 11 | 19 | 31 | 100 |
| Industrial services (machining, milling, cutting, bending and other manufacturing services) | 30 | 3 | 1 | 2 | 11 | 20 | 33 | 100 |
| Modernisation, overhauls, regeneration | 35 | 3 | 5 | 4 | 17 | 21 | 15 | 100 |
| Assembly and/or implementation | 36 | 1 | 2 | 6 | 9 | 23 | 23 | 100 |
| After-products sales training and technical advice for | 39 | 5 | 1 | 4 | 18 | 15 | 17 | 100 |
| Transport | 42 | 5 | 5 | 3 | 9 | 19 | 17 | 100 |
| Research, expert opinions | 59 | 4 | 5 | 8 | 7 | 13 | 4 | 100 |
| Disposal, product (scrapping equipment/and/machinery) or recycling of waste | 70 | 3 | 1 | 5 | 12 | 7 | 3 | 100 |
| Monitoring | 74 | 2 | 3 | 2 | 8 | 3 | 7 | 100 |
| Maintenance | 79 | 4 | 2 | 5 | 5 | 3 | 2 | 100 |
| Rental | 89 | 3 | 2 | 1 | 3 | 0 | 2 | 100 |
| Financial support (loans, instalments) | 91 | 1 | 3 | 2 | 1 | 1 | 1 | 100 |
| Leasing | 92 | 3 | 1 | 1 | 3 | 1 | 0 | 100 |
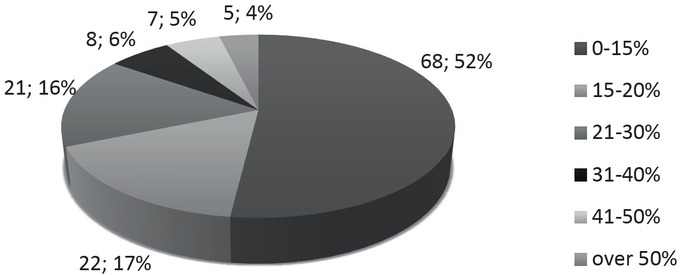
Fig. 3
Share of revenues from the provision of services in total revenues
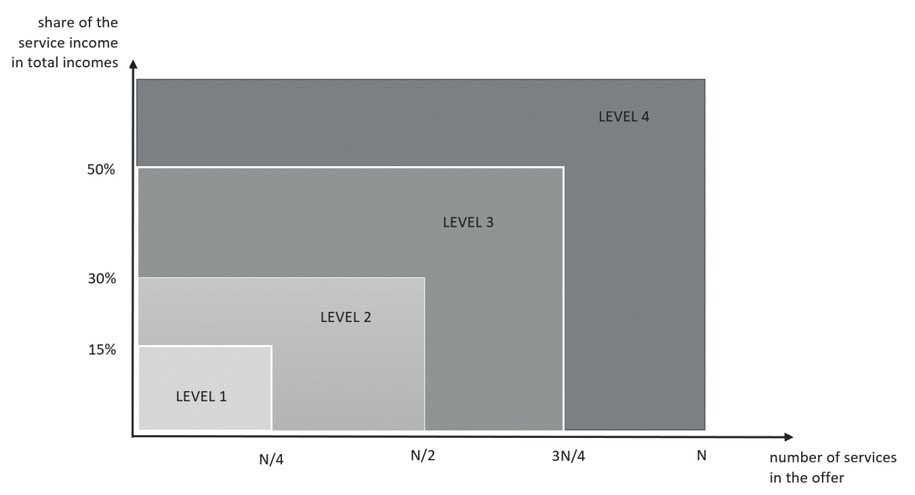
Fig. 4
Original model for classifying the level of product and service integration in the activity of a manufacturing company
Tab. 2
Level of product–service integration of the surveyed enterprises according to the authors of the classification model
| LEVEL | CHARACTERISTICS OF THE LEVEL SETTINGS | NUMBER OF COMPANIES | PERCENT [%] |
|---|---|---|---|
| 1 | Number of services <6 and the share of the service income in the total income below 15% | 11 | 7 |
| 2 | Number of services between 6 and 11, or the share of the service income in the total income between 15% and 30% | 76 | 51 |
| 3 | Number of services between 11 and 17, or the share of the service income in the total income between 30% a 50% | 39 | 26 |
| 4 | Number of services >17, or the share of the service income in the total income more than 50% | 5 | 3 |
| Beyond qualification | No services in the offer | 19 | 13 |