
Socio-demographic data play a vital role in research across various fields, including sociology, public health, economics, tourism and hospitality, food production, and marketing, among others. This data enables researchers to understand population characteristics and trends, ultimately addressing societal challenges (Singh et al., 2017). Grady (2018) emphasises the importance of socio-demographic data for understanding demographics, identifying trends, and making informed decisions. He also notes that such data is crucial for selecting a representative sample, ensuring diversity and balance for the extrapolation of findings. Fagerland et al. (2013) add that descriptive statistics leverage socio-demographic data to summarise study respondents‘ characteristics using frequencies, percentages, means, and standard deviations. According to Cohen et al. (2013), socio-demographic variables can serve as covariates in statistical analyses, establishing independent relationships between variables. Researchers also use socio-demographic data for stratification, comparing and identifying discrepancies across different population segments (Newman, 2014).
Culinary tourism, an area of growing interest among tourism academics, has seen tourists place increasing value on food and drink experiences (Long, 2017). Scholars such as Everett (2019), Okumus et al. (2018), and Ellis et al. (2018) note that interest in culinary tourism has surged as food has shifted from being merely a necessity during vacations to becoming a central component of the travel experience. However, Okumus et al. (2021) observe that many of the notable studies on culinary tourism are outdated, with a lack of innovative or game-changing research in recent years. Despite the academic and financial significance of culinary tourism, literature is predominantly produced in developed countries (Duarte Alonso & O‘Neill, 2010). Okumus et al. (2018) highlight the need for more empirical research to advance culinary tourism in developing countries, including Ghana. Thus, this study focusing on Ghana is timely and relevant.
The World Travel and Tourism Council (World Travel and Tourism Council, 2020) predicted that Ghana’s tourism industry would employ 746,400 people by 2029. However, the former Minister of Tourism, Arts, and Culture, Hon. Barbara Oteng-Gyasi, raised concerns about the lack of accurate data on tourism (GTA, 2019). While culinary tourism is briefly discussed in the literature, it remains underexplored (Lai et al., 2019). Previous researchers, including Lee et al. (2018), Grady (2018), and Singh et al. (2017), assert that socio-demographic characteristics have a positive and significant influence on tourist loyalty. This study examines the impact of socio-demographic characteristics on tourist loyalty, utilising data from Ghana. The research seeks:
To identify which sociodemographic characteristics significantly influence international tourists’ loyalty towards Ghana as a culinary destination.
2. To examine the effect of international culinary tourists’ sociodemographic characteristics (gender, age, marital status, education, occupation, and income) on destination loyalty in Ghana.
This study aims to bridge the knowledge gap regarding culinary tourism in developing countries, with a particular focus on Ghana.
Socio-demographic characteristics analyse the social and economic dynamics of a population. These factors include age, gender, education, marital status, country of origin, wealth, occupation, and other related elements, which together provide a comprehensive understanding of a population’s profile (United Nations and World Tourism Organization-UNWTO). Socio-demographic characteristics are vital for policymakers, researchers, and institutions in addressing social and economic challenges. By analysing these factors, they can develop targeted interventions and policies to improve societal outcomes. This data is important for understanding social trends, disparities, and inequalities, especially in areas like education, health, and income (UNWTO). This data is also instrumental in predictive modelling, as it helps forecast future outcomes based on population characteristics (Hastie et al., 2009). In research methodology, socio-demographic data influence key aspects such as sample selection, analysis, and interpretation, contributing to the robustness and validity of research findings. Furthermore, it is essential to consider privacy.
Socio-demographic data is vital for understanding the characteristics and preferences of culinary tourists, enabling destinations and organisations to tailor their offerings and marketing strategies (Li et al., 2013). This data provides insights into tourists‘ preferences based on factors such as age, gender, marital status, education level, occupation, and cultural background. Market segmentation based on these factors allows businesses to target specific tourist segments, especially higher-income tourists, with tailored experiences (Bruwer & Alant, 2009).
Gender is an important factor influencing culinary tourist behaviour. Studies suggest that gender can be used to assess the relationship between culinary experiences and loyalty. Female tourists tend to prioritise safety and security, while male tourists are more adventurous, resulting in different loyalty patterns (Kim & Eves, 2012; Larson et al., 2014; Backman & Crompton, 1991).
Age also plays a significant role in tourist loyalty. Younger tourists, like millennials, tend to be more adventurous and seek unique culinary experiences, exploring street food and trendy eateries. In contrast, older tourists, such as baby boomers and seniors, value traditional and authentic culinary experiences, preferring fine dining and local cuisine that reflect cultural heritage (Baloglu & Uysal, 1996; Ayeh et al., 2013).
Social media usage by younger tourists can influence their culinary preferences and loyalty, with younger travellers gravitating toward trends, while older tourists may prefer classical culinary arts (Kivela & Crotts, 2006; López-Guzmán & Sánchez-Cañizares, 2012; Xiang & Gretzel, 2010).
Education influences travel involvement and interest, as well-educated tourists are more likely to seek intellectually stimulating activities and deeply engage with local cultures through food. Tourists with higher education levels tend to appreciate cultural culinary experiences, showing greater loyalty to destinations rich in culinary heritage (Hwang & Ok, 2012). They are more likely to participate in culinary activities, which enhances their loyalty (Hjalager & Richards, 2002). These tourists often have higher expectations for quality and authenticity in their culinary experiences (Hjalager & Richards, 2002).
Income and employment status significantly affect culinary tourist loyalty. Higher-income tourists can afford luxury services and premium culinary experiences, which increases their loyalty to high-end destinations (Lee et al., 2018). Tourists with full-time jobs often have more disposable income to spend on dining at expensive restaurants and participating in culinary activities (Shani & Wang, 2013). High-income tourists are more likely to visit destinations known for their culinary expertise, reinforcing their loyalty to such destinations (Santich, 2011). These submissions conclude that socio-demographic characteristics like gender, age, education, and income significantly influence culinary tourists’ preferences and loyalty. Understanding these factors helps destinations and businesses tailor their offerings to meet the expectations of different tourist segments.
Table 1 shows the socio-demographic characteristics of tourists who visited Ghana from 2019 to 2022. Ghana’s tourism industry had notable demographic and behavioural shifts between 2019 and 2022. The majority of tourists stayed in the 30-to 39-year-old age range, indicating a base of active and well-off travellers, but the gender difference shrank as the number of male tourists rose. Most tourists were highly educated, reflecting a well-informed and experience-driven visitor profile. Travel incentives grew beyond business to include family, social, and recreational purposes. Significantly, the increase in return trips showed growing destination loyalty, probably as a result of satisfying cultural and gastronomic experiences in Ghana.
Socio-demographics of international tourists in Ghana from 2019 to 2022
| Year | 2019 | 2020 | 2021 | 2022 |
|---|---|---|---|---|
| Gender | ||||
| Male | 28% | 38% | 42.55% | |
| Female | 72% | 62% | 57.45% | |
| Age bracket | ||||
| 18 & below years | 1.60% | 0.99% | 5.00% | 1.93% |
| 18-29 | 30.70% | 31.90% | 45.60% | 3.86 |
| 30-39 | 28% | 28.30% | 28.20% | 32.35% |
| 40-49 | 20.50% | 18.70% | 18.10% | 21.34% |
| 50-59 | 12.20% | 12.10% | 2.70% | 10.25% |
| 60 and above | 7% | 8.10% | 0.40% | 0.28% |
| Education | ||||
| High school | 12% | *** | *** | *** |
| Bachelor | 48% | *** | *** | *** |
| Postgraduate | 33% | *** | *** | *** |
| Others | 7% | *** | *** | *** |
| Employment | ||||
| Employed | 73% | *** | 47.00% | *** |
| Self-Employed | 14% | *** | 33.60% | *** |
| Unemployed Student | 5% | *** | 3.60% | *** |
| Retired | 6% | *** | 14.60% | *** |
| Others | 3% | *** | 1.20% | *** |
| Purpose of Visit | ||||
| Business | 32% | 33.7% | 29.7% | 24.2% |
| Family & friends | 13% | 12.5% | 23.6% | 19.9% |
| Holidays | 14% | 12.3% | 14.9% | 12.9% |
| Conference | 10% | 5.3% | 3.8% | 10.1% |
| Others | 8% | 0.7% | 3.2% | 5.7% |
| Number of times visited | ||||
| 1st Time | 66% | 39.69% | 24.67% | |
| 2nd Time | 15% | 23.35% | 17.51% | |
| 3rd Time | 14% | 9.34% | 10.88% | |
| More than 3 Times | 15% | 27.62% | 46.94% |
Source: GTA, DiGH, IATS, 2022
A conceptual framework plays a crucial role in organising evidence, explaining the phenomena being studied, guiding future research, and serving as a reference tool. It enhances the scientific process by specifying hypotheses more clearly, which improves their falsifiability, even when hypotheses of the main theory are adjusted due to incorrect predictions (McDonald et al., 2021).
In the context of culinary tourism and tourist loyalty, various researchers have proposed theoretical frameworks. The conceptual model used in this study focuses on two main components:
Figure 1 below illustrates the conceptual framework for this study
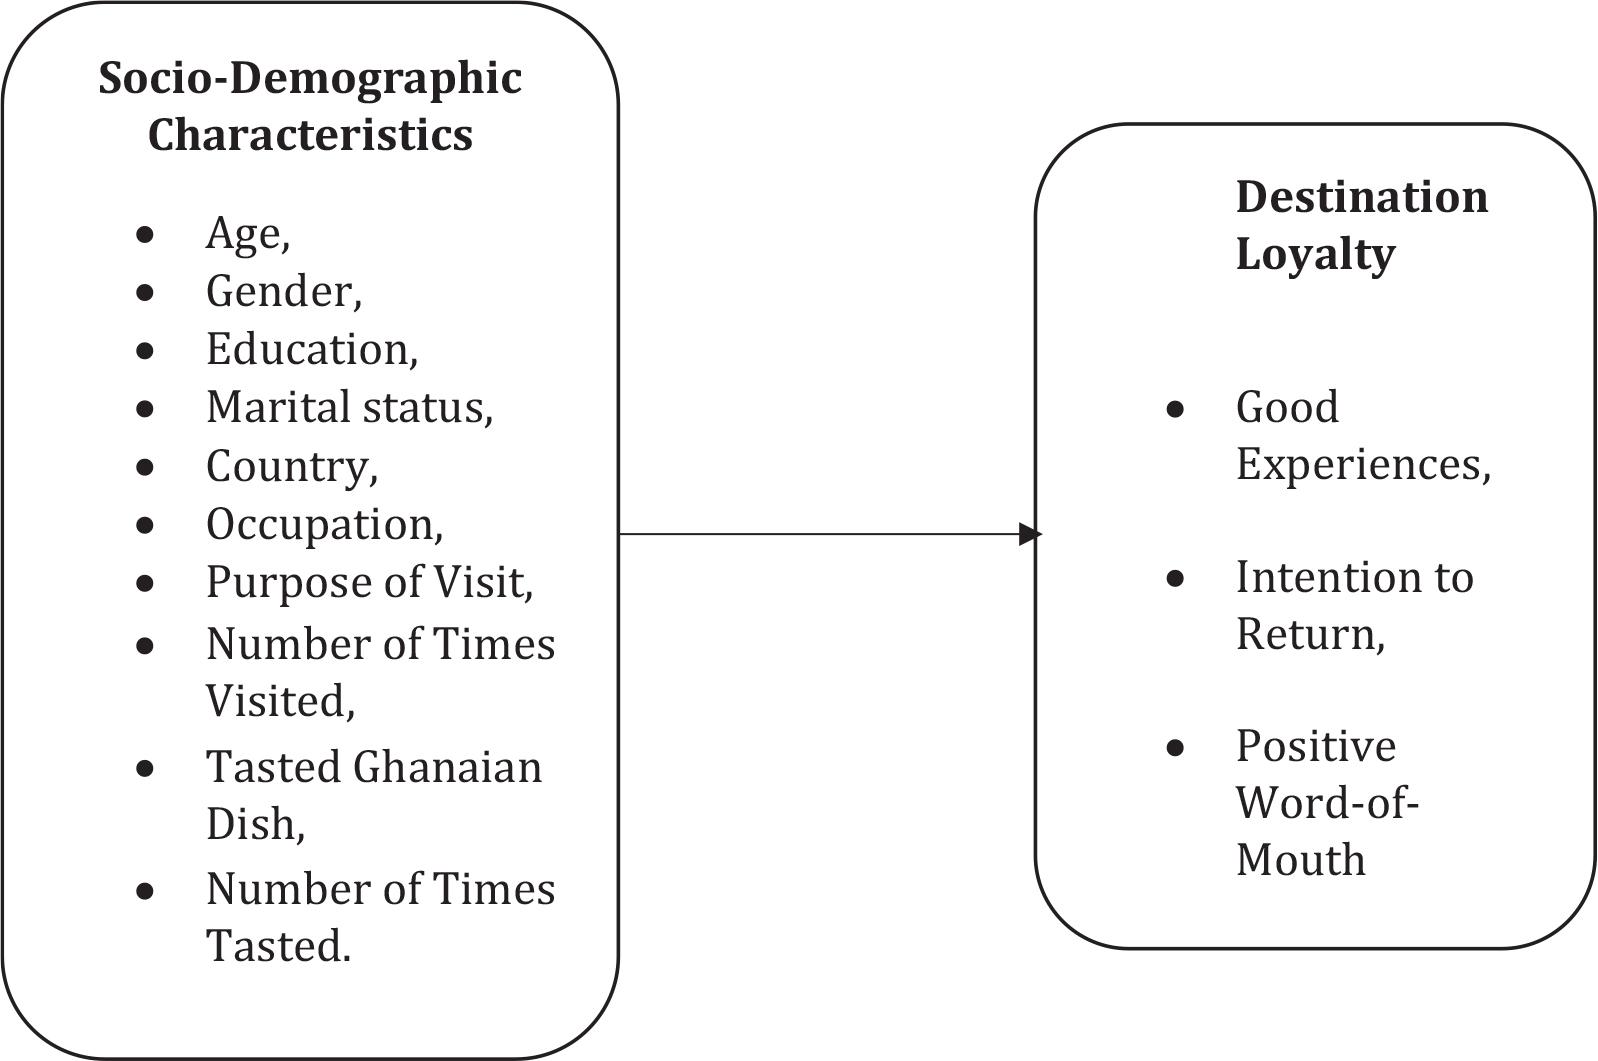
Conceptual Framework
Source: Researcher’s Constructs, 2023
Independent variable: Socio-demographic characteristics, measured by ten items including gender, age, marital status, place of origin, education level, occupation, trip purpose, frequency of visits, and experiences with Ghanaian cuisine.
Dependent variable: Tourist loyalty was assessed using three items:
Pleasant/positive experiences
Intention to return
Willingness to recommend (good word of mouth)
Several researchers have proposed frameworks to explore the relationships between culinary tourism, tourist loyalty, tourist satisfaction, and tourist motivation (Antón et al., 2017; Hendijani, 2016; Lee et al., 2017; Mahfuzur et al., 2020; Hernández-Mogollón et al., 2020; Liat et al., 2020; Jeong & Kim, 2019; Kumar et al., 2019). This study’s theoretical framework draws from the research models of Lee et al. (2017), Mahfuzur et al. (2020), Hernández-Mogollón et al. (2020), Liat et al. (2020), Jeong and Kim (2019), and Kumar et al. (2019). Based on previous research (Backman & Crompton, 1991; Baloglu & Uysal, 1996; Hsu et al., 2007; Chen & Chen, 2010; Yüksel et al., 2010; Kim & Eves, 2012; Lee et al., 2018), the study hypothesised that socio-demographic characteristics of culinary tourists significantly influence their loyalty to destinations based on previously known correlation.
H1: Culinary tourists’ socio-demographic characteristics influence tourist destination loyalty
As presented in Figure 2 below.

Conceptual Framework
Source: Researcher’s Constructs, 2023
A cross-sectional study involving international tourists was conducted in the Greater Accra Region of Ghana over a two-month period, from January to February 2023. The study adopted a positivist research paradigm, which emphasises objectivity, measurement, and the use of empirical data to explain relationships among variables. In line with this paradigm, a quantitative research approach was employed to systematically collect and analyse numerical data, thereby enabling the researcher to assess the effect of international tourists’ socio-demographic characteristics on destination loyalty in Ghana’s culinary tourism.
The Kotoka International Airport (KIA) in Accra was purposively selected as the study site due to its significance as Ghana’s main international gateway and the first point of contact for most international tourists. The location was ideal for obtaining a diverse sample of respondents representing different countries, age groups, and travel purposes.
A convenience sampling technique was employed to select respondents who were readily available and willing to participate in the study. To ensure relevance, only international tourists who had tasted at least one indigenous Ghanaian dish were included in the sample, as their culinary experiences were central to the study objectives.
Data were collected using a structured, self-administered questionnaire (see Appendix 1), which was designed to gather comprehensive information on respondents’ socio-demographic characteristics and their levels of destination loyalty. The questionnaire consisted of closed-ended questions and Likert-scale items that facilitated quantitative analysis. The instrument was divided into sections covering:
Socio-demographic characteristics, including gender, age, marital status, educational level, occupation, country of origin, main purpose of visit, number of visits to Ghana, and experience with Ghanaian food (whether they had tasted it and how many times).
Tourist destination loyalty, which focused on the respondents’ likelihood of revisiting Ghana, recommending it to others, and their overall satisfaction with the culinary experience.
Before the main data collection, the questionnaire was pre-tested on a small sample of international tourists to ensure clarity, reliability, and content validity. Revisions were made based on the feedback received to improve the structure and flow of the questions.
Data collected were coded and analysed using the IBM Statistical Package for the Social Sciences (SPSS) version 27. Descriptive statistics such as frequencies, percentages, and means were used to summarise the data, while inferential statistics, such as correlation and regression analyses, were employed to examine the influence of socio-demographic variables on tourist loyalty.
This methodological approach ensured a rigorous and systematic analysis of how international tourists’ socio-demographic backgrounds shape their culinary experiences and loyalty intentions toward Ghana as a culinary destination. The results provide valuable insights for tourism planners, hospitality practitioners, and policy makers in designing targeted strategies to enhance tourist satisfaction and repeat visitation.
Table 2 provides a comprehensive overview of the respondents‘ demographic information, including their gender, age, marital status, country of origin, occupation, level of education, purpose of visit, number of visits to Ghana, experience with eating Ghanaian dishes, and frequency of tasting these dishes. This analysis offers vital information about the makeup of the sample population, which is necessary for understanding the data and drawing conclusions from the study. Out of the 374 participants majority (69.8%) were female within the age bracket between 20 and 40 years old. Most of the respondents (60.7%) were married, with 92.8% having a tertiary education. The findings indicate that the bulk of respondents (25.9%) were Americans, with a total of 97 respondents, followed by individuals from Britain, accounting for 21% of the sample. 78.6% were employed, with one person retired.
Profile of respondents
| Variable | N=374 | Percent (%) |
|---|---|---|
| Gender | ||
| Male | 113 | 30.2% |
| Female | 72% | 69.8% |
| Age | ||
| Under 20 | 54 | 14.4% |
| 20-40 | 256 | 68.4% |
| 41-60 | 58 | 15.5% |
| Over 60 | 6 | 1.6% |
| Marital status | ||
| Single | 141 | 37.7% |
| Married | 227 | 60.7% |
| Separated | 5 | 1.3% |
| Widowed | 1 | 0.3% |
| Education | ||
| Middle | 1 | 0.3% |
| High | 26 | 7.0% |
| Tertiary | 347 | 92.8% |
| Country | ||
| America | 97 | 25.9% |
| Britain | 80 | 21.4% |
| Canada | 33 | 8.8% |
| China | 47 | 12.6% |
| Cote d'Ivoire | 10 | 2.7% |
| France | 9 | 2.4% |
| Germany | 63 | 16.8% |
| Netherlands | 12 | 3.2% |
| Nigeria | 13 | 3.5% |
| South Africa | 10 | 2.7% |
| Occupation | ||
| Student | 78 | 20.9% |
| Employed | 29.4 | 78.6% |
| Unemployed | 1 | 0.3% |
| Retired | 1 | 0.3% |
Source: Primary Data Processes (2023)
The data presented in Table 3 reveal the reasons for visitation. According to the table, the majority (59.9%) indicated holidays, followed by friends and family, food, conference or business, and other reasons. Regarding the frequency of visits to Ghana, most (41.2%) respondents reported 3 times, followed by 2 times, more than 2 times and 1st-time visitors. The participants were questioned on their experience with Ghanaian cuisine, and the findings indicate that all of them affirmed having experienced the local cuisines from Ghana, with a 100% response rate. The survey asked respondents how often they had tasted Ghanaian dishes. The results show that most (70.3%) of the respondents had tried more than three times.
Related items to tourist visitation
| Variable | N=374 | Percent (%) |
|---|---|---|
| The main purpose of the visit | ||
| Food | 12 | 3.2% |
| Friends & Family | 115 | 30.7% |
| Holidays | 224 | 59.9% |
| Conference Business | 22 | 5.9% |
| Others | 1 | 0.3% |
| Number of Visits to Ghana | ||
| 1stTime | 29 | 7.8% |
| Two Times | 129 | 34.5% |
| Three Times | 154 | 41.2% |
| More than three times | 62 | 16.6% |
| Have you ever tasted any of the Ghanaian dishes? | ||
| Yes | 374 | 100.0% |
| How many times have you tasted any of the Ghanaian dishes? | ||
| 1st Times | 1 | 0.3% |
| Two Times | 22 | 5.9% |
| Three Times | 88 | 23.5% |
| More than three times | 263 | 70.3% |
Source: Primary Data Processes (2023)
In this section, the relationship between demographic factors (gender, age, marital status, education level, and occupation) and tourist loyalty is examined using Analysis of Variance (ANOVA). The significance level was set at 0.05, and the analysis aims to determine if these demographic characteristics influence loyalty. The findings of the analysis provide insights into the potential impact of demographic factors on loyalty and whether certain factors contribute to significant differences in loyalty among respondents.
The analysis of gender revealed no significant differences in loyalty between male and female respondents. The F-value of 0.441 and the p-value of 0.507 indicate that the variation in loyalty scores between males and females is not statistically significant. Since the p-value is greater than the 0.05 threshold, we fail to reject the null hypothesis, suggesting that gender does not have a meaningful effect on tourist loyalty. This implies that both male and female respondents exhibit similar loyalty behaviours toward tourism services, and no distinction should be made based on gender when considering loyalty-building strategies.
For age, the analysis showed no significant differences in loyalty between youthful and adult respondents. With an F-value of 0.157 and a p-value of 0.960, the results indicate that age does not play a significant role in shaping loyalty. The variance between the two age groups was found to be minimal, and the high p-value suggests that age does not influence the level of loyalty respondents exhibit toward tourism services. Therefore, age is not a determining factor in shaping loyalty behaviours among the respondents, and targeting specific age groups for loyalty programs may not be warranted.
The marital status of respondents was also analysed, and the results revealed no significant difference in loyalty between married and single respondents. The F-value of 1.706 and p-value of 0.148 suggest that marital status does not significantly affect loyalty. While there is some variance in loyalty scores between married and single individuals, the difference is not large enough to be statistically significant. This finding indicates that marital status does not have a considerable impact on how loyal individuals are to tourism services, and loyalty strategies should not prioritise marital status as a distinguishing factor.
In examining occupation, the analysis found no significant differences in loyalty between employed and unemployed respondents. The F-value of 1.612 and p-value of 0.186 show that occupation does not significantly influence loyalty. Although there is some variance between employed and unemployed respondents, it is not statistically significant, as evidenced by the p-value being greater than the 0.05 threshold. This result suggests that occupation does not affect respondents‘ loyalty levels and should not be a major consideration when developing loyalty programmes.
Lastly, the educational level was analysed, and the results showed a statistically significant difference in loyalty between respondents with different educational levels. The F-value of 4.542 and p-value of 0.011 indicate that the level of education influences tourist loyalty. Respondents with higher educational levels showed higher loyalty scores, suggesting that education plays a role in shaping loyalty behaviours. This finding highlights the importance of considering education as a demographic factor when designing loyalty programs, as those with higher education may exhibit stronger loyalty to tourism services compared to those with lower education levels. As shown in Table 4 below.
Anova results on differences of the demographic profile on respondents‘ loyalty
| Tests of Between-Subjects Effects | |||||
|---|---|---|---|---|---|
| Dependent Variable: Tourist Loyalty | |||||
| Source | Sum of Squares | Df | Mean Square | F | Sig. |
| Model | 8549.774a | 15 | 569.985 | 9959.369 | .000 |
| Gender | .025 | 1 | .025 | .441 | .507 |
| Age | .036 | 4 | .009 | .157 | .960 |
| Marital status | .390 | 4 | .098 | 1.706 | .148 |
| Occupation | .277 | 3 | .092 | 1.612 | .186 |
| Education | .520 | 2 | .260 | 4.542 | .011 |
| Error | 20.546 | 359 | .057 | ||
| Total | 8570.320 | 374 | |||
| a. R Squared = .998 (Adjusted R Squared = .998) | |||||
Source: Primary Data Processes (2023)
The reliability of the research instrument was evaluated using Cronbach’s Alpha in SPSS (version 27). Reliability analysis is essential in determining the internal consistency of items used in measuring constructs within a study (McDaniels & Gates, 2012). According to Field (2018), a measurement scale is considered reliable when it consistently yields similar results across repeated trials. Establishing reliability enhances the credibility and validity of research findings (Alasuutari et al., 2008).
McDaniels and Gates (2012) identify three key methods for assessing reliability: the test–retest, parallel forms, and internal consistency approaches. Among these, the internal consistency method is most applicable to cross-sectional studies such as this one. Internal consistency determines the degree to which items within a construct are interrelated and measure the same underlying concept (Netemeyer et al., 2003). The split-half reliability and Cronbach’s Alpha are common methods used under internal consistency (Zikmund et al., 2010).
Given the cross-sectional nature of this research, the Cronbach’s Alpha method was adopted, as the test–retest and parallel forms methods are more suited for longitudinal designs. Cronbach’s Alpha provides an index of how closely related a set of items is as a group. Hair et al. (2014, 2018) suggest that a Cronbach’s Alpha value of 0.70 or higher indicates acceptable internal consistency, while values closer to 1.0 reflect stronger reliability.
As presented in Table 5, the reliability coefficients for the two main constructs — Socio-Demographic Characteristics and Loyalty, were 0.841 and 0.807, respectively. Both values exceed the acceptable threshold of 0.70, implying that the items used in measuring these constructs are internally consistent and reliable.
Reliability test using Cronbach’s Alpha
| Constructs | Number of Items | Cronbach’s Alpha |
|---|---|---|
| 1. Socio – Demographic Characteristics | 9 | 0.841 |
| 2. Loya lty | 4 | 0.807 |
Source: Field Study, 2023
Specifically, the Socio-Demographic Characteristics construct, with nine (9) items, achieved a Cronbach’s Alpha of 0.841, signifying a high level of internal consistency among its measurement items. Similarly, the Loyalty construct, consisting of four (4) items, yielded a Cronbach’s Alpha of 0.807, which also indicates satisfactory reliability. These results confirm that the instrument employed in this study was statistically reliable and suitable for further analysis.
The study analysed the relationship between socio-demographic factors and tourist loyalty in culinary tourism, focusing on 374 international tourists from ten countries who visited Ghana. The findings revealed that the majority of respondents were female, with millennials aged between 20 and 40 years being the most active participants in seeking distinctive and authentic culinary experiences. The top five countries among Ghana’s leading source markets were the United States, Nigeria, the United Kingdom, Germany, and China, with France consistently ranking tenth.
Most respondents were employed, with 78.6% holding stable jobs and 20.9% being students. These groups demonstrated a strong appreciation for local cuisine, a high interest in food and wine pairing, and elevated expectations for food quality and authenticity. They were also more likely to engage in culinary activities such as cooking classes, wine tastings, and other immersive food experiences, which contribute significantly to destination loyalty. High-income tourists, in particular, exhibited higher standards for food and service quality and tended to prefer exclusive experiences such as private chef meals or personalised wine tastings. Their travel decisions and destination recommendations were often influenced by social networks and online platforms.
Approximately half of the respondents identified holidays as their primary reason for visiting Ghana, with food and cuisine ranking fourth after family and friends, and conference/business purposes. Tourists motivated by culinary adventures and food experiences were more inclined to revisit destinations that offered diverse, high-quality, and authentic gastronomic experiences. Destinations that provide calm dining environments, culinary wellness experiences, adventurous food events, cooking lessons, workshops, and themed dining opportunities, such as romantic, celebratory, or business-oriented dining, are more likely to attract and retain these tourists.
Nearly half of the respondents had visited Ghana for at least the third time, and all (100%) had tasted Ghanaian food, underscoring the strong appeal of local cuisine. The findings support previous research indicating that satisfied culinary tourists are more likely to revisit destinations that provide rich and authentic food experiences. However, the study found that most socio-demographic characteristics, including gender, age, marital status, and occupation, did not significantly influence tourist loyalty, except for the highest educational level. This suggests that while education may shape tourists’ perceptions and loyalty behaviours, not all demographic factors have a statistically significant impact on culinary destination loyalty in Ghana.
The study examines the effect of international tourists’ socio-demographic characteristics on destination loyalty in culinary tourism, focusing on 374 international tourists from 10 countries who visited Ghana. Most respondents were female millennials seeking unique culinary experiences. The top five countries represented were the United States, Nigeria, the UK, Germany, and China. High-income tourists exhibited higher expectations for food and service quality, preferring exclusive culinary experiences. Holidays were the main reason for visiting Ghana, with food and cuisine ranked fourth. Tourists pursuing culinary adventures and authentic food experiences showed a higher likelihood of returning. However, socio-demographic variables such as gender, age, marital status, and occupation did not significantly influence tourist loyalty; only education showed a significant effect.
The study recommends enhancing culinary offerings through diverse, authentic, and high-quality experiences, including cooking classes, workshops, and wine tastings. Exclusive culinary experiences should target high-income tourists, while millennials should be engaged through social media. Culinary wellness and educational experiences should be promoted to appeal to varied tourist motivations. Additionally, destinations should balance food-related experiences for leisure, business, and family travellers. Leveraging word of mouth and strengthening online presence can further enhance Ghana’s reputation among culinary tourists. Future research should examine the moderating or mediating roles of these factors.