
From a sustainability perspective, the world faces a range of global challenges, including climate change, widening social inequalities, and the transition toward a regenerative economy, which are a current focus of the academic community. In this context, companies are increasingly assessed not only on their financial performance but also on their impact on their environmental, social and governance fields. These factors have therefore become important “lens” through which investors, regulators, creditors, suppliers and other stakeholders evaluate whether business strategies are compatible with ESG aims. In tourism, ESG criteria are closely linked to the long-standing discussion on sustainable development. Sustainable tourism, as discussed by Liu (2003), aims to satisfy economic, social, and aesthetic needs while at the same time protecting cultural heritage, key ecological processes, biodiversity and life-support systems. For the hospitality industry, ESG frameworks offer a structured way of integrating environmental concerns, social responsibility and governance quality into both day-to-day operations and long-term planning. However, the relationship between ESG commitments and actual ESG performance in the hospitality industry is not straightforward. It is therefore necessary to examine how specific sustainability practices are incorporated into hospitality companies‘ ESG policies and governance arrangements, and to what extent this integration translates into measurable improvements. A better understanding of these dynamics can help identify how sustainability can be more effectively embedded in hospitality management. Recent empirical studies support the view that ESG is not only a marketing label but also a risk-management tool. Chung et al. (2024), for example, show that ESG investment can enhance hotels’ resilience by improving their ability to respond to unexpected shocks. Similarly, Chen et al. (2022) found that higher ESG ratings are associated with lower transitory return variance and more favourable stock-return dynamics, implying that hotels with firm ESG profiles act more defensively during periods of market instability. Portfolios constructed by ESG-oriented companies can serve as a “safe haven” during turbulent conditions, consistent with the broader objectives of the United Nations Sustainable Development Goals.
To avoid ambiguity in these broad concepts, we explicitly define the indicators examined in this study. Financial performance is analysed through 12 financial indicators, while three elements: (i) equity-based profitability (Return on Equity, ROE), (ii) asset-based profitability (Return on Assets, ROA), and (iii) a valuation channel (Enterprise Value to Revenue, EV/Revenue) are later in the study found to be statistically relevant. ESG performance is operationalised as Sustainalytics’ ESG Risk score, where lower values indicate lower unmanaged ESG risk (i.e., better ESG standing). This conceptual clarity ensures that subsequent analyses, interpretations and comparisons refer to the same well-specified aspects rather than to general, composite notions.
Despite growing attention to ESG in the hospitality sector, the relationship between financial indicators (ROE, ROA, EV/Revenue), firm size (market capitalisation) and ESG risk remains insufficiently explored. In particular, few studies have examined how equity-based profitability (ROE), asset-based profitability (ROA), valuation indicators (e.g., EV/Revenue), and company size (market capitalisation) jointly influence ESG outcomes. Existing studies often examine ESG–performance links at broader industry levels or use composite indices, but they rarely isolate the distinct roles of ROE versus ROA in capitalintensive sectors such as hospitality (e.g., Bae, 2022; Uyar et al., 2020; Bodhanwala & Bodhanwala, 2022; He et al., 2024; Legendre et al., 2024). There is also mixed evidence on whether stronger profitability is associated with better ESG performance, underscoring the need to distinguish these metrics (e.g., De Lucia et al., 2020; Velte, 2017; Xie et al., 2019; Duque-Grisales & Aguilera-Caracuel, 2021). By focusing on ESG Risk and distinguishing ROE from ROA while incorporating valuation and size, this study addresses an industry-specific gap and offers a more precise view of how financial strength relates to sustainability outcomes in the hospitality industry.
This gap creates obstacles for companies trying to combine sustainability and profitability. Accordingly, the main objective of this study is to test whether specific indicators of financial performance and firm size are associated with hospitality companies‘ ESG risk. This study advances two hypotheses aligned with our research goals:
H1: Hospitality companies with stronger financial performance exhibit lower ESG risk.
H2: Larger hospitality companies (higher market capitalisation) exhibit lower ESG risk than smaller companies.
This study is structured as follows. The introduction explains the background, significance and objectives of the study as well as the hypotheses to be tested. The second section provides a comprehensive literature review that analyses the existing research on ESG practices in the hospitality industry and identifies gaps that this study aims to fill. The third section describes the data sources, sample selection and statistical methods used to test the hypotheses. The fourth section presents the results of the correlation analysis and multiple regression and interprets the relationships among financial performance, company size, and ESG ratings. Finally, the discussion and conclusion summarise the key findings and discuss their implications for the hospitality industry.
The hospitality industry has seen a rising interest in research focused on the connection between ESG implementation and operational and financial performance. Current studies show that robust ESG frameworks improve operational efficiency, but also increase financial resilience. These previous studies can be categorised into five thematic areas, as shown in Figure 1. The main areas of focus address several topics, such as the development of ESG frameworks and performance metrics, the interaction between financial performance and sustainability, and consumer behaviour towards ESG practices. Furthermore, leadership, governance structures and the involvement of stakeholders in sustainability efforts, as well as educational approaches to promote ESG competences, are also important areas of interest.
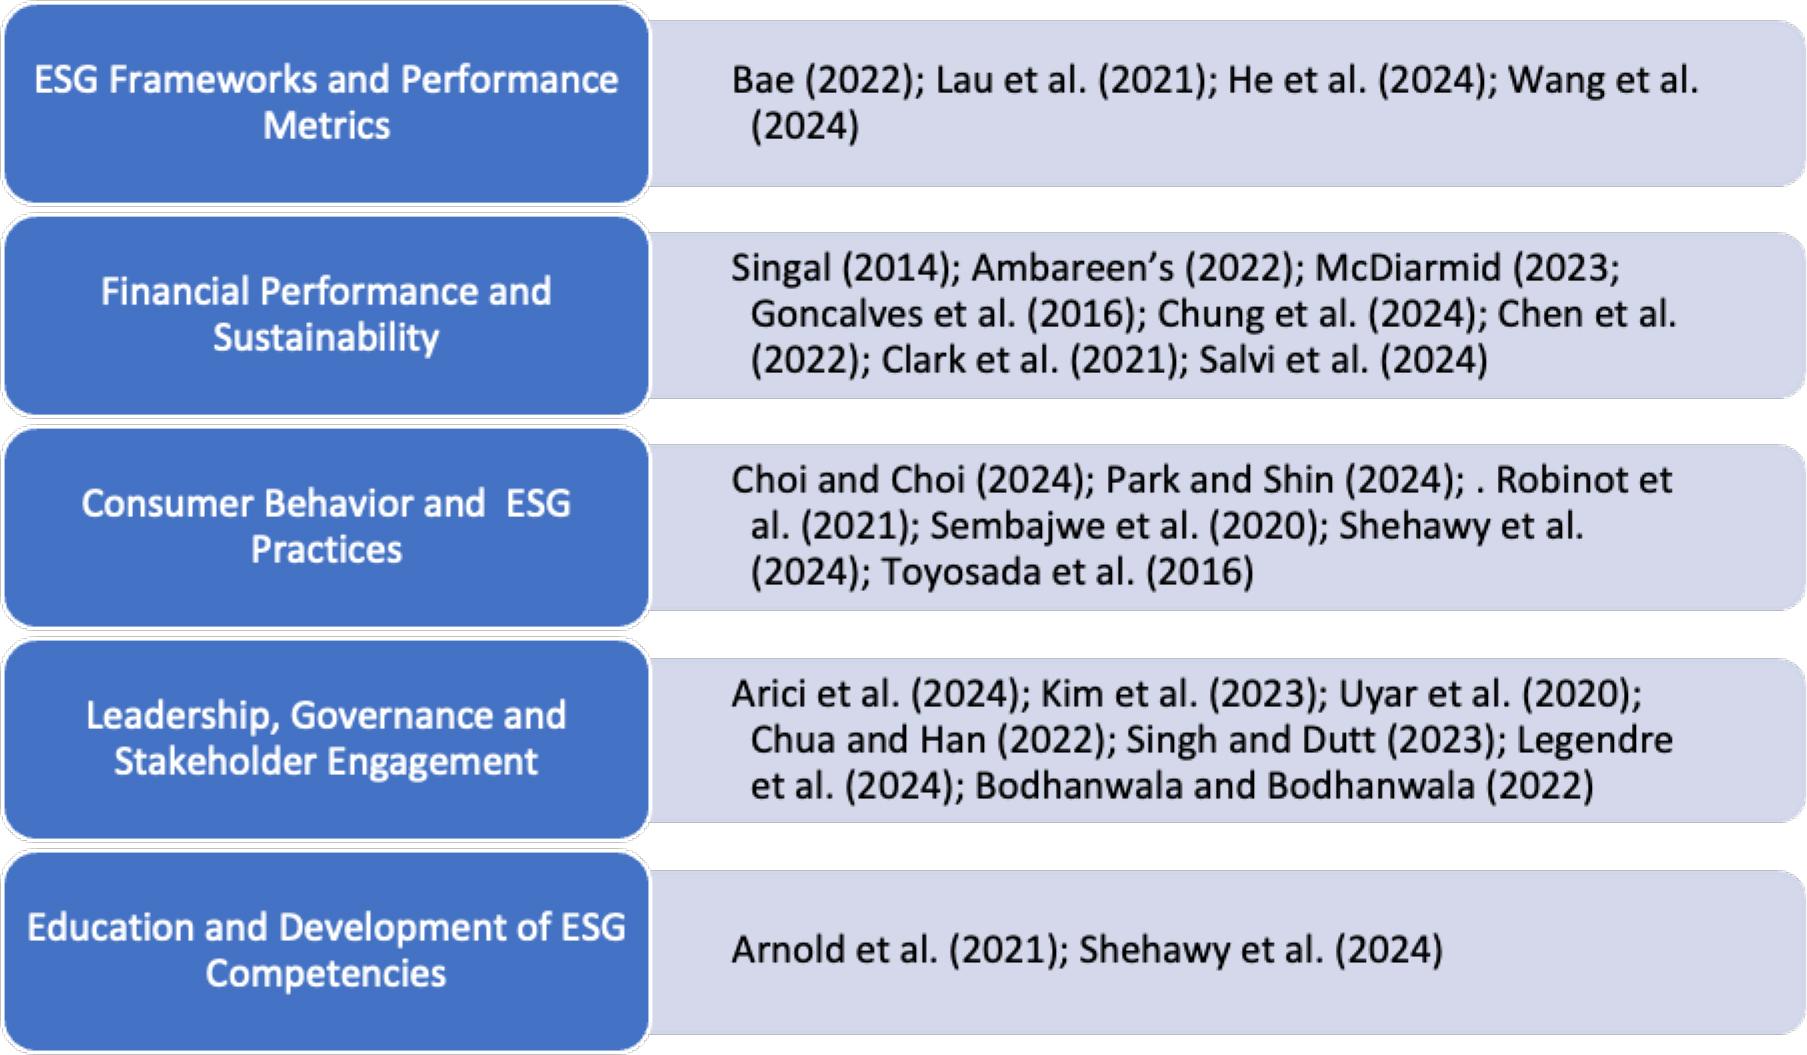
Thematic areas of ESG implementation in hospitality
Recognised thematic areas of ESG implementation in hospitality highlight the complex relationship between ESG dimensions, profitability, and firm size in the hospitality industry. The first theme emphasises the need for standardised, hotel-relevant ESG metrics to ensure comparable results. For example, Bae (2022) developed a hotel-specific ESG index comprising three domains and 41 items, which can serve as an industry benchmark. Lau et al. (2021) draw attention to the very practical problem of energy use in seaside hotels and note that systematic ESG reporting can detect otherwise hidden operational inefficiencies. He et al. (2024) report that stronger ESG performance is associated with a lower cost of debt for hotel firms, evidence that sustainability efforts can carry direct financing benefits. For implementation, Wang et al. (2024) present step-by-step guidance and tools intended to help hotels strengthen their environmental management in everyday operations.
Financial performance and sustainability are the second most significant aspects in this area. Compared with many other industries, firms in hospitality allocate more to environmental programmes and often realise gains in profitability and competitiveness (Singal, 2014). Transparent environmental disclosure is associated with stronger financial results (Ambareen, 2022). At the destination level, evidence from French ski resorts links well-executed environmental actions with stronger financial performance (Gonçalves et al., 2016). On financing, McDiarmid (2023) revisits Scottish tontines to show how alternative structures can channel capital into sustainability projects. Over time, transparent reporting and sustained commitment to sustainability are associated with better business performance (Ambareen, 2022; Singal, 2014). In capital markets, higher ESG scores correlate with lower return volatility (Chen et al., 2022). During COVID-19, hotels with stronger ESG scores kept operations steadier and rebounded in a shorter time (Chung et al., 2024). As mentioned, integrating ESG is argued to sharpen the financial hit from shocks (Clark et al., 2021).
ESG outcomes often depend not only on corporate intent but also on how consumers engage with those efforts. Choi and Choi (2024) show that emotion-led campaigns by travel firms build stronger customer loyalty than purely rational appeals. Park and Shin (2024) investigated how consumers’ knowledge influences their acceptance of ESG activities and concluded that informed consumers are more likely to support these initiatives. Robinot et al. (2021) find that meaningful customer involvement in environmental actions increases brand trust and loyalty. Moreover, Sembajwe et al. (2020) highlight that integrating ESG into cleanliness protocols improves public health and environmental outcomes. Shehawy et al. (2024) present a framework that integrates structural equation modelling (SEM) with ESG factors to examine consumer behaviour towards green technologies. The results emphasise that environmental concerns and governance practices significantly influence consumer decisions, suggesting that transparent environmental reporting, as discussed by Ambareen (2022), can increase consumer trust and support for sustainable practices. At the resource-use level, Toyosada et al. (2016) modelled hotel water consumption in Vietnam and provided insights into the management and reduction of water use. This study underscores water efficiency as a key part of sector sustainability.
Leadership, governance and stakeholder engagement matter for ESG outcomes. Effects of CEO duality on ESG ratings in hospitality have been documented (Arici et al., 2024), while transformational leadership has been shown to embed sustainability norms in routine employee behaviour (Kim et al., 2023). Uyar et al. (2020) link board characteristics to CSR outcomes and report that stronger governance enhances financial performance through improved ESG practices. In the green hotel literature, Chua and Han (2022) note that environmental sustainability has moved to the foreground and call for studies that explicitly incorporate stakeholder engagement. Case evidence from Dubai indicates that SDG-aligned operations foster more responsible business practices (Singh & Dutt, 2023). At the field level, Legendre et al. (2024) use a bibliometric lens to flag misconceptions and thin implementation guidance, concerns that are especially acute for smaller companies. Taken together, the empirical record suggests that substantive ESG programmes can translate into better performance outcomes (Bodhanwala & Bodhanwala, 2022).
Finally, education is central to capability building. Evidence from Arnold et al. (2021) indicates that virtual learning environments help hospitality students develop ESG-relevant competencies. Coupled with the conceptual framework proposed by Shehawy et al. (2024), such training can equip future managers to design workable sustainability strategies and improve both day-to-day operations and customer engagement with green initiatives.
Previous reviews of presented studies show an interesting evolution in hospitality sustainability. Early studies focus on introducing basic ESG metrics, whereas more recent studies focus on financial resilience and crisis management, particularly during the COVID-19 pandemic. Findings from previous studies also indicate the need for greater stakeholder involvement and education to develop recommendations that balance business performance and environmental impact. To be more specific, integrating ESG with finance, customer behaviour, leadership, and training, backed by transparency and stakeholder input, boosts trust, performance and resilience. The results consistently show that strong ESG engagement is associated with better financial performance and risk management, emphasising the need for future research to explore these dimensions further in order to develop comprehensive strategies for effective ESG implementation.
Meta-analytic overviews of ESG document wide dispersion in the estimated links between ESG and financial performance across sectors, indicators, and study designs. Although average effects are often non-negative, estimates shift with context and metric, reinforcing the case for sector-specific analyses (Friede et al., 2015; Khan, 2022; Bai & Kim, 2024). While average effects are often non-negative, outcomes vary by context and metric, underscoring the need for sector-specific research findings (Friede et al., 2015; Khan, 2022; Bai & Kim, 2024). Recent overviews of hospitality and tourism research characterise the evidence base as uneven, with indicators and measurement choices varying sufficiently to complicate comparisons across studies (Legendre et al., 2024; Chua & Han, 2022). Findings on profitability point in different directions: several studies report positive ESG–finance associations, whereas others report null or negative estimates; the sign often turns on the profitability proxy and the institutional setting (De Lucia et al., 2020; Velte, 2017; Xie et al., 2019; Duque-Grisales & Aguilera-Caracuel, 2021). In short, finance and sustainability don’t always move together. Against this backdrop, our study tried to find a nexus between financial indicators and firm size in a hospitality framework, thereby advancing cumulative understanding of when and why ESG aligns with financial strength.
For conceptual consistency with our outcome variable (Sustainalytics ESG risk), we restate the hypotheses as prediction statements about ESG Risk: H1: Firms with stronger financial performance exhibit lower ESG risk; H2: Firms with larger market capitalisation exhibit lower ESG risk. These two hypotheses represent the main objective of this study. To test these hypotheses, the first step of data collection was to obtain ESG ratings. Although there are numerous providers of ESG ratings, Sustainalytics‘ data was used for this research. Sustainalytics is considered one of the leading global providers of ESG data. The company is owned by Morningstar, which evaluates companies by assessing their exposure to material ESG issues (MEIs) and to what extent these risks can be mitigated through internal policies and practices. For each company, the unmanaged portion of the risk is aggregated across all MEIs and converted into a final ESG risk score. Sustainalytics classifies the ESG risk score into five categories: negligible (0–10), low (10–20), medium (20–30), high (30–40), and severe (>40) (Sustainalytics 2021, 2023).
A total of 63 ESG ratings of companies from the hospitality industry were retrieved from the Sustainalytics database. This sample comprises a diverse group of companies operating primarily in the hospitality, tourism, and entertainment sectors. Most of these companies operate in sectors such as hotels and resorts, casinos, travel and tourism, and theme parks. The sample includes well-known global brands such as Hyatt Hotels, Marriott International, Hilton Worldwide and Wynn Resorts, as well as regional players such as Fujita Kanko and Seera Holding Group. Some companies also specialise in niche areas such as cruise lines (e.g. Norwegian Cruise Line, Hurtig-ruten Group) and hospitality concessions (SSP Group Plc). Overall, this sample covers a wide range of companies offering hospitality, leisure and travel services worldwide.
The financial data for all companies comes from the Yahoo Finance website. The selected financial indicators provide a comprehensive snapshot of a company‘s financial health and performance. We use Sustainalytics’ ESG risk as the dependent variable, while financial performance is defined through 12 indicators. The price/sales (x1) and price/book (x2) ratios assess the market valuation in relation to sales and book value and help to recognise a possible over- or undervaluation. Enterprise Value/Revenue (x3) and Enterprise Value/EBITDA (x4) provide insight into the overall valuation by taking into account debt and earnings, which is useful for comparing companies with different capital structures. Profitability and efficiency are measured by profit margin (x5), operating margin (x6), return on assets (x7) and return on equity (x8) and indicate how effectively a company is generating profits from its operations, assets and equity. Finally, the ratios total debt/equity (x9), current assets (x10), book value per share (x11) and beta (x12), which measure stock volatility. In line with previous studies on the ESG performance nexus, we have selected 12 financial indicators that jointly capture four main dimensions of companies‘ financial condition: market valuation, profitability, capital structure and risk. All accounting-based financial indicators (x1-x12) are calculated from the latest full-year financial statements for the fiscal year 2023, while the market capitalisation data was retrieved on 6 October 2024. In the following table, descriptive statistics are provided.
Descriptive data in Table 1 show that ESG scores do not deviate across firms a lot (st. dev. =4.5), while market capitalisation and several valuation ratios vary widely, driven by some large companies. Profitability is generally modest, with some companies showing losses. Leverage levels differ greatly, indicating diverse capital structures.
Descriptive statistics
| ESG | Mcap | x1 | x2 | x3 | x4 | x5 | x6 | x7 | x8 | x9 | x10 | x11 | x12 | |
|---|---|---|---|---|---|---|---|---|---|---|---|---|---|---|
| Mean | 28.1 | 6209263153.7 | 2.4 | 20.7 | 2.8 | 13.3 | 0.1 | 0.2 | 0.0 | 0.2 | 3.6 | 1.3 | 130.6 | 1.3 |
| St. Error | 0.6 | 1524382351.7 | 0.4 | 16.9 | 0.2 | 1.4 | 0.0 | 0.0 | 0.0 | 0.1 | 0.7 | 0.2 | 56.2 | 0.1 |
| Median | 28.1 | 2339305764.0 | 1.5 | 2.2 | 2.4 | 10.5 | 0.1 | 0.2 | 0.0 | 0.1 | 1.6 | 0.9 | 10.3 | 1.2 |
| St. Dev. | 4.5 | 12099409816.8 | 2.9 | 123.0 | 1.8 | 10.2 | 0.2 | 0.2 | 0.0 | 0.4 | 4.7 | 1.5 | 413.3 | 0.7 |
| Min. | 17.0 | 78240000.0 | 0.1 | 0.4 | 0.2 | 0.5 | -0.2 | -0.7 | 0.0 | -0.8 | 0.0 | 0.2 | -13.5 | 0.2 |
| Max. | 38.1 | 71680000000.0 | 18.2 | 899.0 | 9.7 | 72.0 | 1.1 | 0.7 | 0.1 | 1.9 | 20.4 | 10.2 | 2522.2 | 3.0 |
| Count | 63.0 | 63.0 | 57.0 | 53.0 | 57.0 | 56.0 | 56.0 | 56.0 | 54.0 | 48.0 | 50.0 | 54.0 | 54.0 | 56.0 |
A correlation analysis was conducted to determine the relationship between company size and ESG ratings. According to Balthagi (2011, p. 34), “the signs of this correlation matrix indicate the direction of the linear relationship between the corresponding two variables, while the magnitude indicates the strength of this correlation.” The correlation coefficient is the covariance divided by the product of the standard deviations of the two random variables. Correlation is useful for estimating results because it helps to identify relationships between variables by showing whether they move together. It indicates the direction (positive or negative) and strength of these relationships, making it easier to predict one variable based on another. Correlation simplifies data analysis by highlighting important relationships and serves as a good starting point before using more advanced predictive models.
The second method used to estimate which financial variables influence ESG ratings was a stepwise bidirectional multiple regression using the bootstrap method (1,000 replications). In this method, a regression model is constructed by adding or removing independent variables according to a specified statistical criterion. In particular, bidirectional stepwise regression combines forward selection and backward elimination based on p-values: variables with p-values < 5% are retained, whereas those with p-values> 10% are removed. This method is often used when there is a larger number of independent variables, as is the case in this study, with 12 independent variables. However, it is important to note the limitations of this method, such as overfitting, where the model may select variables that fit the current data set well but may not generalise effectively to new data. The general form of the equation is
Where Y is the dependent variable (the predicted outcome). β0 is the intercept (the value of Y when all predictors are 0). βnxn are the coefficients for each independent variable that indicate how much Y changes for a one-unit change in each x, ε is the error term that accounts for variability that is not explained by the model.
The calculated Pearson correlation coefficient between ESG ratings and market capitalisation for the entire sample is -0.7170. Higher ESG risk is expected to correlate with lower market capitalisation and vice versa. The obtained p-value of 0.0000 confirms that this correlation is statistically significant.
Based on Table 2, the significant correlations show important links between financial performance, valuation and stock volatility, also emphasising ESG dynamics. Larger companies tend to have lower ESG risk scores, which indicates lower ESG risk and is generally viewed favourably in terms of sustainability performance. Strong positive correlations between profit margin, price-to-sales ratio, and current ratio indicate that more profitable, better-liquidity companies are highly valued and less volatile. In addition, companies with a higher return on equity also tend to have a higher price-to-book ratio, reflecting a higher market valuation. Companies with higher leverage (total equity debt) and lower liquidity (lower current ratios) tend to display greater share price volatility, which is reflected by higher betas. At the same time, companies that operate more efficiently (higher operating margins) and earn larger returns on capital are typically rewarded with higher market valuations. Taken together, these patterns suggest that profitability, liquidity, and leverage jointly shape valuation and volatility in the hospitality industry, whereas larger companies in the sample generally exhibit lower ESG risk scores. In the next step we have estimated a bidirectional stepwise multiple regression model by using the 12 independent variables described in the previous section. The final specification retained three financial indicators as statistically relevant: return on assets, return on equity and enterprise value/revenues.
Correlation matrix
| Variables | ESG | Mcap | x1 | x2 | x3 | x4 | x5 | x6 | x7 | x8 | x9 | x10 | x11 | x12 |
|---|---|---|---|---|---|---|---|---|---|---|---|---|---|---|
| ESG | 1.000 | |||||||||||||
| Mcap | -0.717 | 1.000 | ||||||||||||
| x1 | -0.084 | 0.132 | 1.000 | |||||||||||
| x2 | -0.109 | 0.055 | 0.093 | 1.000 | ||||||||||
| x3 | -0.304 | 0.263 | 0.521 | 0.198 | 1.000 | |||||||||
| x4 | -0.024 | 0.155 | -0.028 | 0.061 | 0.241 | 1.000 | ||||||||
| x5 | -0.204 | 0.293 | 0.854 | 0.179 | 0.267 | -0.259 | 1.000 | |||||||
| x6 | -0.361 | 0.486 | 0.194 | 0.390 | 0.511 | 0.062 | 0.281 | 1.000 | ||||||
| x7 | -0.315 | 0.315 | 0.124 | 0.362 | 0.508 | -0.117 | 0.282 | 0.484 | 1.000 | |||||
| x8 | -0.313 | 0.132 | 0.096 | 0.818 | 0.163 | -0.400 | 0.233 | 0.225 | 0.578 | 1.000 | ||||
| x9 | -0.034 | 0.019 | -0.240 | 0.573 | -0.035 | 0.234 | -0.305 | 0.009 | -0.017 | 0.351 | 1.000 | |||
| x10 | 0.188 | -0.148 | 0.679 | -0.041 | -0.198 | -0.143 | 0.622 | -0.134 | -0.237 | -0.122 | -0.242 | 1.000 | ||
| x11 | 0.199 | -0.140 | -0.063 | -0.052 | -0.170 | -0.008 | 0.002 | -0.079 | -0.029 | 0.035 | -0.136 | -0.002 | 1.000 | |
| x12 | -0.012 | 0.058 | -0.464 | -0.006 | -0.230 | 0.047 | -0.462 | -0.042 | -0.080 | 0.057 | 0.617 | -0.391 | -0.313 | 1.000 |
The model explains approximately 28.6% of the variance in ESG (R-squared = 0.286), with an adjusted R-squared of 23.73%, indicating a moderate fit. The overall model is statistically significant (F(3, 44) = 5.88, p = 0.0018). Regarding the interpretation of the variables, the ESG risk score is expected to decrease by 1.35 units for every one unit increase in EV/revenues (x3), holding the other factors constant. This suggests that companies with higher revenue-to-value ratios tend to have lower ESG risk, indicating greater sustainability. Such companies can also allocate more resources to effectively manage ESG risks or invest in acceptable ESG projects. Return on assets (x7) is positively related to ESG risk, but only marginally significant (p = 0.058). A one percentage point increase in return on assets is associated with a 0.43 unit increase in ESG risk, but due to a marginally high p-value, this is more suggestive than conclusive. It indicates that companies with higher efficiency in generating profits from their assets may be exposed to greater ESG risk. A higher return on assets (ROA) indicates that a company is efficient in generating profits from its assets. However, a higher ROA associated with higher ESG risk can mean that hospitality companies are extracting maximum value from their existing assets and postponing investments in ESG projects. Return on equity (x8) shows a significant negative relationship with ESG risk. An increase in return on equity by one unit is associated with a decrease in ESG risk by 4.49 units. This suggests that companies with a higher return on equity tend to manage their ESG risks better. A high ROE could indicate a well-managed company that balances profitability with responsible corporate governance and is therefore better positioned. Although financial indicators EV/Revenue, ROE and ROA have different signs, this does not necessarily imply a contradiction. Since the tourism and hospitality industry is more asset-intensive, higher EV/Revenue and ROE are more consistent with financially stronger companies that cope well with ESG risk. On the other hand, a marginally significant positive coefficient on ROA may also reflect the timing effect of debt financing of ESG investments. For example, when a hotel takes a loan to install solar panels, upgrade building insulation or implement water-efficiency systems, the asset base increases while profitability declines due to interest rates and depreciation. In this case, ROA is falling together with ESG risk. Over time, due to lower operating costs, ROA can be expected to recover.
The next step was to test the basic assumptions of the model, starting with a test for multicollinearity.
The results presented in Table 3 show that all values of the variance inflation factor (VIF) are well below the generally accepted threshold of 5 (or 10), indicating that multicollinearity is not a problem in this model. In the next step, a test for heteroscedasticity was performed. The Breusch–Pagan/Cook–Weisberg test for heteroscedasticity yielded a χ2(1) = 0.15 with a p-value of 0.7033. Since the p-value is greater than 0.05, the null hypothesis of constant variance cannot be rejected. This means that there is no indication of heteroscedasticity, and the assumption of homoscedasticity is fulfilled. Checking the normality of the residuals is a crucial next step in checking the regression assumptions, as it ensures that the estimated coefficients remain unbiased and that the p-values and confidence intervals are valid for reliable inference. The Shapiro-Wilk W-test for normality of the residuals yielded W = 0.98242 with a p-value of 0.68172, indicating that there is no significant deviation from normality. To support this, the Jarque-Bera test also showed a χ2 = 0.0517 with a p-value of 0.9745, which confirms that the residuals do not deviate significantly from normality. Both tests confirm that the residuals are approximately normally distributed.
Results of the estimated model
| Source | SS | df | MS | Number of obs | = | 48 |
|---|---|---|---|---|---|---|
| F(3, 44) | = | 5.88 | ||||
| Model | 219.472967 | 3 | 73.1576558 | Prob > F | = | 0.0018 |
| Residual | 547.866824 | 44 | 12.4515187 | R-squared | = | 0.2860 |
| Adj R-squared | = | 0.2373 | ||||
| Total | 767.339792 | 47 | 16.3263785 | Root MSE | = | 3.5287 |
| ESG | Coefficient | Std. err. | t | P>|t| | [95% conf. interval] | |
| x3 | -1.464417 | 0.4480518 | -3.27 | 0.002 | -2.367407 | -0.5614283 |
| x7 | 44.90196 | 23.09605 | 1.94 | 0.058 | -1.645074 | 91.449 |
| x8 | -4.44254 | 1.631259 | -2.72 | 0.009 | -7.730126 | -1.154953 |
| _cons | 30.98511 | 1.194589 | 25.94 | 0.000 | 28.57758 | 33.39265 |
The bootstrapping method was used to ensure the robustness of the model estimates, especially since normal regression can provide unreliable standard errors and confidence intervals for small samples. The results presented in Table 4 show that all values of the variance inflation factor (VIF) are well below the generally accepted threshold of 5 (or 10), indicating that multicollinearity is not a problem in this model. In the next step, a test for heteroscedasticity was performed. The Breusch–Pagan/Cook–Weisberg test for heteroscedasticity yielded a χ2(1) = 0.15 with a p-value of 0.7033. Since the p-value is greater than 0.05, the null hypothesis of constant variance cannot be rejected. This means that there is no indication of hete-roscedasticity, and the assumption of homoscedasticity is fulfilled. Checking the normality of the residuals is a crucial next step in checking the regression assumptions, as it ensures that the estimated coefficients remain unbiased and that the p-values and confidence intervals. The bootstrapping method used here, the original data were resampled 1,000 times to estimate robust standard errors and confidence intervals for the regression coefficients. By using resampling, the bootstrap method provides more reliable estimates, makes the results less prone to outliers and improves the accuracy of the conclusions for variables such as enterprise value/sales, return on assets and return on equity. The results are shown in Table 5.
Variance inflation factor
| Variable | VIF | 1/VIF |
|---|---|---|
| X7 | 1.67 | 0.597577 |
| X8 | 1.51 | 0.664001 |
| X3 | 1.14 | 0.873558 |
Results of the estimated model after the bootstrap method
| Source | SS | df | MS | Number of obs | = | 48 |
|---|---|---|---|---|---|---|
| Replications | = | 1000 | ||||
| Model | 219.472967 | 3 | 73.1576558 | Wald chi2(3) | = | 17.18 |
| Residual | 547.866824 | 44 | 12.4515187 | Prob > chi2 | = | 0.0006 |
| R-squared | = | 0.2860 | ||||
| Total | 767.339792 | 47 | 16.3263785 | Adj R-squared | = | 0.2373 |
| Root MSE | = | 3.5287 | ||||
| ESG | Coefficient | Bootstrap std. err. | t | P>|t| | [95% conf. interval] | |
| x3 | -1.464417 | 0.3656436 | -4.01 | 0.000 | -2.181066 | -0.7477691 |
| x7 | 44.90196 | 22.88734 | 1.96 | 0.050 | 0.0436008 | 89.76032 |
| x8 | -4.44254 | 2.527524 | -1.76 | 0.079 | -9.396396 | 0.5113168 |
| _cons | 30.98511 | 0.9925105 | 31.22 | 0.000 | 29.03983 | 32.9304 |
The main differences between the results of the normal regression and the bootstrap regression can be seen in the standard errors, the t-values and the p-values. In the bootstrap model, the standard error of x3 decreases, whereas that of x8 increases relative to the results in Table 3. This leads to an increased significance for x3 and a slightly decreased significance for x8, although x8 remains statistically significant at the 10% level. In addition, the significance of x7 improves slightly. Both x3 and x7 retain their statistical significance at the 5% level. These differences illustrate the improved robustness of the coefficient estimates obtained via the bootstrap procedure, particularly when accounting for potential issues associated with small sample sizes.
To begin the discussion, it is important to recognise the growing focus on sustainability in the hospitality industry and the complex relationship between ESG initiatives and financial performance. As more companies embed ESG, it becomes necessary to see how those efforts correspond to profitability and firm size. Here, results are expressed in Sustainalytics ESG Risk terms, so negative coefficients on financial variables indicate improvement in ESG. The results of this study provide useful insights and show that some profitability indicators, such as return on equity (ROE), have a positive relationship with ESG risk, while others, such as return on assets (ROA), have a more complex or negative relationship. The results show that higher market capitalisation and stronger valuation metrics (EV/revenue) are consistently associated with lower ESG risk, while ROE and ROA have opposing effects. Different dimensions of profitability in the hospitality industry rely on distinct mechanisms of financial strength, asset intensity and investment cycles, causing their links to ESG risk to move in different directions. These findings add to the ongoing discussion on the financial implications of ESG integration in the hospitality industry and highlight how financial strength can both support and challenge sustainability efforts.
Results show ROA is negatively related to ESG. The previous results in the literature are also inconsistent. In contrast to our results, studies by De Lucia et al. (2020), Xie et al. (2019), Velte (2017) and Bhaskaran et al. (2020) report a positive relationship between ROA and ESG. The positive relationship is often attributed to the synergy between responsible business practices and tangible financial benefits resulting from better risk management, better resource utilisation and stronger stakeholder relationships. Over time, such practices lead to more efficient utilisation of assets, stable profitability and a higher return on investment. On the other hand, results consistent with our findings, such as those of Folger-Laronde et al. (2022) and Duque-Grisales and Aguilera-Caracuel (2021), indicate a negative relationship between ROA and ESG. Garcia and Orsato (2020) concluded that the institutional environment strongly influences the relationship between ESG and ROA. In emerging markets, ESG is often perceived as a costly activity with limited benefits. For hospitality specifically, a negative ROA–ESG link is conceivable because ESG upgrades tend to be capitalintensive, inflate the asset base, and pay back over multiyear horizons, temporarily depressing asset returns even as ESG risk declines. Cyclical occupancy and seasonality can further weaken near-term asset productivity, suggesting that ROA may understate the long-run benefits of ESG investments in this sector. This mechanism-level interpretation aligns with our associational design and does not imply causality.
The EV/revenue indicator was not comprehensively analysed in relation to ESG in previous studies, which makes it difficult to compare the results. EV/Revenue is defined as Enterprise value (market capitalisation plus debt minus cash and cash equivalents) divided by annual revenue. However, a positive correlation may be explained by the perception that companies with higher EV/Revenue are financially strong and strategically well-positioned to invest in sustainable and socially responsible practices aligned with long-term growth and stakeholder expectations. Conceptually, EV/Revenue captures a valuation channel. Higher multiples reflect investor expectations of durable cash flows and brand value, which often co-move with stronger disclosure, stakeholder management and the capacity to fund ESG programmes consistent with lower ESG Risk at higher EV/Revenue. Our robustness checks replacing EV/Revenue with EV/EBITDA yield similar inferences, supporting the interpretation that valuation and ESG are linked beyond pure accounting profitability.
Consistent with our findings on the positive influence of ROE on ESG score, Alareeni and Hamdan (2020) concluded that strong corporate governance is the main reason for the positive relationship between ESG and ROE score, while the other two ESG factors may have a negative influence. In addition, studies by Shobhwani and Lodha (2023), Riani et al. (2024) and Mendirata et al. (2021) have also found a positive relationship between ROE and ESG ratings. Our results fit a financing-capacity description. Firms with higher returns to equity can more readily allocate capital to decarbonisation, workforce initiatives, and governance systems, thereby reducing unmanaged ESG risk. Importantly, we control for leverage to reduce the risk that mechanically higher ROE (from higher debt) masquerades as a sustainability effect.
To summarise, although the profitability indicators have opposite effects on ESG ratings, as return on equity (ROE) in the hospitality industry has a negative impact on ESG risk, while return on assets (ROA) has a positive impact on ESG risk. Taken together, these findings partially support H1, with the qualification that the profitability measure is used. ROE aligns with lower ESG Risk, whereas ROA aligns with higher ESG Risk.
The positive impact of ROE could be because more profitable hotels are able to use their equity to fund sustainable practices such as energy efficiency, socially responsible projects and governance improvements. On the other hand, the negative impact of return on equity indicates that ESG initiatives often require significant asset investments, thereby reducing short-term returns. This suggests that the financial flexibility afforded by a high return on equity supports ESG objectives, whereas the high costs associated with ESG investments can strain asset management efficiency, thereby reducing return on equity.
The problem addressed by this study is the need to understand how financial performance and company size are associated with ESG risk scores in the hospitality industry, where sustainability challenges such as high energy consumption, labour dependency and water use are particularly pronounced. By examining whether larger and more financially robust companies are better able to achieve strong ESG ratings, this study sheds light on the extent to which financial strength is associated with sustainability performance in this sector. The study aims to test two hypotheses: H1: Hospitality companies with stronger financial performance exhibit lower ESG risk, and H2: Larger hospitality companies (higher market capitalisation) exhibit lower ESG risk than smaller companies. The results confirmed H2, as evidenced by a strong negative correlation between ESG risk ratings and market capitalisation (Pearson coefficient = -0.7170, p = 0.0000). Larger organisations may, in some contexts, demonstrate a greater tendency to have lower ESG risk scores reflecting better ESG performance. In relation to H1, the regression analysis showed that enterprise value/revenue (x3), a variable relevant to financial performance, had a significant negative effect on ESG risk scores (coefficient = -1.464417, p = 0.002). We may conclude that companies with higher valuations relative to their revenue are perceived as more sustainable, supporting H1. In addition, return on equity (ROE, x8) showed a significant negative relationship with ESG risk (coefficient = -4.44254, p = 0.009), supporting the hypothesis that better financial performance is associated with higher ESG ratings. ROA (x7) is positively related to ESG risk (β = 44.90, p = 0.058). The effect is marginal and should be read with caution, not least because ROA and ROE are closely related constructs. It partly contradicts H1 and suggests a more complex relationship between certain profitability ratios and ESG ratings.
Overall, the study confirms H2 and provides partial support for H1. It emphasises that while better financial performance and larger company size generally correlate with higher ESG ratings, some aspects of financial efficiency are not necessarily associated with lower ESG risk. Hospitality companies should consider these findings when integrating sustainability into their strategies to improve both profitability and ESG performance. Despite these mixed results, this research offers several advantages. It focuses on a highly asset-intensive sector, provides sector-specific evidence on the link between financial indicators, firm size and ESG risk (rather than ESG scores, which are mostly used). Moreover, since the results suggest that EV/Revenue and ROE are more strongly associated with lower ESG risk, whereas ROA is the opposite, this study highlights that financial performance is multidimensional and that not all forms of efficiency necessarily align with lower ESG risk. The main limitation of this study is the relatively small sample size, consisting mainly of larger firms, which limits the statistical power of the OLS estimates and warrants cautious interpretation of the findings, as the observed associations may be sensitive to the dataset structure and the cross-sectional nature of the analysis.