
Figure 1
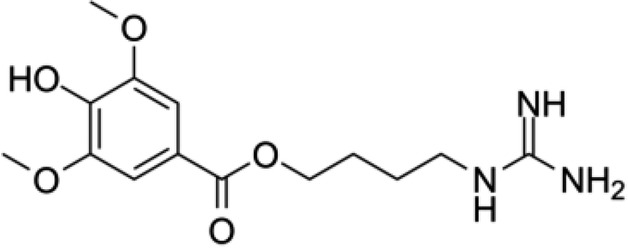
SCM-198 chemical structure.
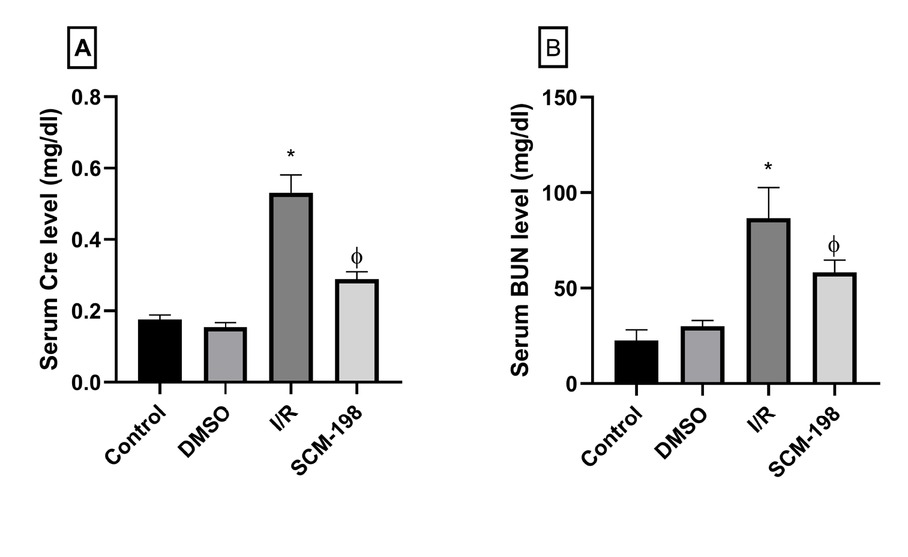
Figure 2
Effects of SCM-198 on kidney functions. (A) Urea and (B) Cre levels. *P<0.05 compared to the control and DMSO groups, ϕP<0.05 compared to the I/R group.
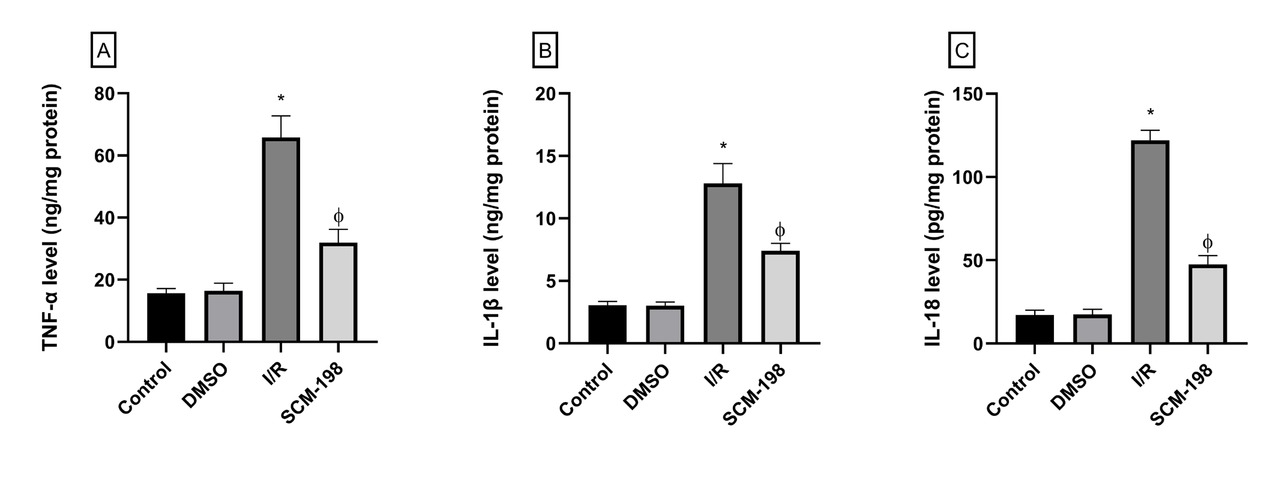
Figure 3
Effects of SCM- 198 on inflammatory cytokines. (A) TNF-α, (B) IL-1β and (C) IL- 18 levels. *P<0.05 compared to control and DMSO groups, ϕP<0.05 compared to I/R group.
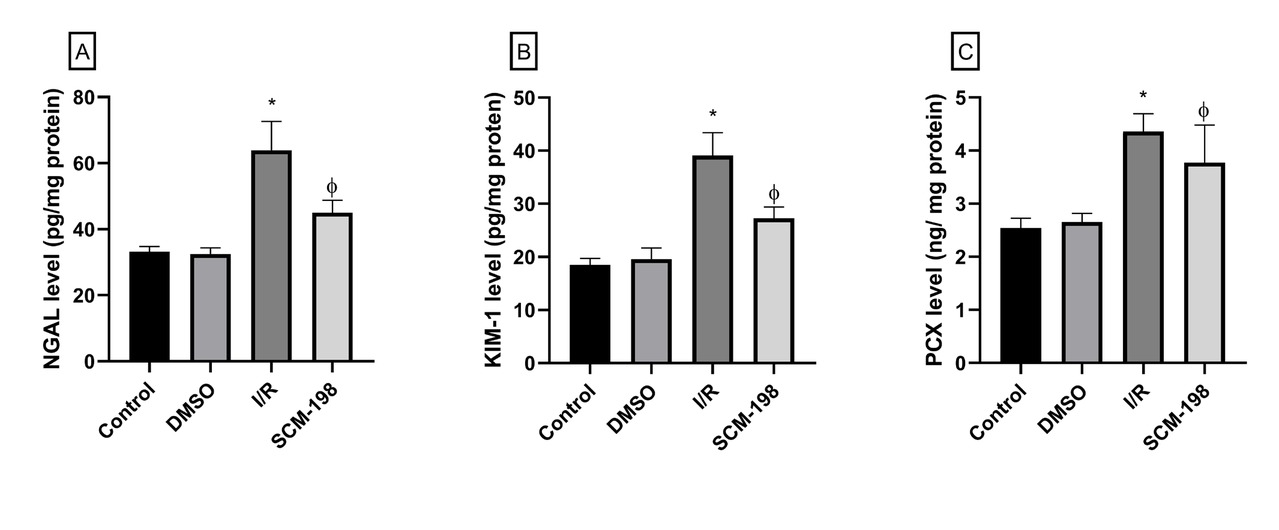
Figure 4
Changes in kidney damage biomarkers in the kidney I/ R model (A) NGAL, (B) KIM-1, and (C) PCX levels. *P<0.05 compared to control and DMSO groups, ϕP<0.05 compared to I/R group.
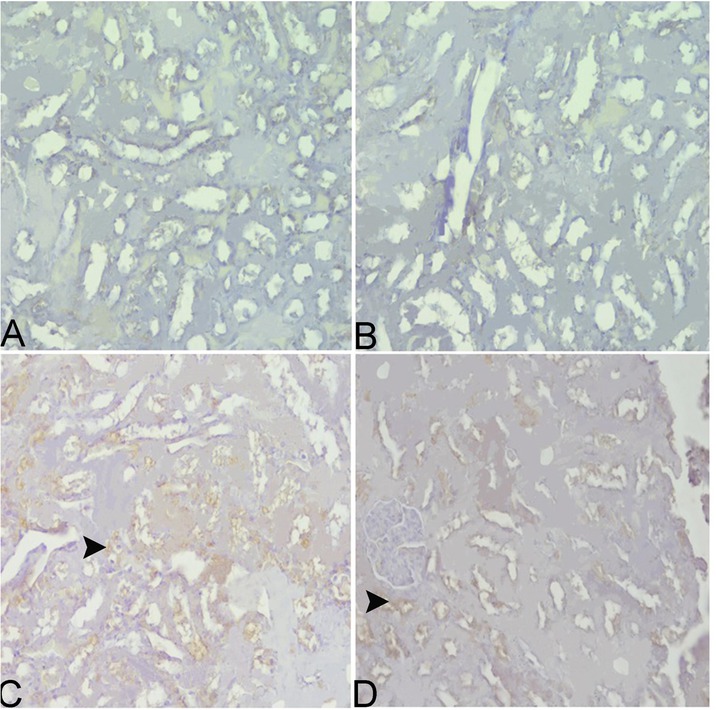
Figure 5
(A) Control group, LC3B immunonegativity (B) DMSO group, LC3B immunonegativity (C) I/R group, moderate LC3B immunopositivity was observed in renal tubule epithelial cells (arrowhead), (D) SCM-198 group, mild LC3B immunopositivity was detected in renal tubular epithelial cells (arrowhead).
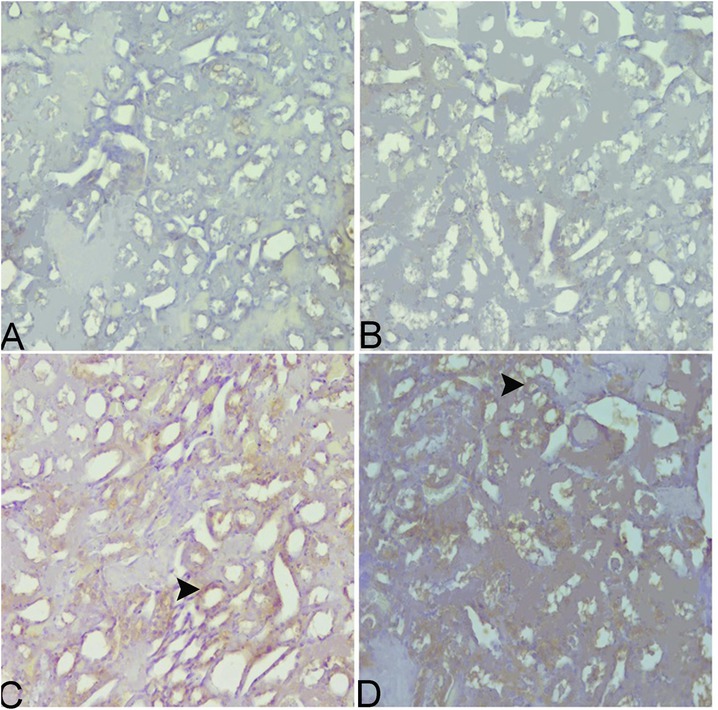
Figure 6
(A) Control group, Beclin-1 immunonegativity, (B) DMSO group, Beclin-1 immunonegativity, (C) I/R group, moderate Beclin-1 immunopositivity in renal tubule epithelial cells (arrowhead), (D) SCM -198 group, mild Beclin-1 immunopositivity in renal tubule epithelial cells (arrowhead).
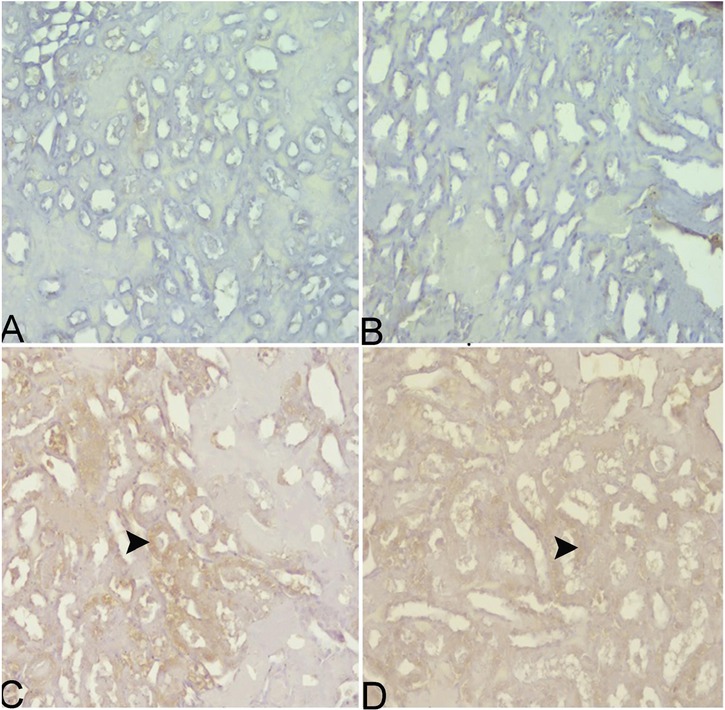
Figure 7
(A) Control group, TLR4 immunonegativity, (B) DMSO group, TLR4 immunonegativity, (C) I/R group, moderate TLR4 immunopositivity in renal tubule epithelial cells (arrowhead), (D) SCM-198 group, mild TLR4 immunopositivity in renal tubule epithelial cells (arrowhead).
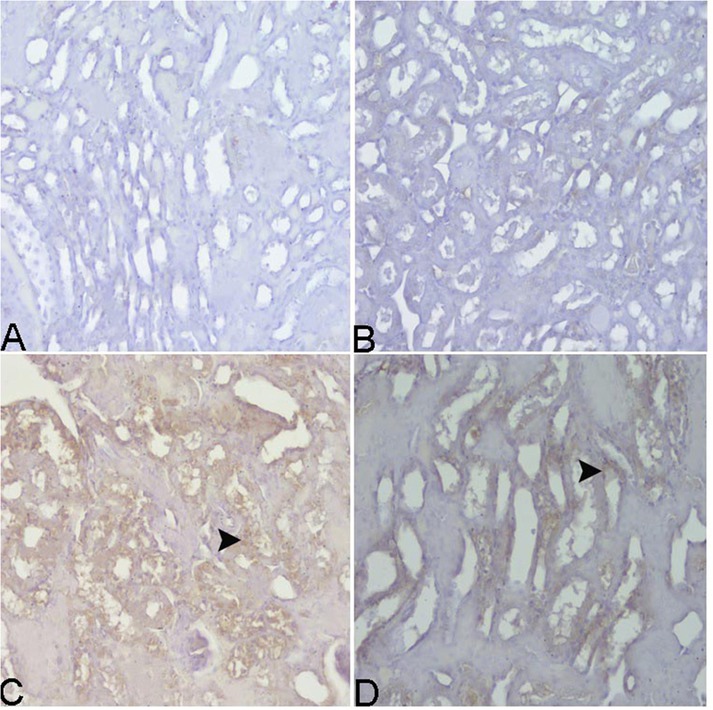
Figure 8
(A) Control group, Bax immunonegativity, (B) DMSO group, Bax immunonegativity, (C) I/R group, moderate Bax immunopositivity in renal tubule epithelial cells (arrowhead), (D) SCM-198 group, mild Bax immunopositivity in renal tubule epithelial cells (arrowhead).
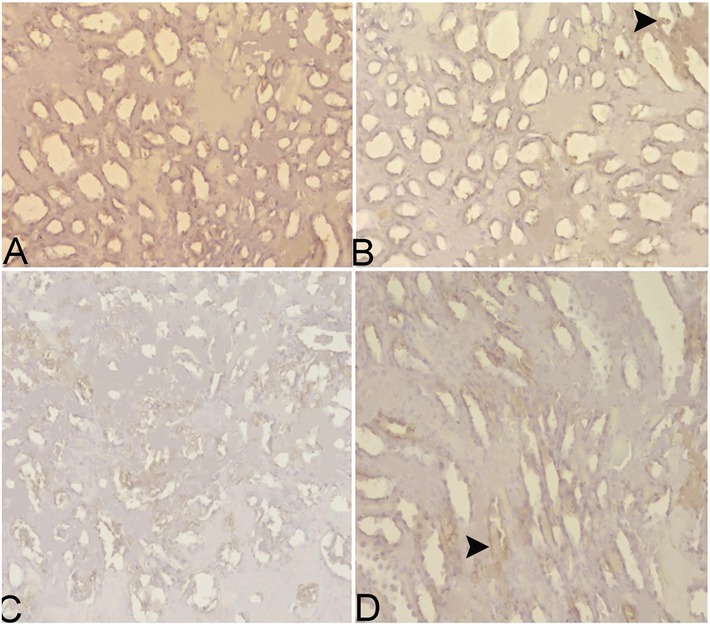
Figure 9
(A) Control group, severe Bcl-2 immunopositivity in renal tubule epithelial cells (arrowhead), (B) DMSO group, severe Bcl-2 immunopositivity in renal tubule epithelial cells (arrowhead), (C) I/R group, mild Bcl-2 immunopositivity in renal tubule epithelial cells, (D) SCM-198 group, moderate Bcl-2 immunopositivity in renal tubule epithelial cells (arrowhead).
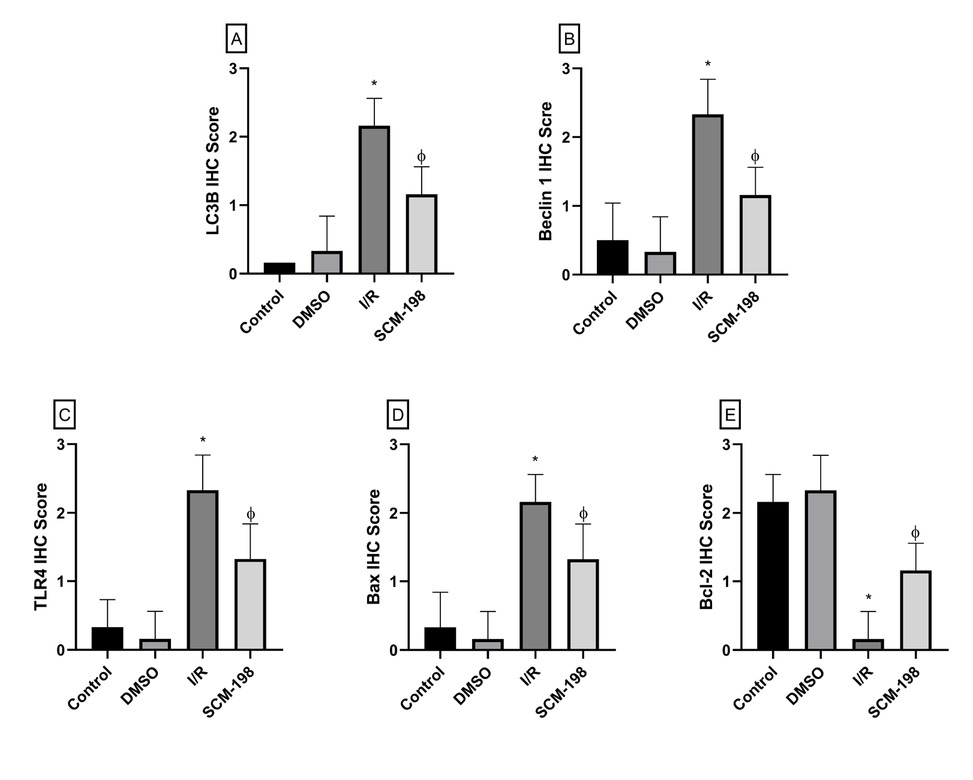
Figure 10
IHC scoring in renal tubule cells (A) LC3B, (B) Beclin-1, (C) TLR4, (D) Bax and (E) Bcl-2. *P<0.05 compared to control and DMSO groups, ϕP<0.05 compared to I/R group.