
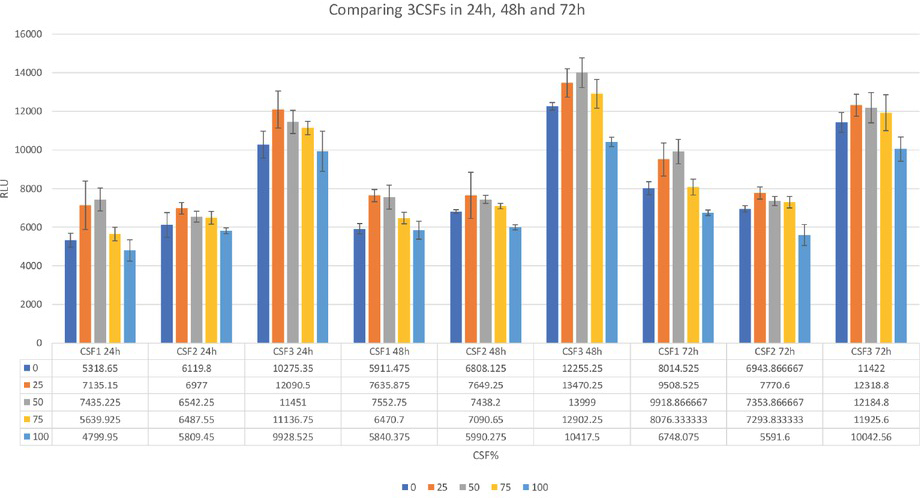
Figure 1
CTG Assay results using PCS-201-012 cells at 24h,48h and 72h with 0%, 25%, 50%, 75% and 100% CSF. Three different CSFs were used in the experiments. All experiments were performed in quadruplicate. CSF 3 caused the highest amount of growth out of all the CSFs across all hours and all CSF percentages. There is inhibition of growth with the 75% and 100% but it is more prominent with 100% CSF. This can be seen in all of the time series. Two Way RM ANOVA with Holm-Sidak multiple comparison test was used for statistical analysis.
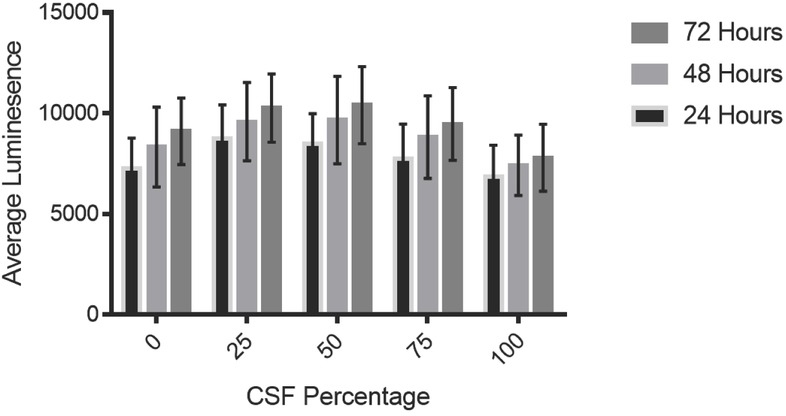
Figure 2
All the CSF results were combined and presented as one CSF. Variation in cell number can be seen as a variation in luminescence (RLU). The cell number goes up from 24h to 72h but in 100% CSF proliferation is inhibited. Two Way RM ANOVA with Holm-Sidak multiple comparison test was used for statistical analysis.
Table 1
Relative Luminescence Unit (RLU) values are shown for different CSF concentrations and different hours. Same letters in the columns indicate no statistically significant difference (p>0.05). Same symbols in the rows indicate no statistically significant difference (p>0.05). The variability due to the CSF percentages was statistically significant. Two Way RM ANOVA with Holm-Sidak multiple comparison test was performed for this analysis.
| TIME | ||||
|---|---|---|---|---|
| 24 Hours | 48 Hours | 72 Hours | ||
| Mean ± SEM | Mean ± SEM | Mean ± SEM | ||
| CSF Concentration (%) | 0 | 7237.93 ± 1536.22 a,d,# | 8324.95 ± 1982.12 a,& | 9103.60 ± 1653.54 a,* |
| 25 | 8734.22 ± 1678.76 b,c,# | 9585.13 ± 1942.57 b,c,& | 10262.11 ± 1698.34 b,c,* | |
| 50 | 8476.16 ± 1509.59 c,# | 9663.32 ± 2168.09 c,& | 10404.24 ± 1916.68 c,* | |
| 75 | 7754.74 ± 1708.62 a,# | 8821.20 ± 2048.36 a,& | 9473.12 ± 1802.25 a,* | |
| 100 | 6845.98 ± 1568.58 d,# | 7416.05 ± 1501.35 d,#,& | 7796.31 ± 1660.38 d,& | |
Table 2
For each given hour different CSF percentages were compared to each other. Mean difference of each comparison and its statistical significance is indicated. The degree of significance is indicated with the number of *, higher the number of * stronger the significance.
| Holm-Sidak’s multiple comparison test | Mean Diff. | Significant? | Summary |
|---|---|---|---|
| 24 Hours | |||
| 0 vs. 25 | -1496 | Yes | *** |
| 0 vs. 50 | -1238 | Yes | *** |
| 0 vs. 75 | -516.8 | No | ns |
| 0 vs. 100 | 392 | No | ns |
| 25 vs. 50 | 258.1 | No | ns |
| 25 vs. 75 | 979.5 | Yes | ** |
| 25 vs. 100 | 1888 | Yes | **** |
| 50 vs. 75 | 721.4 | Yes | * |
| 50 vs. 100 | 1630 | Yes | **** |
| 75 vs. 100 | 908.8 | Yes | ** |
| 48 Hours | |||
| 0 vs. 25 | -1260 | Yes | *** |
| 0 vs. 50 | -1338 | Yes | *** |
| 0 vs. 75 | -496.3 | No | ns |
| 0 vs. 100 | 908.9 | Yes | ** |
| 25 vs. 50 | -78.19 | No | ns |
| 25 vs. 75 | 763.9 | Yes | * |
| 25 vs. 100 | 2169 | Yes | **** |
| 50 vs. 75 | 842.1 | Yes | * |
| 50 vs. 100 | 2247 | Yes | **** |
| 75 vs. 100 | 1405 | Yes | *** |
| 72 Hours | |||
| 0 vs. 25 | -1159 | Yes | ** |
| 0 vs. 50 | -1301 | Yes | *** |
| 0 vs. 75 | -369.5 | No | ns |
| 0 vs. 100 | 1307 | Yes | *** |
| 25 vs. 50 | -142.1 | No | ns |
| 25 vs. 75 | 789 | Yes | * |
| 25 vs. 100 | 2466 | Yes | **** |
| 50 vs. 75 | 931.1 | Yes | ** |
| 50 vs. 100 | 2608 | Yes | **** |
| 75 vs. 100 | 1677 | Yes | **** |
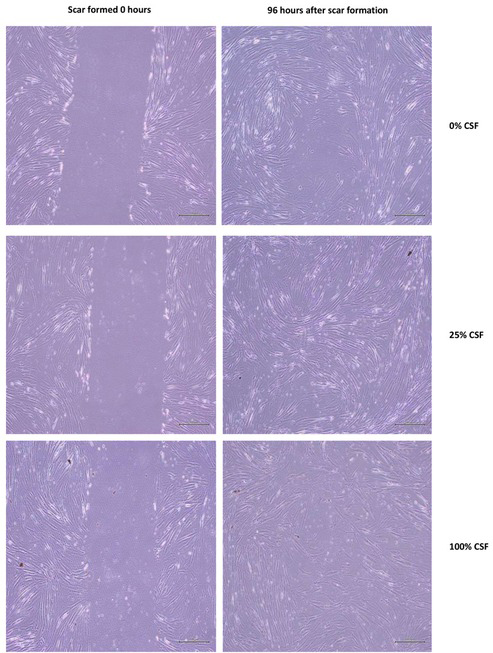
Figure 3
Wound healing assay where an 80% confluent well was scratched with a pipet tip to create the “scar”. Cells are then allowed to close the scar under different CSF percentages. 0 hours and 96 hours after scar formation is shown above for 0%, 25% and 100% CSF. 25% CSF almost completely closes the wound. 0% CSF mostly closes the wound but patches of unclosed sections are still apparent. 100% CSF fails to close the wound. Some cells can be seen reaching into the wound.
Table 3
Comparisons of different time points within different CSF percentages. Mean difference of each comparison and its statistical significance is indicated. The degree of significance is indicated with the number of *, higher the number of * stronger the significance.
| Holm-Sidak’s multiple comparisons test | Mean Diff. | Significant? | Summary |
|---|---|---|---|
| 0% CSF | |||
| 24 Hours vs. 48 Hours | -1087 | Yes | *** |
| 24 Hours vs. 72 Hours | -1866 | Yes | **** |
| 48 Hours vs. 72 Hours | -778.6 | Yes | ** |
| 25% CSF | |||
| 24 Hours vs. 48 Hours | -850.9 | Yes | ** |
| 24 Hours vs. 72 Hours | -1528 | Yes | **** |
| 48 Hours vs. 72 Hours | -677 | Yes | * |
| 50% CSF | |||
| 24 Hours vs. 48 Hours | -1187 | Yes | *** |
| 24 Hours vs. 72 Hours | -1928 | Yes | **** |
| 48 Hours vs. 72 Hours | -740.9 | Yes | ** |
| 75% CSF | |||
| 24 Hours vs. 48 Hours | -1066 | Yes | *** |
| 24 Hours vs. 72 Hours | -1718 | Yes | **** |
| 48 Hours vs. 72 Hours | -651.9 | Yes | * |
| 100% CSF | |||
| 24 Hours vs. 48 Hours | -570.1 | No | ns |
| 24 Hours vs. 72 Hours | -950.3 | Yes | ** |
| 48 Hours vs. 72 Hours | -380.3 | No | ns |