
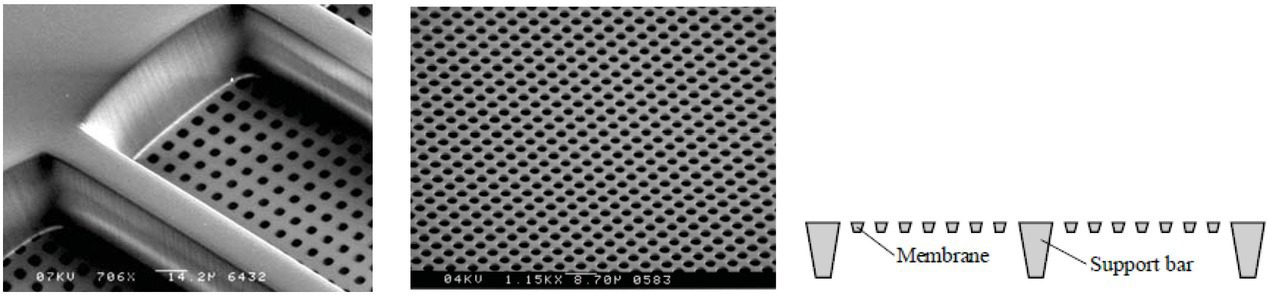
Figure 1
Picture of the membrane.
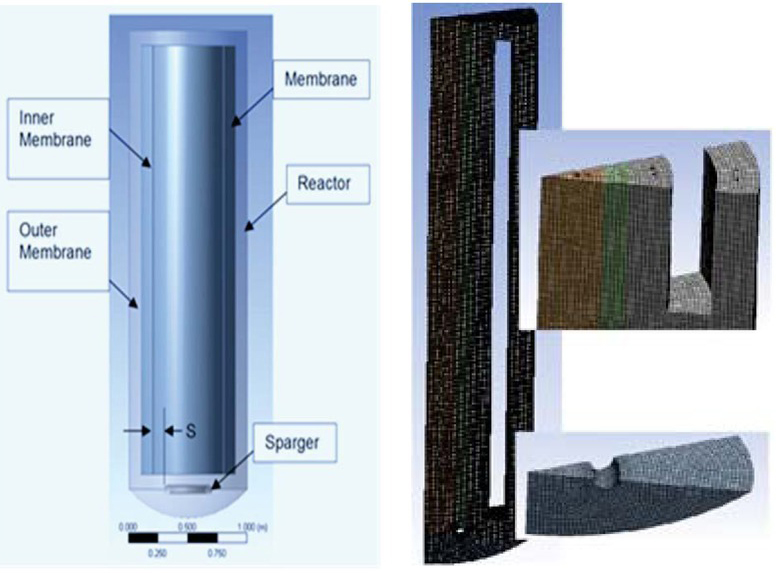
Figure 2
Geometric model of the bubble column with membrane module.
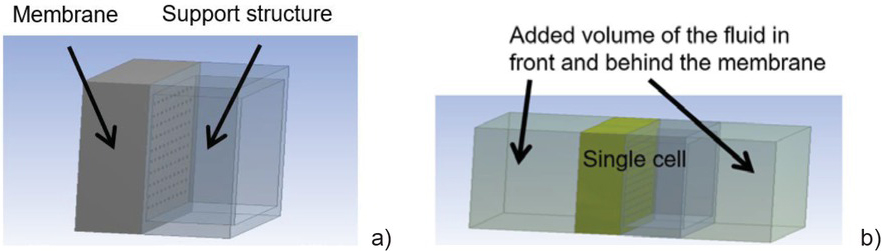
Figure 3
Geometric model of the cell, created with a CAD modeler. (a – basic volume of the single-cell; b- the added volume of the fluid in front and behind the membrane)
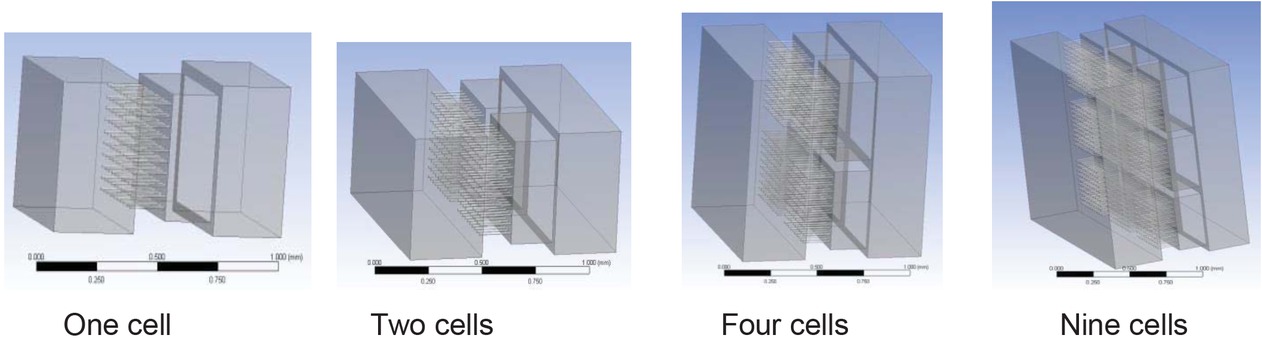
Figure 4
Geometrical model of the fluid part for a different number of single cells.
Table 1
| k (m2) | Q (numerical) (m3/s) | Q (Darsy’s law) (m3/s) |
|---|---|---|
| 1.00 E-13 | 5.65 E-09 | 5.56 E-09 |
| 1.00 E-10 | 5.60 E-06 | 5.56 E-06 |
| 1.00 E-08 | 5.61 E-04 | 5.56 E-04 |
| 1.00 E-07 | 5.56 E-03 | 5.56 E-03 |
| 1.00 E-06 | 3.90 E-02 | 5.56 E-02 |
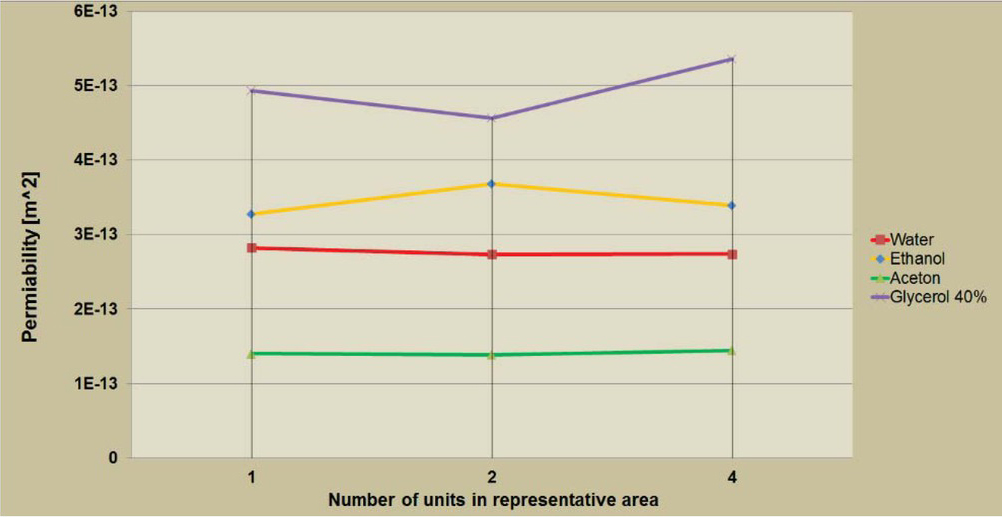
Figure 5
The permeability of the membrane by simulation of one, two and four cells from the representative area of the membrane structure and for fluids with different viscosity.
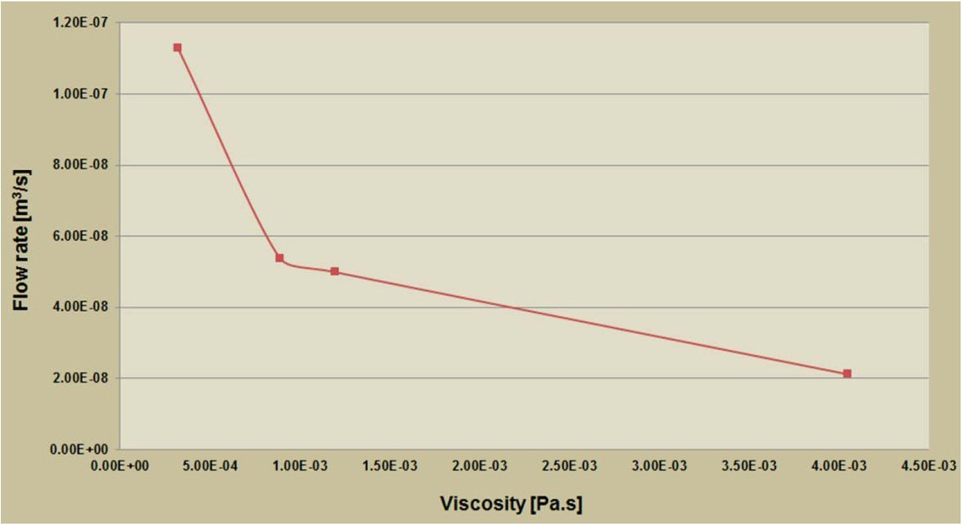
Figure 6
The fluid flow depending on the viscosity.
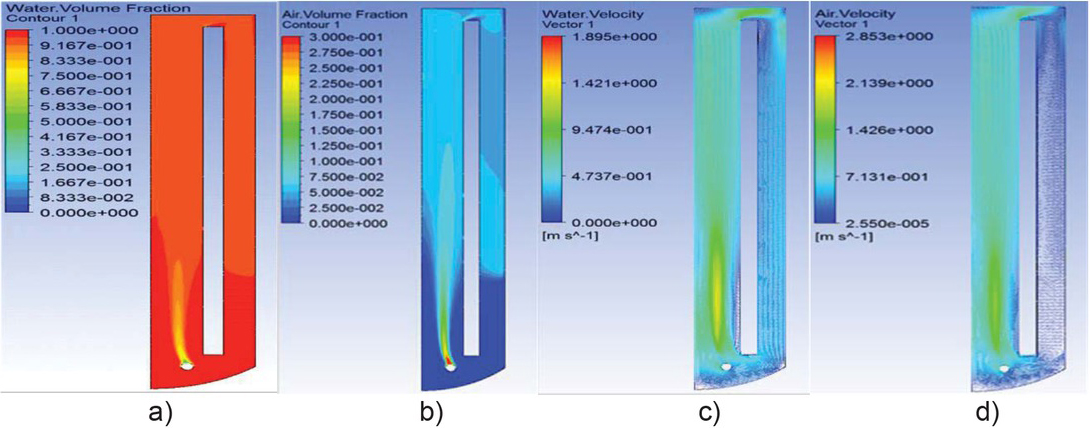
Figure 7
Water volume fraction (a), gas holdup (b), water velocity (c) and air velocity (d) in bubble column at the numerical solution with superficial gas velocity 0,5 m/s and bubble diameter 3 mm.